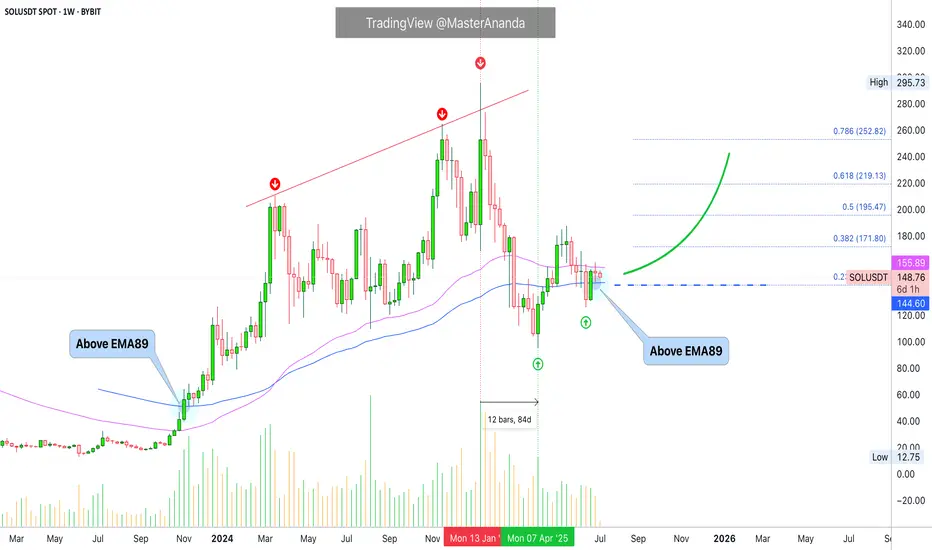
Solana Moving Averages: Patience is KeySolana is trading above EMA89 while at the same time trading below EMA55, we have a mixed situation. When in doubt, stay out. Anything is possible on this chart.
There was a major correction already that lasted 84 days. Solana lost more than 65% in this correction. A -67% drop. This correction removed all gains from 2024 sending prices back below $100. This is to say that Solana already went through a full and major flush.
The market could very easily continue lower and produce a lower low compared to 7-April, a major crash leading to August and I can easily see this scenario developing. Will it develop? Is it really necessary?
I can also see a slow but sure change of course. A few days red at the start of the week, as it is usual and then Boom!, the market turns green. And it grows day after day after day. It is already happening, patience is key. Better focus on the numbers.
» If Solana trades weekly above $142, we are bullish, strongly bullish and can expect additional growth.
» If Solana moves and closes weekly below $142, market conditions still remain bullish but we can approach this pair with caution.
» On a broader perspective, any trading above $95, the 7-April low, is bullish long-term. As long as this level holds, we can expect higher prices. The last low sits at $126...
It doesn't matter how you slice it, the price is good and is more likely than not to continue to increase. Patience is key.
Namaste.
SOL
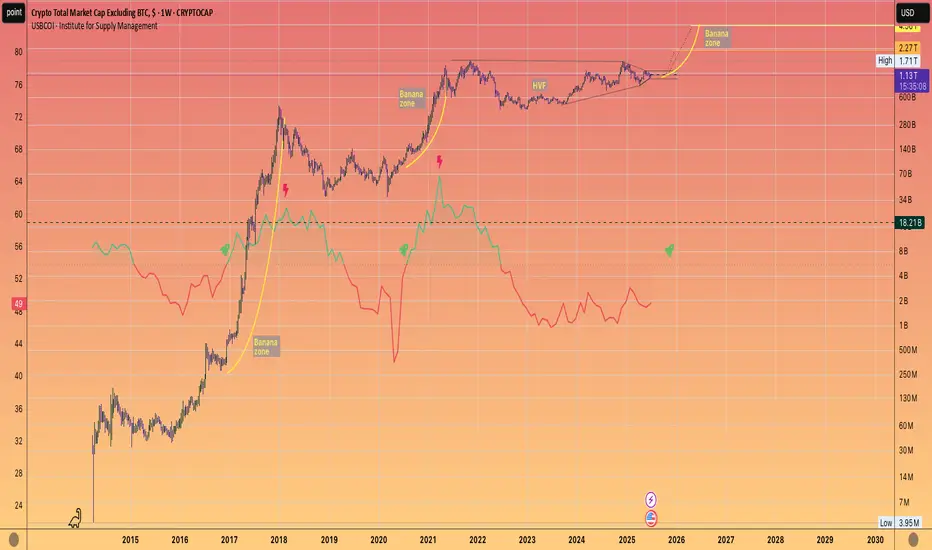
Banana zone starts when PMI is above 53.Check your charts to verify this fact.
Total 2 with the US Purchasing Managers Index overlain.
The PMI is one of the most reliable leading indicators for assessing the state of the U.S. economy.
Previous Banana zones have coincided with the PMI above 53.
so not just when the economy is growing, but when the economy has entered humming along approaching full acceleration.
This is when most people will feel confidence and WANT to take on more risk as they are most optimistic about the future when the economy is in this state of being.
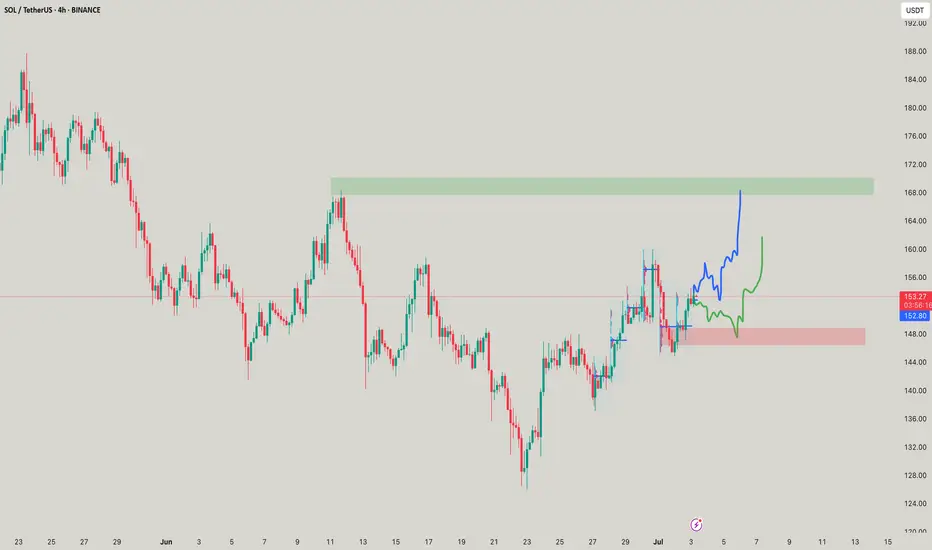
#SOL Update #2 – July 5, 2025🔴 #SOL Update #2 – July 5, 2025
Yesterday, I mentioned that Solana was at a critical level and not suitable for long or short entries. I also noted that I’d stay in watch mode and that hasn’t changed.
Right now, SOL is trying to hold above the support box, but volume remains quite low. Even worse, footprint data is showing negative pressure. If SOL loses the $144.5 level, I expect a move toward the $137–136 zone, as mentioned in my previous update.
Let’s also not forget that the $150 area is a strong resistance. At this stage, I don’t see any high-probability setup on either side. I’m still watching. No trade for now.

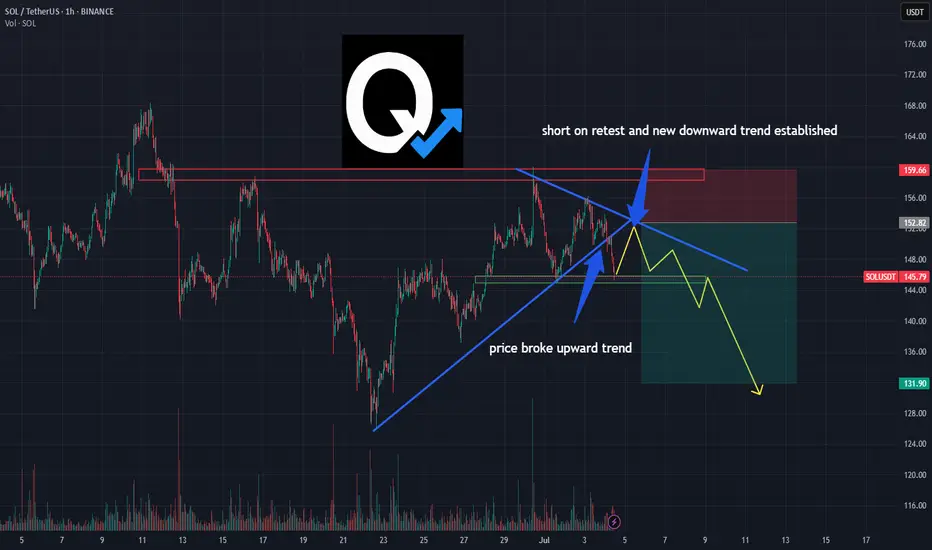
SOL/USDT Breakdown: Bearish Retest Sets Up ShortPrice action on SOL just confirmed a key structural shift 📉
The ascending trendline has been broken, and we’re now seeing a textbook bearish retest below prior support — which is flipping to resistance.
This setup suggests momentum is turning.
A lower high beneath the new downtrend line points to possible continuation toward the 132 zone.
• Trendline broken
• Retest in progress
• Short thesis active unless price reclaims 159+
This is not financial advice — just a breakdown of a technical idea based on structure and market behavior.
#SOL #CryptoTrading #TrendBreak #BearishSetup #TechnicalAnalysis #TradingView #QuantTradingPro
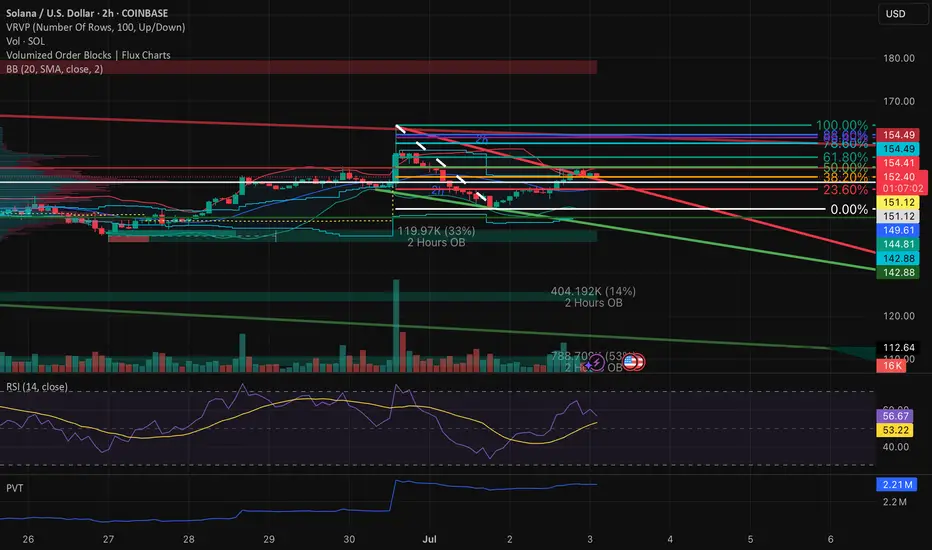
SOL – Compression at ResistanceAfter retracing up toward the 50% Fib level (around 154.3–154.4 on the daily chart), SOL/USDT has now stalled beneath key resistance and is rolling back into the reaction range. A close look at both the 1D and 2H charts reveals a clear case of a failed swing high rather than a trend reversal.
1. Structural Context
SOL remains inside its broader downtrend channel (green lines). The bounce off the June low carved out a higher low, but the subsequent rally ran into:
The daily descending trendline (red) from the June high
The 50% Fib retracement of the June down-leg (154.3–154.4)
A sell-side order block (red volume bars on the left VPVR)
The daily 20-period SMA and upper Bollinger Band
Because price could not clear these layers, the move shows the characteristics of a lower high inside a downtrend rather than a genuine breakout.
2. Multi-Timeframe Confirmation
Daily (1D) Chart
Retracement: Peaked at 50% Fib then reversed.
Volume Profile: Thick VPVR node at 154–156 acted as a supply shelf.
Bollinger Bands: Upper band contained the rally.
RSI: Pulled back from ~55 and printed a lower high as price challenged 50%.
PVT: Flat, indicating no real net buying during the bounce.
2-Hour (2H) Chart
Trendlines: A shorter-term red downtrend line capped the local rally near 154.
Order Blocks: Green buy-block around 137–140 held the low; red sell-block around 154–157 limited upside.
RSI: Printed a lower high on the second leg up, even as price revisited prior highs.
Volume: Tapered off on the approach into the 50% Fib zone, then increased on the pullback — a sign of distribution.
3. Key Levels & Next Moves
Immediate Support:
152.2–152.5 (38.2% Fib)
151.1–151.9 (23.6% Fib & daily BB midline)
Structural Support Zones:
146.1–144.6 (prior consolidation & lower Bollinger band)
141.5–140.9 (secondary order block)
134.0–137.0 (major demand cluster)
Immediate Resistance:
154.3–154.4 (50% Fib + daily trendline + SMA)
156–158 (78.6–100% Fib band + higher-timeframe supply)
If SOL fails to hold 152.2–152.5, look for a retest of the 146–144 zone. A breach below 144 opens the path back toward the 137–134 order block. Conversely, a sustained reclaim of 154.4 on volume would be needed to shift the short-term bias neutral.
4. Conclusion
This sequence—bounce into 50% Fib, capped by overlapping resistance, followed by divergence in momentum and rising volume on the pullback—confirms another lower high in SOL’s downtrend. Until price can clear 154.4 with conviction, the path of least resistance remains downward.
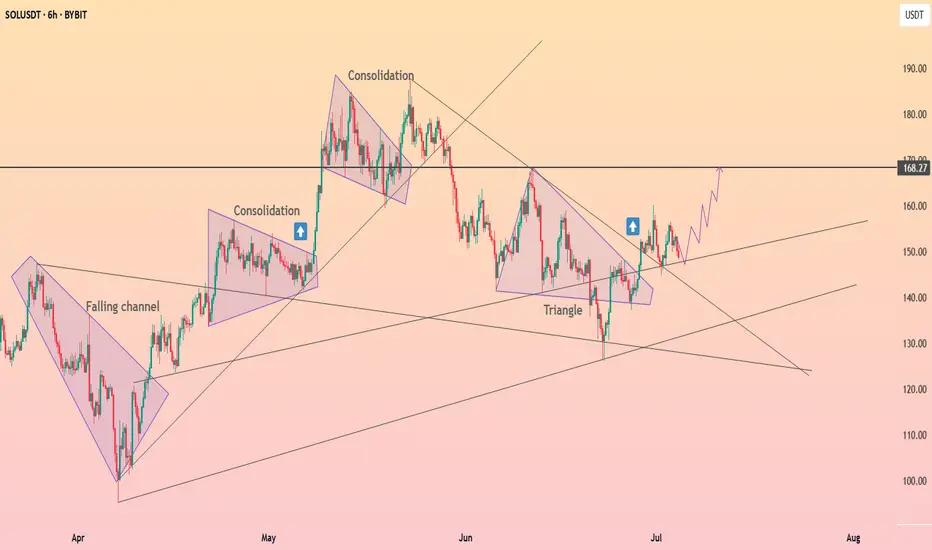
HolderStat┆SOLUSD got out of the triangleBYBIT:SOLUSDT is trading in a well-structured upward channel with a history of consolidation zones acting as breakout springboards. The price recently bounced off trend support and now targets the resistance at 170. Structure remains bullish as higher lows continue to form.
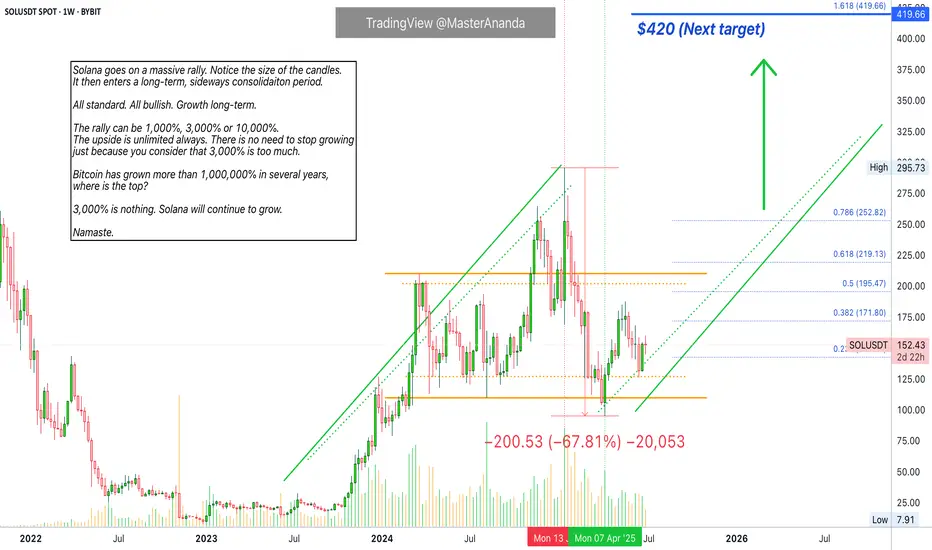
Solana Will Grow Despite "3,200% Rally"Oh my god! Folks, this friend of ours is saying Solana is going down because of a "3,200% rally." Crazy stuff. Can it continue growing after a 3,200% rally? But he is ignoring a massive correction between January and April. How big is the correction you ask? 67%. Meaning, there is no need to mention the previous rally because it has been corrected already.
Ok, hold on... Let's breatheeeeee deeply first.
Solana ETFs. Growing Cryptocurrency market. Global adoption. Old finance finally waking up to the new financial system. Even banks are starting to buy Crypto and opening up a ramp for their customers to buy Crypto, Solana, using their savings and other funds. This is why it will grow.
Think of this. Think of Apple, Inc. when it was young. Think of Tesla and Google and Microsoft. Would you quit after a 3,000% rally? Well, these companies are still growing today. Crypto is no different, it will grow for decades to come. Solana is going up. 100% certainty, you can see it on the chart; the fundamentals as well.
Get on board the bullish train, it is not too late.
Everything money goes into Crypto. You will be happy with the results.
If you stay out, your loss.
Namaste.
$SOL Bullish Breakout from Falling Channel | Eyeing $180 NextSolana (SOL) has broken out of its falling channel on the daily timeframe, indicating a potential trend reversal. After the initial breakout, SOL made a successful retest of the channel. However, it faced rejection at the 200 EMA, which is now acting as a critical resistance level.
Currently, SOL is attempting a second retest of the 200 EMA. If it breaks and holds above this dynamic resistance, we could see a swift move toward the next major target at $180, with potential to eventually revisit the previous all-time high near $260.
Supporting the bullish outlook:
📈 RSI is showing bullish divergence, confirming upward momentum.
📊 Price action is forming higher lows, establishing a clean uptrend structure.
🔍 Key level to watch: $156 resistance. A daily close above this could confirm the next leg up.
📌 Key Levels:
Resistance to break: $156
Short-term target: $180
Extended target: $260
EMA to watch: 200 EMA (Daily)

SOL - He sees everything!Ironically - It took my local SL and went up, but now it have two moves - two moves means either on the down bottom to top or moves directly on the top as said!
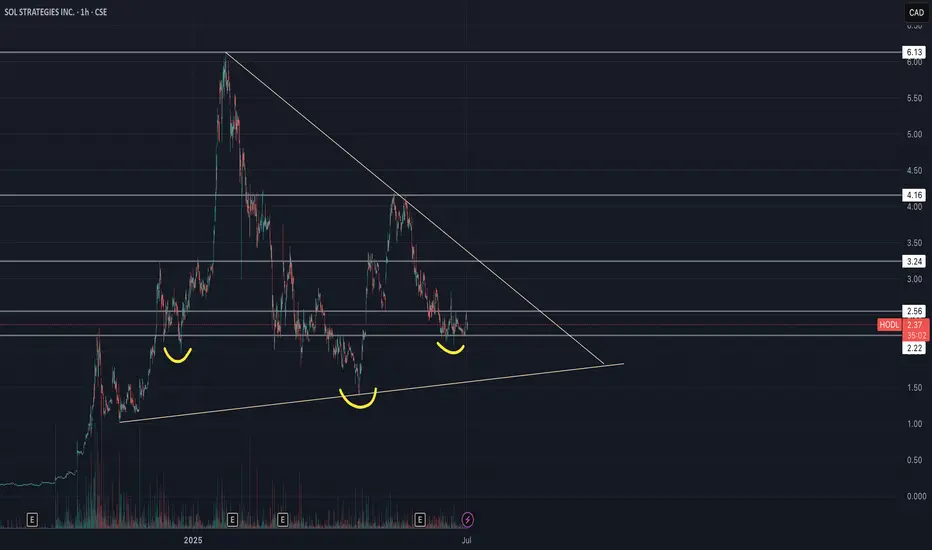
Sol Strategies Inc (HODL) - Inverse H&S🚀 SOL Strategies (HODL) – Public Market Gateway to Solana Yield
SOL Strategies (CSE: HODL) is a publicly traded company laser-focused on the Solana ecosystem. With nearly 395,000 SOL held (most of it staked) and over 3.7 million SOL delegated to their validators, they generate consistent income through staking rewards and validator commissions.
Their business model is simple:
📌 Accumulate SOL → Stake it → Run institutional-grade validators → Earn yield
📌 Expand through partnerships (3iQ, Neptune, BitGo, Pudgy Penguins)
📌 Hold strategic Solana ecosystem tokens like JTO and jitoSOL
📌 Operate with SOC 2-certified infrastructure and pursue a Nasdaq listing
SOL Strategies is not just holding crypto – they are building core infrastructure for Solana, giving equity investors direct exposure to staking economics in one of the fastest-growing blockchain networks.
📊 For traders: HODL stock offers a pure-play vehicle for Solana exposure, with an income-generating twist.
⚠️ Always do your own investment research and make your own decisions before investing.
Bitcoin summer of fun...If we are in a continuation pattern, and Bitcoin breaks the neckline soon.
We could be on the cusp of a very interesting and strong few months of price action.
Continuation upward sloping #inverseheadandshoudlers

Sol searching, for an entry. If you find this information inspiring/helpful, please consider a boost and follow! Any questions or comments, please leave a comment!
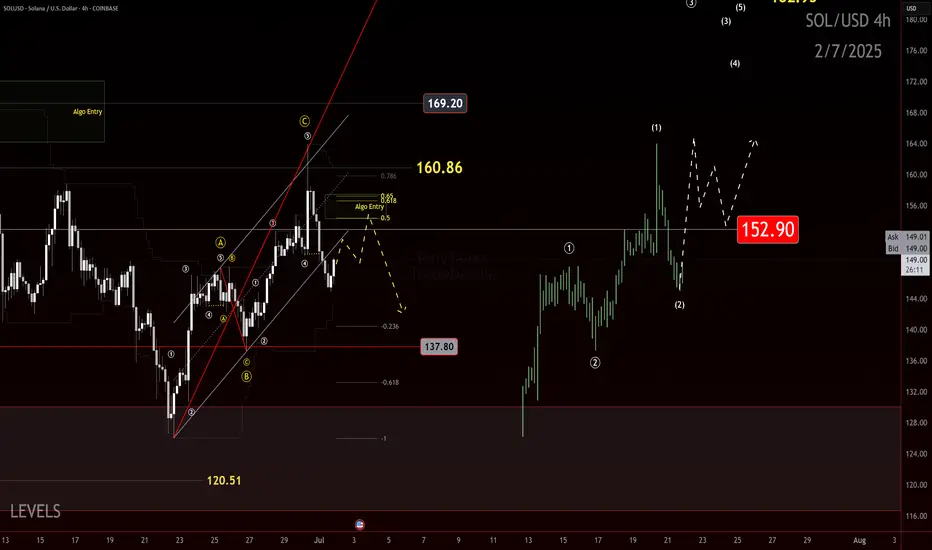
The Elliottician’s Paradox: 12-12 or Zigzag? Bias Is the Key
Ever stare at a chart and ask, “Is that a 12-12 or a classic zigzag?” Yeah… welcome to the paradox we Elliotticians live in. Pattern recognition’s a blessing and a curse because context is everything, but confidence can get you wrecked.
This one’s got me on the edge.
What’s Happening Here
We’re currently watching a move that could be either:
- A corrective zigzag (5-3-5), or
- A 1-2, 1-2 setup, gearing up for a blastoff
That’s the core dilemma — two valid options, both technically legal. So what tips the scales? Bias.
The Line in the Sand: 152
Here’s what I’m watching for:
Key Level: 152
- That’s the bull/bear line for me.
- A strong impulsive reclaim above 152 flips the script. I’d reconsider the bearish view if price surges with intent.
- But if we return to 152 in a sluggish, corrective way? I’ll be eyeing continuation lower, aligned with a more traditional zigzag structure.
Elliott View
This is where the paradox plays out:
If we’re looking at a 1-2, 1-2 setup, expect:
- A powerful Wave 3 soon (should not be shy)
If it’s a Zigzag ABC:
- Then we should expect a corrective internal retracement and continuation to the down side, at minimum past the origin of the initial move.
The chart will speak loudest. But structure and strength of this next leg will confirm the story.
Final Thoughts
Trading isn’t about being right. It’s about managing scenarios — and this one’s a classic fork-in-the-road moment. I’ve got a plan for both directions.
152 is my trigger. Stay below it and fade the rally. Break above it impulsively, and I’ll flip my bias with it.
The Elliottician’s paradox isn’t a trap — it’s an invitation to stay sharp.
Your Turn
How are you reading this structure? Do you favor the zigzag or the 1-2 setup? Drop a comment and let me know.
Trade safe, trade clarity!
HolderStat┆SOLUSD aims for the $170 levelBINANCE:SOLUSDT has broken above triangle resistance, retesting the $146.60 level as new support. The breakout echoes earlier consolidation-based rallies, opening the path toward $170. As long as the structure remains intact, bulls could extend the climb over the next few sessions.

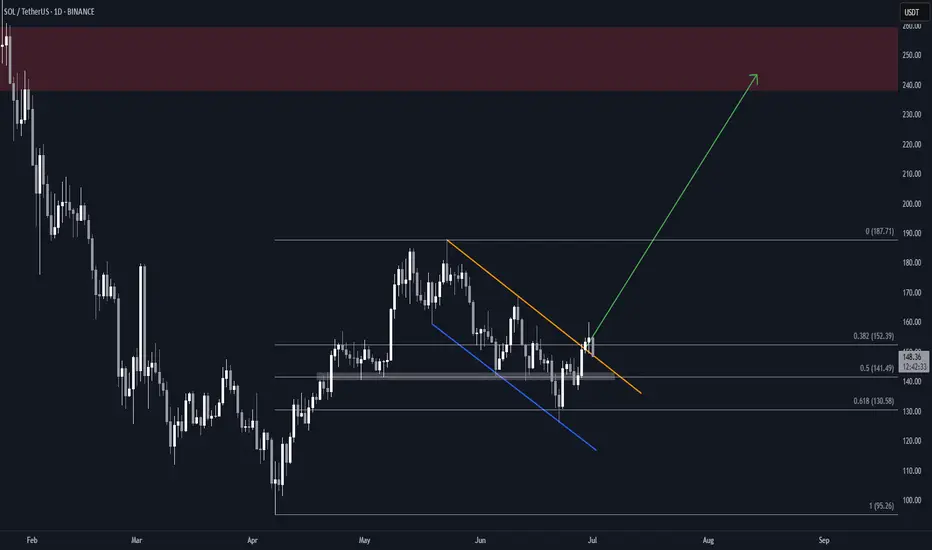
Solana (SOL) Flag & Pole Breakout (1D)BINANCE:SOLUSDT broke out of a textbook falling wedge two days ago, and is now retesting the former resistance as support.
Key Technicals
• Falling channel with clean structure and multiple touches
• Resistance trendline broken
• Price now retesting the breakout zone (~$148)
• Overhead supply zone at $238–$260
• Measured Target: $240, within supply
Why This Setup Matters
• Clear breakout followed by a retest, which can often precede the next leg up if support holds
• Falling channel retracement aligns with 0.618 Fib, a common reversal area
What to Watch
• Daily close above the previous resistance trendline
• Push above the local $160 high for full confirmation
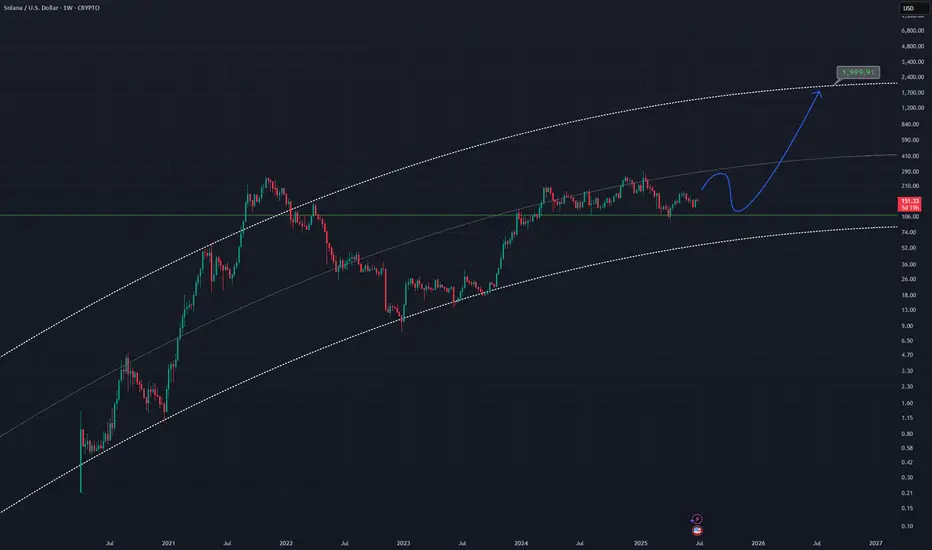
SOLUSD - Bull Ideaan idea for the bulls showing a curved channel rising
Once the bulls kick in price may push up to the top of this channel as it has before, putting price at around 2k
SOLUSD is a good altcoin pick imo
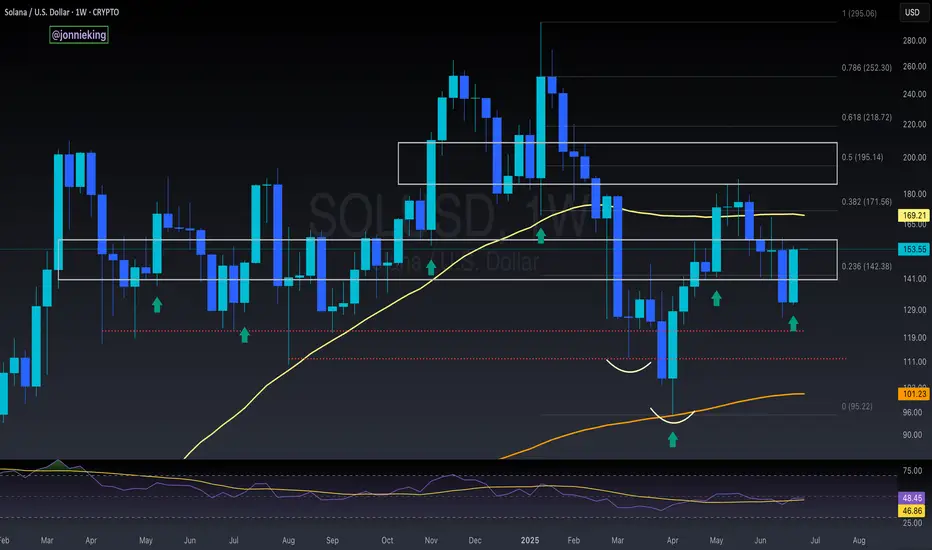
Weekly chart
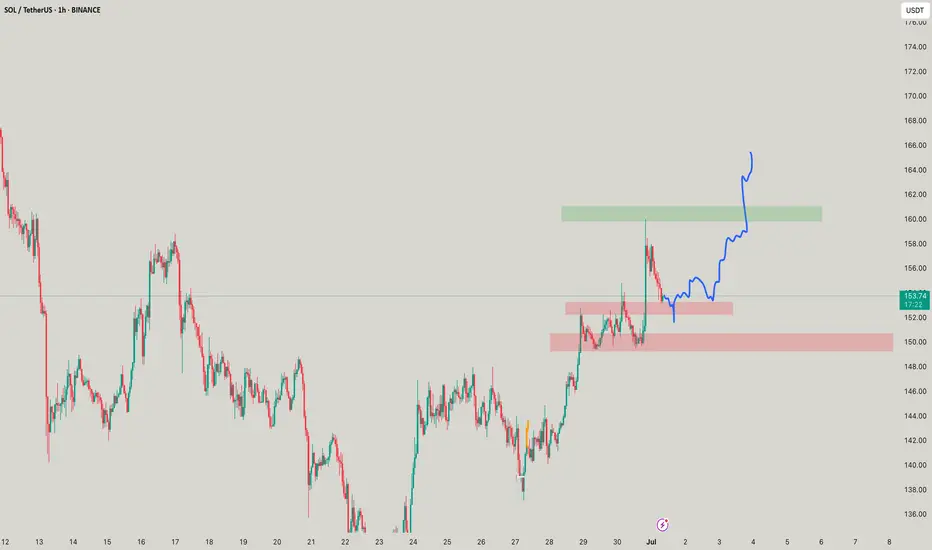
Your SOUL is for SOLSO SOL looks very nice to cruise up as stated earlier, targets for 161 can be seen!
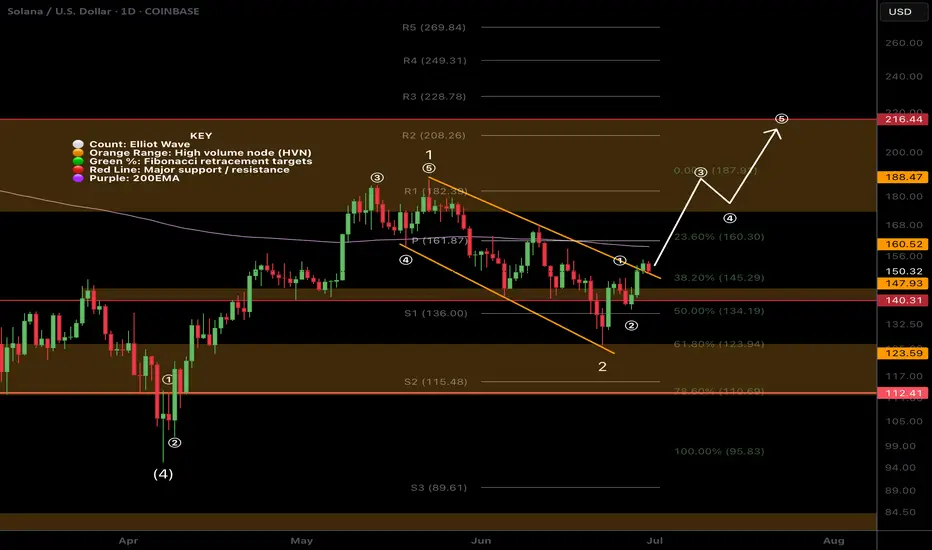
SOL Ready To Breakout?SOL had a decent move this weekend overcoming descending resistance and now testing as support.
Price appears to have a completed a wave (2) at the .618 Fibonacci retracement and S1 daily pivot and a larger degree wave 2 at the channel bottom, High Volume Node support and .618 Fibonacci retracement.
If a wave (3) of 3 is underway then we should expect a strong move sooner rather than later with an initial target of the swing high resistance a/ R2 daily pivot $208-$216 range
Safe trading.
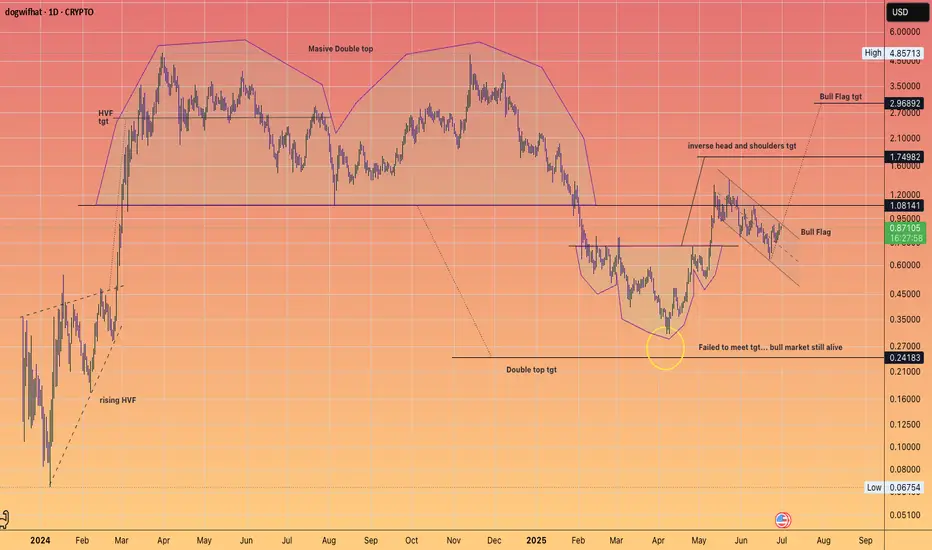
WIF back to $3Complete look at Dog WIF Hat
We had some pretty nice technical setups on this meme.
#HVF
#DoubleTop
#InverseHeadandShoulders
#BullFlag
Currently it has two active patterns ...
$420 Solana Within 2 Months —TargetsSolana is on a path to a hit a price target of $420 mid-term, within 1-3 months. This is the continuation of the uptrend that started in early April with the end of the previous correction and a more than a year long strong low.
This is not for the faint of heart. Solana is preparing for something massive, even scary but positive. $600+ is also possible but we are going step by step and $420 is the first step.
Immediately when prices start to rise Solana is likely to find resistance around $220 and $253.
The last high, January 2025, would be the minimum on this bullish wave. This would be price tag of $296.
The end of the retrace happened 22-June. This means that the market is already bullish for an entire week. Bitcoin is about to produce the best possible weekly close. As Bitcoin is ultra-bullish above $106,000/$107,000, the altcoins can continue to recover and will aim higher trying to catch up. Of course, no altcoin can catch up to Bitcoin but invariably the entire market will grow.
The wait is over, we are bullish now. Timing is great.
Bullish momentum will grow for weeks and then a major force will permeate the market, something not seen in many years. I hope you are prepared.
Namaste.

$SOL Bullish Engulfing On WeeklyCRYPTOCAP:SOL closes the week with a Bullish Engulfing candle.
50WMA at $170 next target to smash.
NothingThe SOL will increase $150 and reach to the top of the wedge in the coming weeks .
Best regards CobraVanguard.💚

SOL - You take its SOUL!SOLLLLL is going to get a hump of liquidity touch it and fall down, what can be more better than knowing what you doing hahahahha

HolderStat┆SOLUSD breakoutBINANCE:SOLUSDT on the 6h chart has shifted from a falling to a growing channel structure. Support around $135 held, and now the price is eyeing $160–$170. Previous breakouts from similar structures have triggered steep gains.
