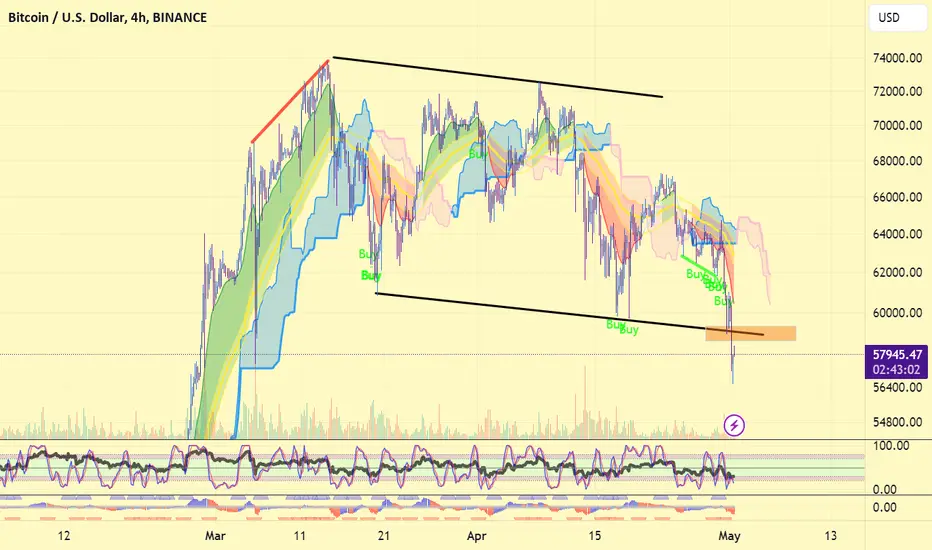
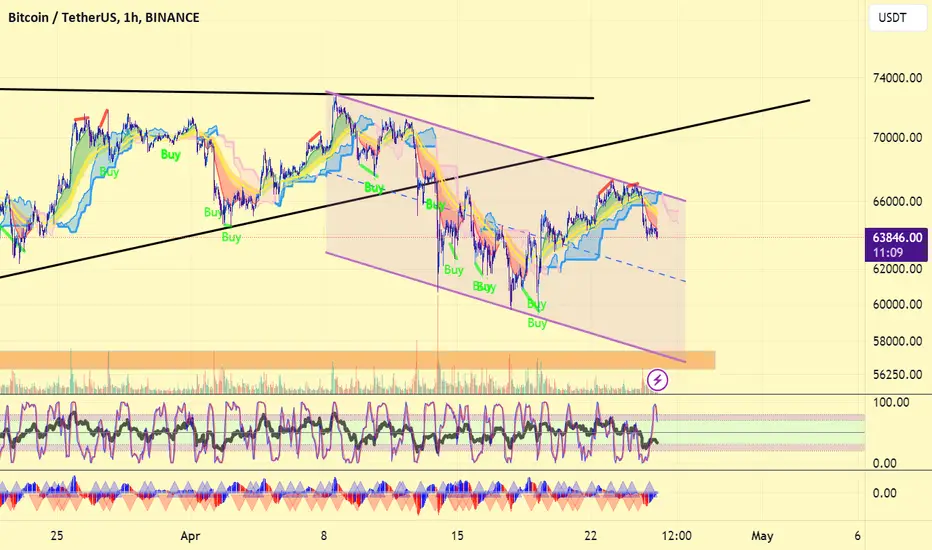
$BTC Bearish retest#bitcoin #btc has lost the falling channel support and now hanging below. Former trend support is now resistance. #btcusd price may test the orange box. This is also the bearish retest. Declination will cause dump to continue. Not financial advice.
SOL
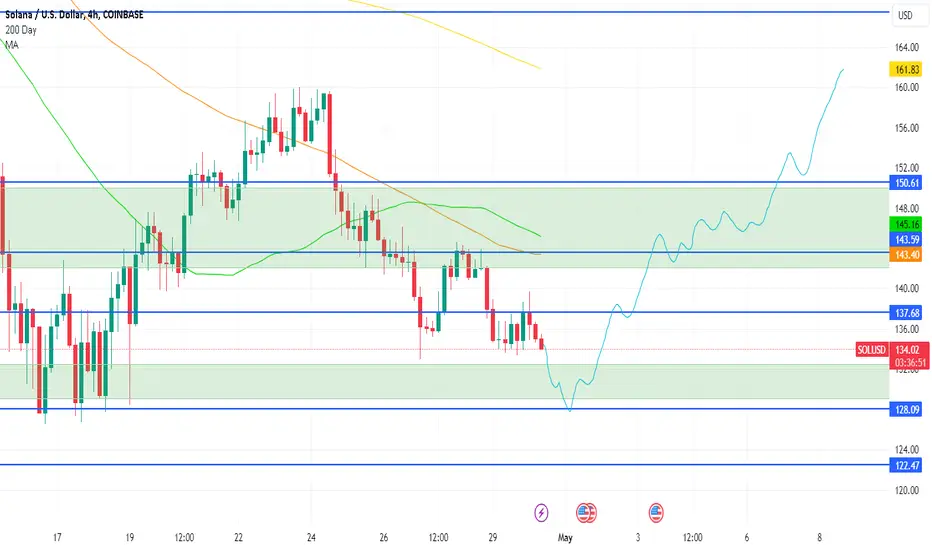
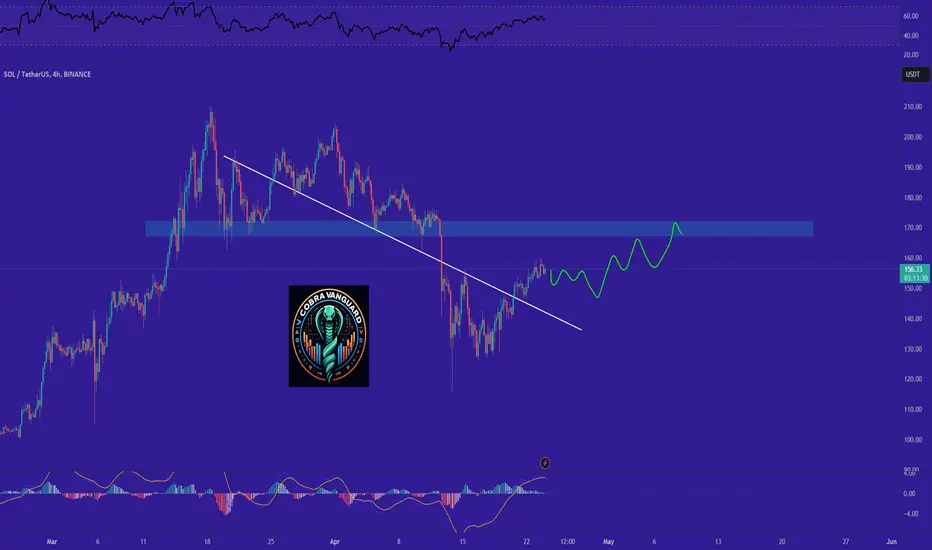
SOL: Sweep USD 130 before restarting run SOL price is trading in no man's land and is not worth to trade until a trigger happens. My bias would be for a sweep of low $130 (likely touching $128 in a liquidation event) and restart the growth. First target 140 second target 150 if we get that.
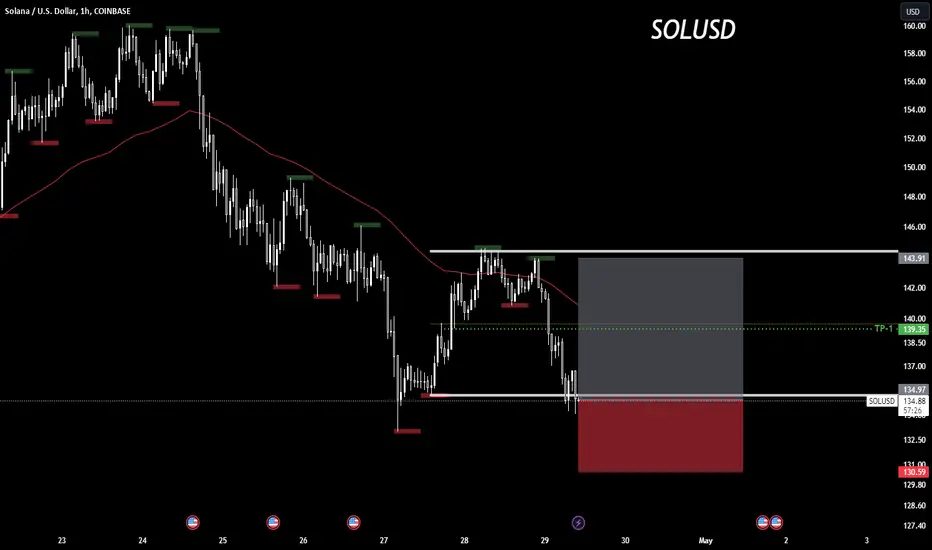
SOL: ny money management📊Analysis by AhmadArz:
🔍Entry: 134.97
🛑Stop Loss: 130.59
🎯Take Profit: 139.35 - 143.91
🔗"Uncover new opportunities in the world of cryptocurrencies with AhmadArz.
💡Join us on TradingView and expand your investment knowledge with our five years of experience in financial markets."
🚀Please boost and💬 comment to share your thoughts with us!
📉 SOL Trading Plan 🚀Observation:
SOL faced rejection at $160 and retraced to a supportive zone. Potential correlation with BTC's performance.
Trade Setup:
Entry: $126 - $140.
Take Profit: $160 - $170 or $200 - $220.
Stop Loss: Tight below $120 or BTC's $60,000 support loss.
🚨 Risk Management:
Trade is against BTC's downtrend on higher time frames.
Monitor BTC closely; any loss of support prompts trade exit.
📊 Strategy Rationale:
Anticipate SOL's recovery if BTC maintains $60,000 - $61,500 support.
Tight stop loss minimizes potential losses in uncertain market conditions.
📉🔍 Stay attentive to BTC's movements for trade adjustments! #SOLTrading #BTCAnalysis 📈🚀

SOLANA - $600 on the Cards?👀📉Hi Traders, Investors and Speculators of Charts📈
Solana has made some great increases, and it's retraced back to support levels. I've been bullish on Solana since the beginning of 2024, when SOL was still sub $100. Take a look here at other altcoins that we've been watching:
By looking at the Drop-and-Pop fractal we've been watching, we can conclude that for the short term, the support zones should hold at $140, with wicks as low as $120. When incorporating this into Elliot Wave Theory, our next impulse up (wave 4-5) should take us to roughly $290.
But it doesn't end there. When we zoom out, and view the chart from a macro perspective, we see a different structure of Elliot waves... We're possibly still in wave 0-1! And if we use the same Elliot wave ratios to calculate wave 5, (% of wave 1 OR 161.8 x wave 1 length) then wave 4-5 takes us even beyond $600.
It's important to note though, that this is a multi-month and potentially multi-year target. Although SOL has previously increased 500% in a few weeks, the markets are more mature than they were in early days with many more adopters and institutional investors joining the game.
If you found this content helpful, please remember to hit like and subscribe and never miss a moment in the markets.
_______________________
📢Follow us here on TradingView for daily updates📢
👍Hit like & Follow 👍
CryptoCheck
COINBASE:SOLUSDT BINANCE:SOLUSDT

SOLUSDT 1HInterval ChartHello everyone, let's look at the 1H SOL to USDT chart, as we can see the price has entered a sideways movement and is breaking sideways from the local downtrend line.
Let's start by setting goals for the near future that we can include:
T1 = $154
T2 = $162
T3 = $168
AND
T4 = $175
Now let's move on to the stop-loss in case of further market declines:
SL1 = $142
SL2 = $137
SL3 = $130
AND
SL4 = $112 - $105
When we look at the RSI indicator, we will see that we are bouncing off the downward trend line, but we can see that the lateral price movement results in an increase in the indicator, which may again translate into an attempt to drop the price.

📈 SOL Trading Analysis 🚀Support & Resistance Strategy:
SOL has retraced to a support level, suggesting a potential bounce. Anticipate movement towards upper resistance levels.
Trade Setup:
Entry: $140 at current support.
Take Profit: $160-$170 or $200-$220.
Stop Loss: Just below $135.
Market Observation:
Recent market activity shows a range-bound pattern.
If SOL struggles to breach the next resistance, consider exiting to secure profits.
📊🔍 Stay alert for SOL's movements! #SOLTrading #CryptoAnalysis 💰📈

(SOL) solanaWill solana win in price and surpass all time high without stopping slowing down or rejecting the new all time high prices? ...
SOL Solana Technical analysis and Trade IdeaSOL has broken structure to the downside. Do we see a retrace and then further bearush price action? In the video we take a close look at a couple of possibilities. Info is educational in nature and not financial advice.

$BTC bearish continuation#bitcoin price is declined hard from the top of the falling channel and 66600 #usd (getting more interesting) resistance zone. Now, #btc has weakened structure in short term.
Chart formed bearish head and shoulder pattern. I expect bearish continuation with choppy moves , dead cat bounces etc. The target may the bottom of the channel 57 - 58K zone. Also there' s nice liquidations there.
If #btcusd price follows this path, #altcoins will surely suffer more. When most of #altcoin prices retraces to their retest zone of 2023 October - 2024 march bull run, then i expect very favorable bounces from #alts there. We may see a minor #altseason when this happens. But i say "minor".
Not financial advice. DYOR.
SOL USDTSOL Setup. After a confirmed breakout from the marked zone in green, we could take an entry at 161.08. Remember stop loss is your friend. Everything is on the chart.
Entry 161.08
S.L 152.78
T.P 1 167.76
T.P 2 175.78

Bullish or bearish Trend for SOL?BINANCE:SOLUSDT
Observation: Broken from above of the hidden trend, expecting to see a small continuation to the downside, and then from there we will see a reversal with a good strong bullish momentum that will take us back around the price of $170.
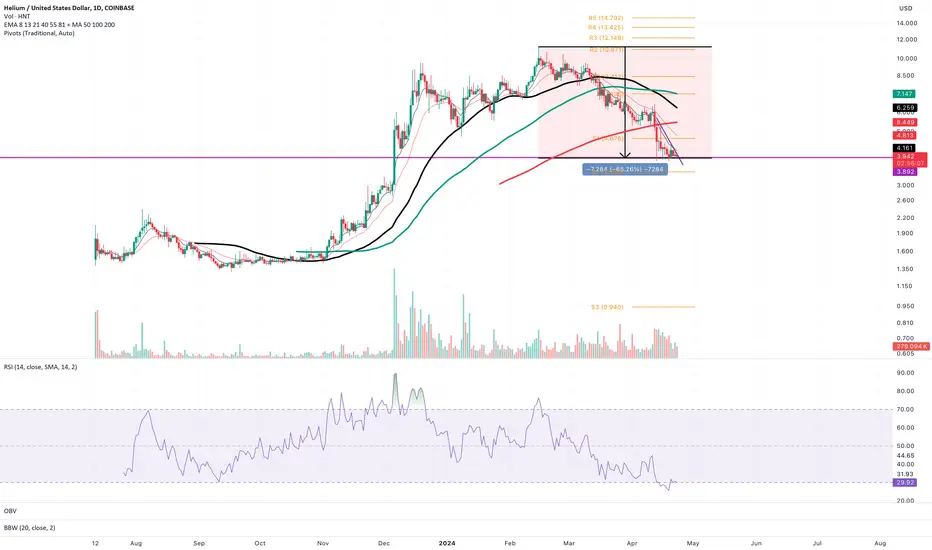
Helium: Another Shitcoin Down The Drain!Look at the chart and recogize. That is a SHITCOIN SCAMCOIN chart.
Down -70% and far from done crashing. If $3.90 breaks, it's all the way down to $0.50 for this turd.
This will be the fate of all SOL #Solana ecosystem scam shit coins such as HNT #Helium and MOBILE #Mobile.
I would not be surprised if this drops another 95% from here.
Helium , Helium Mobile , and all other #DePIN shitcoins linked to Solana ecosystem are dying in real-time and we are lucky enough to witness it.
Shorting this on leverage = EZ, free money!
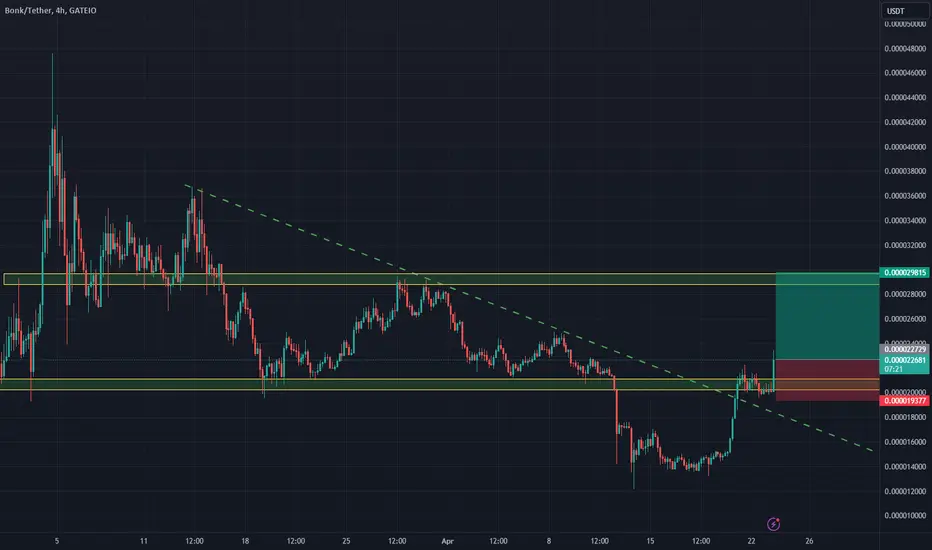
BONK longBONK broke through the major descending resistance line and the resistance level. Bullish movement is expected to reach the next resistance level.
Solana - SOL Fractal NO ONE talks about📉Hi Traders, Investors and Speculators of Charts📈
SOLANA is on the list of my top 20 altcoins to watch in 2024.
From a macro chart perspective, I'd like to point out a large-scale fractal that I'm labelling as the "drop-and-pop".
What we observe here is 1)accumulation phase followed by 2)first impulse up after which we se a 3)correction and then finally the 4)second impulse wave .
From a technical indicator view we know that the price is bullish because we see a "Overbought" flash on the weekly, which usually indicates strong bullish momentum :
Note that this, again, confirms the need for a pullback/drop before considering the start of impulse wave 2 /pop.
If you found this content helpful, please remember to hit like and subscribe and never miss a moment in the markets.
_______________________
📢Follow us here on TradingView for daily updates📢
👍Hit like & Follow 👍
CryptoCheck
BINANCE:SOLUSDT

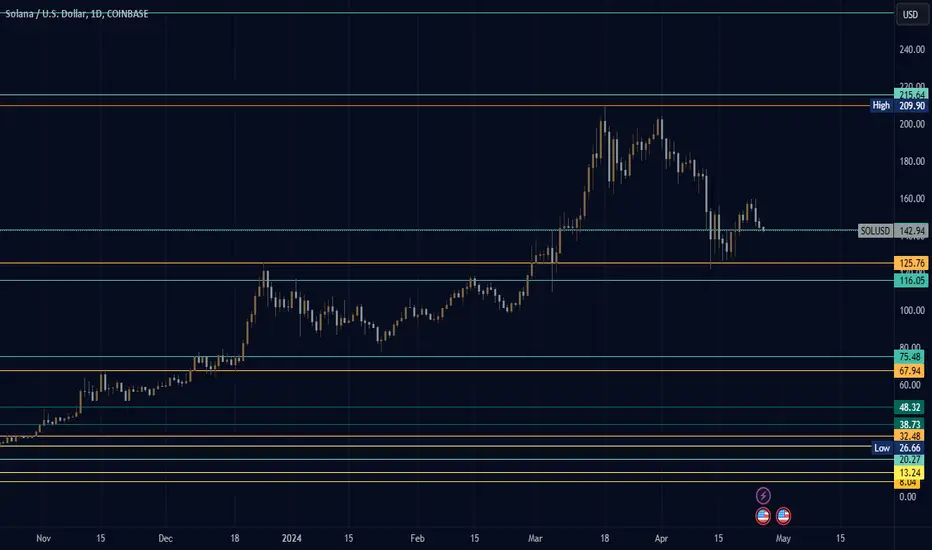
SOLUSDT.1DThe daily chart for Solana (SOL/USDT) displays a retracement following a strong uptrend. The price has formed a peak around $210.18 and has since pulled back to current levels at $153.36. The first resistance level (R1) is now at $184.67, which could act as a ceiling for any upward moves. The next resistance level (R2) is at $211.52, just above the previous high, potentially serving as a target for a bullish continuation.
The chart also shows established support levels at $121.04 (S1) and $92.78 (S2). The RSI is just below the midpoint at 46.92, suggesting some bearish momentum, but not overwhelmingly so. The MACD is below the signal line and negative, which traditionally suggests bearish momentum.
As a trader, I would watch for the price action to approach R1 for potential resistance or a breakthrough, which could indicate a move to R2. A failure to breach R1 could see prices retest S1. Given the indicators, a cautious approach would be prudent, with tight stop losses and a close eye on both RSI and MACD for signs of trend strength or reversal.
