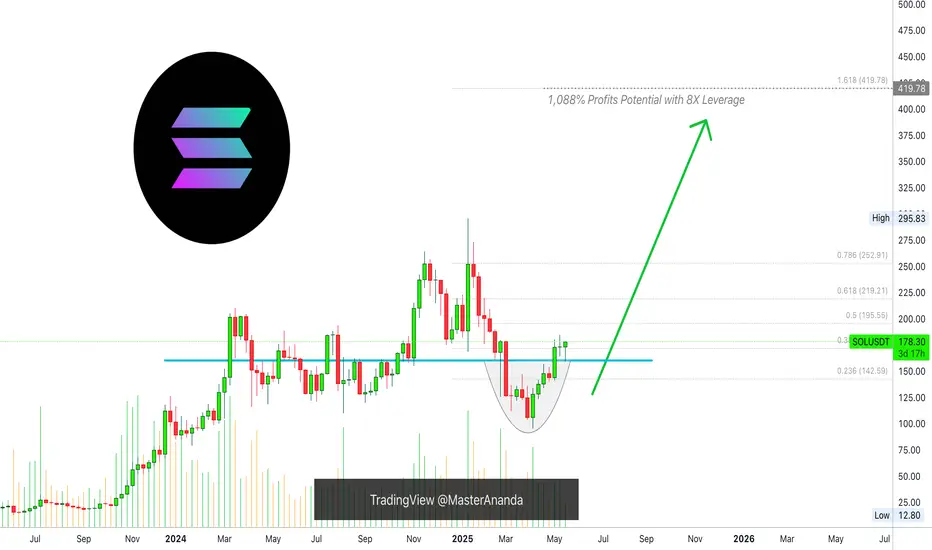
Solana 8X Lev. Full PREMIUM Trade-Numbers (PP: 1088%)Good morning my fellow Cryptocurrency trader, I wanted to give you one more high profits potential, high probability, high certainty, great entry and timing, leveraged-trade.
The Altcoins market is about to go wild and this chart setup can be a life changer if approached with the right planning and mindset, if approached in the right away.
» SOLANA —SOLUSDT
I'll let you take care of the rest.
Full trade-numbers below:
____
LONG SOLUSDT
Leverage: 8X
Entry levels:
1) $182
2) $175
3) $165
Targets:
1) $195
2) $220
3) $253
4) $296
5) $343
6) $372
7) $420
Stop-loss:
Close weekly below $160
Potential profits: 1088%
Capital allocation: 5%
____
Thank you for reading.
If you enjoy the charts, numbers and content, consider a follow.
Namaste.
SOL
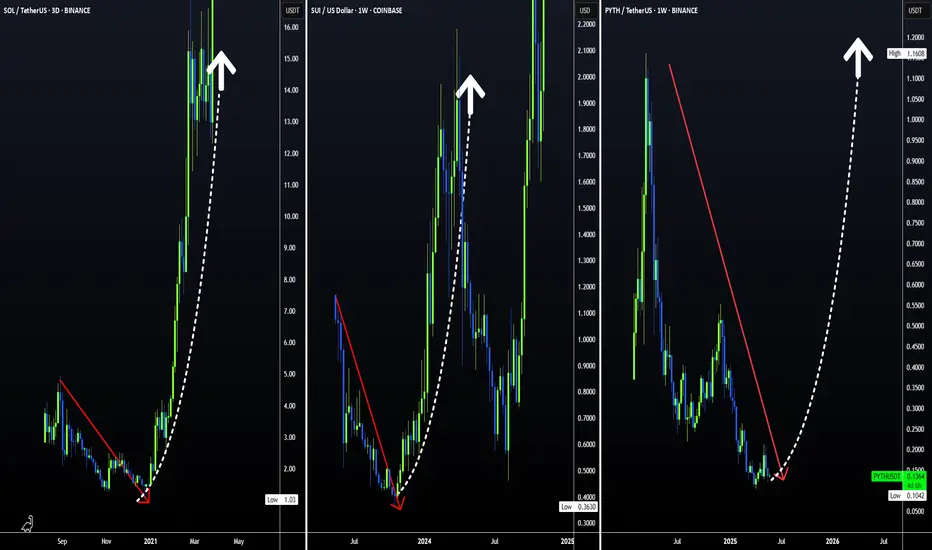
HUGE INCREASES Possible on PYT | Here's WhyPython is a fairly new altcoin with big upside.
From the earlier two charts on the left, we see that initial downturns shouldn't be feared. Historically, SOL and SUI started with downtrends and transitioned into massive upside alts.
Python might especially see parabolic increases, once ETH starts to move towards a new ATH. This will be due to the rotation of liquidity between altcoins in terms of larger and smaller market caps.
Don't miss yesterdays update on ETH!
____________________________
BINANCE:SOLUSDT
COINBASE:SUIUSD
BINANCE:PYTHUSDT
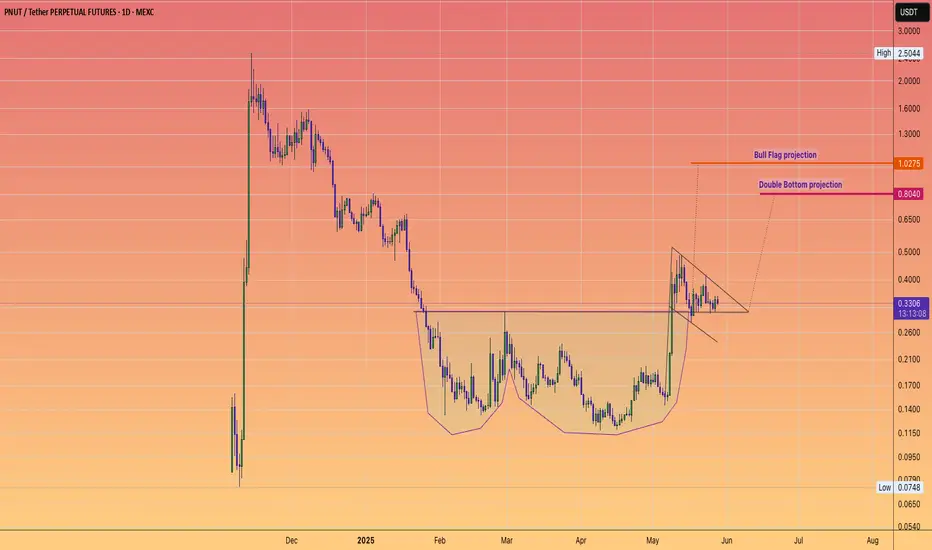
PNUT projects to a Dollar.TWO Clear patterns
Double bottom
and a Bull Flag.
Two respective Log Projections for you to consider.
This suggest strong Solana performance is incoming and another round of #Memecoin frenzy.
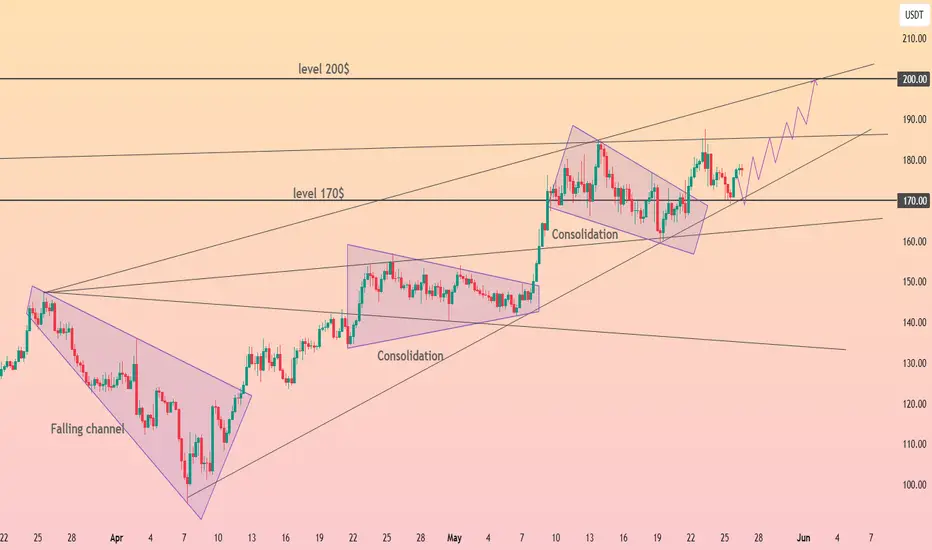
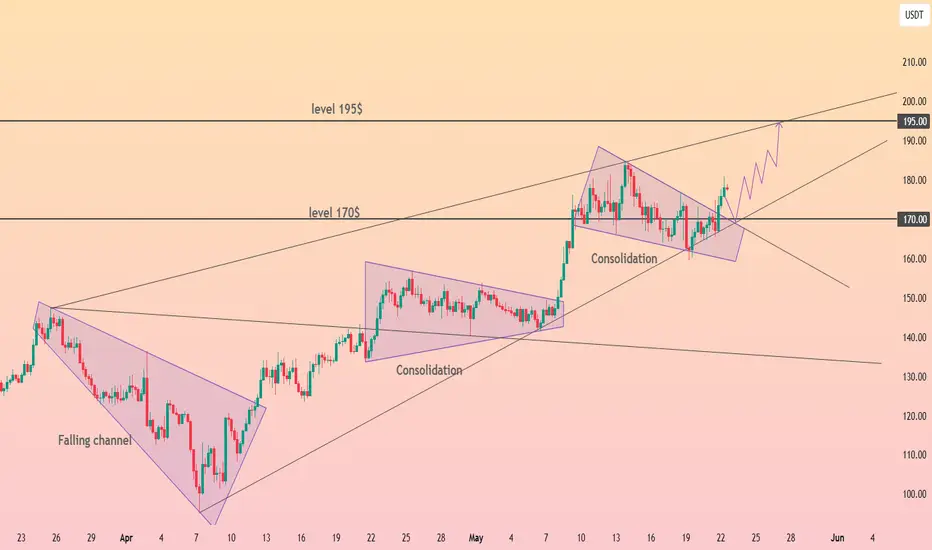
HolderStat┆SOLUSD channeling the sun toward $200CRYPTOCAP:SOL — After escaping a falling channel, price is tracking a neat growing channel between 170$ pivot and 200$ overhead resistance. Repeated consolidation diamonds reinforce upward trajectory and signal strength. Watch 160-165$ baseline—above it, 195-200$ target remains on radar.
SOL Crypto Futures Trade Plan 2025-05-26SOL Crypto Analysis Summary (2025-05-26)
Model Summaries
Grok/xAI Report
Technical: Price $176.77 above 20/50-day MAs but below 200-day SMA. RSI 60.6 (neutral-bullish). MACD shows slight bearish divergence. Bollinger bands suggest price near upper band. Sentiment: Limited positive news impact from luxury watch integration. Neutral funding rate. View: Moderately Bullish (75% confidence). Trade: Long at $177.50, SL $171.00, TP $183.00, 50× leverage, 1% equity position.
Claude/Anthropic Report
Technical: Similar MA and RSI readings; below 200-day SMA. Bollinger bands point to moderate volatility. Sentiment: Balanced funding rate; positive branding news but limited price impact. View: Moderately Bullish. Confidence 72%, below threshold—no trade recommended.
Llama/Meta Report
Technical & Sentiment: Aligns with Grok on MAs, RSI, Bollinger. Neutral overall market backdrop. View: Moderately Bullish (80% confidence). Trade: Long at $176.77, SL $171.74, TP $186.48, 75× leverage, 0.5% equity.
Gemini/Google Report
Technical: Bullish on short-term MAs and RSI but MACD bearish crossover and resistance at 200-day SMA. Sentiment: Neutral funding, niche positive news. View: Moderately Bearish short term (75% confidence). Trade: Short at $176.77, SL $179.50, TP $169.00, high leverage, size 1.
DeepSeek Report
Technical & Sentiment: Highlights 200-day SMA resistance and MACD divergence after 18.5% monthly rally. View: Bearish (75% confidence). Trade: Short at $176.77, SL $181.00, TP $171.74, size 1. Areas of Agreement and Disagreement
Agreement
Price is above the 20/50-day moving averages. RSI (~60) indicates healthy, not overbought conditions. Key resistance near the 200-day SMA (~$181) and upper Bollinger Band (~$186.5). Funding rates are neutral; no extreme positioning. Luxury watch news is a mild positive but not a strong market mover.
Disagreement
Directional bias: Three models lean moderately bullish (Grok, Claude, Llama), two bearish (Gemini, DeepSeek). Trade triggers: Bullish models target breakouts above current price; bearish models emphasize MACD crossover and 200-day SMA rejection. Position sizing and risk thresholds vary widely (1% equity vs. 0.5% vs. full contract). Conclusion
Overall Market Direction Consensus: Moderately Bullish Recommended Trade: Long SOL futures
Entry Range: 177.50 (to confirm continued upside momentum) Stop Loss: 171.00 (just below 20-day SMA) Take Profit: 183.00 (near upper Bollinger Band resistance) Position Size: 1 contract (≈1% of equity at 50× leverage) Confidence Level: 73% Key Risks and Considerations: MACD bearish divergence could trigger a short-term pullback. Strong resistance at the 200-day SMA (~$181) and upper Bollinger band. Correlation with BTC/ETH and broader crypto market swings. Volatility spikes can induce slippage—strict risk management required. TRADE_DETAILS (JSON Format)
{ "instrument": "SOL", "direction": "long", "entry_price": 177.50, "stop_loss": 171.00, "take_profit": 183.00, "size": 1, "confidence": 0.73, "entry_timing": "market_open" }
📊 TRADE DETAILS 📊 🎯 Instrument: SOL 📈 Direction: LONG 💰 Entry Price: 177.5 🛑 Stop Loss: 171.0 🎯 Take Profit: 183.0 📊 Size: 1 💪 Confidence: 73% ⏰ Entry Timing: market_open
Disclaimer: This newsletter is not trading or investment advice but for general informational purposes only. This newsletter represents my personal opinions based on proprietary research which I am sharing publicly as my personal blog. Futures, stocks, and options trading of any kind involves a lot of risk. No guarantee of any profit whatsoever is made. In fact, you may lose everything you have. So be very careful. I guarantee no profit whatsoever, You assume the entire cost and risk of any trading or investing activities you choose to undertake. You are solely responsible for making your own investment decisions. Owners/authors of this newsletter, its representatives, its principals, its moderators, and its members, are NOT registered as securities broker-dealers or investment advisors either with the U.S. Securities and Exchange Commission, CFTC, or with any other securities/regulatory authority. Consult with a registered investment advisor, broker-dealer, and/or financial advisor. By reading and using this newsletter or any of my publications, you are agreeing to these terms. Any screenshots used here are courtesy of TradingView. I am just an end user with no affiliations with them. Information and quotes shared in this blog can be 100% wrong. Markets are risky and can go to 0 at any time. Furthermore, you will not share or copy any content in this blog as it is the authors' IP. By reading this blog, you accept these terms of conditions and acknowledge I am sharing this blog as my personal trading journal, nothing more.

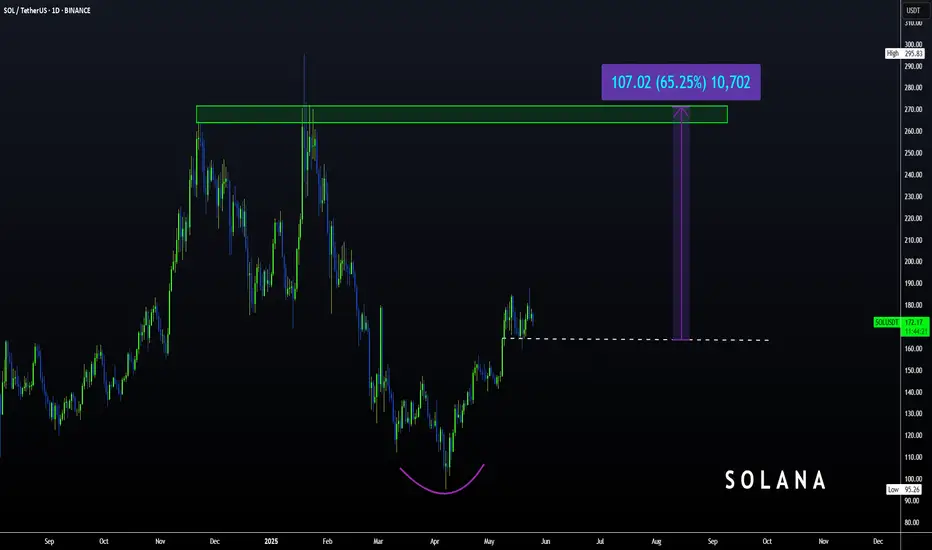
Solana | SOL spot TRADE SETUP +65%Firstly, let's look at the SOL chart from a larger view to confirm the agreement for a bullish setup.
What we see above is a clear bullish bottom, followed by a sharp V-Shaped recovery in the daily timeframe.
From here, the ideal entry could be within this zone, either dollar-cost average or just one spot buy:
With the STOP-LOSS around here:
And THREE TP (take profit) points:
1️⃣
2️⃣
3️⃣
Naturally with the timeframe of your HOLD increasing as your target moves higher.
_________________________
BINANCE:SOLUSDT
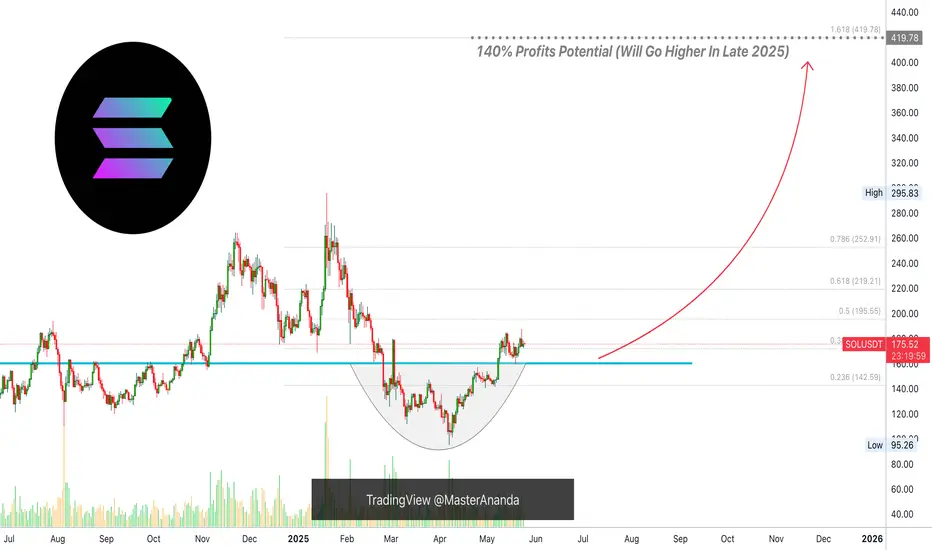
Solana, Consider The Bigger Picture —$420 Isn't The Final TargetThe day before yesterday, based on session close, 23-May, marks a strong rejection from resistance, a mild resistance I should say but, this doesn't change much or anything when it comes to the bigger picture and what we expect in the coming weeks and months.
Good evening my fellow Cryptocurrency trader, I know it is Saturday night but still, it is fun to work.
When in doubt, zoom out... What happens if there is no doubt?
Well, when there is no doubt, rest easy and buy more. Hold easy and profits will come.
Notice the blue line on the chart. This line marks the low from 19-May. While we had a rejection 23-May there is absolutely no bearish action on this chart. The following day, yesterday, was neutral and we will see what the market does today.
The action is happening pretty high compared to the 19-May low. This low is the main support zone and also the baseline of our rounded bottom. $160. You can say that Solana is truly bullish above this level. If it moves below, nothing happens because this isn't likely to happen but if it happens it simply means a market shakeout or bear-trap is taking place. Why? Because we are bullish now, the bullish bias has been confirmed and we will see growth long-term.
Are you aware that interest rates, by the FED (USA), will be lowered next month? This will be used as the catalyst for the Cryptocurrency market to produce astounding growth. When this event happens, you should be fully invested, "buy like is the end of the world" remember?
That's the situation in which we are now. Prices are still low.
Prices are not low as in trading at $100 or $110. But you will consider them super low when Solana starts trading at $300 or higher.
Here is the thing, when the rise happens it will be so sudden and so strong, that you will be wondering, "why didn't I buy when prices were low?" "Master Ananda told me so many times, so many charts..."
It is not too late. Cryptocurrency is set to grow. Long-term.
Thanks a lot for your continued support.
Namaste.
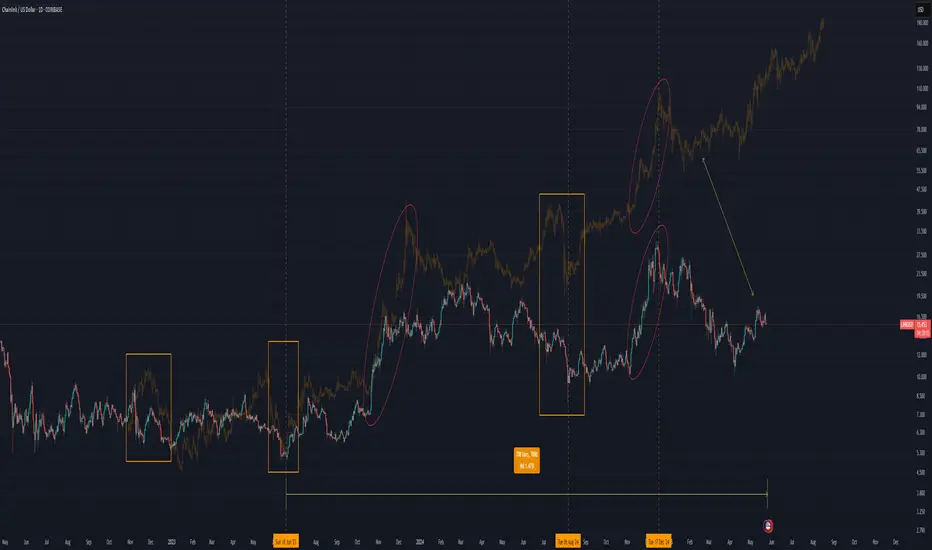
The Greatest Chainlink Bar Pattern in History: The Crystal Ball For over 700 days now, following this Chainlink bar pattern has been the most profitable bar pattern I have ever found since I began this journey — it’s literally been a map of the future.
But for the first time, there has been a massive deviation. Let me explain.
We must go back to August 2020.
According to the bar pattern, we’ve just completed the same move from August 2020 — but the big difference here is that this time, it’s taken over 100 days to complete, while in 2020 it took just 30 days.
So far this cycle, it's the biggest deviation yet. Which has me thinking: what if this cycle breaks the four-year cycle and we extend beyond the 1,064-day cycle that's supposed to complete in October 2025?
Without this recent deviation, Chainlink would have completed the cycle bar pattern in August 2025.
My Chainlink Time Fib has a hit on this time period — August 2025. Something could happen around this time. This Time Fib has had major calls before, although it has also failed in the past.
The new deviated timeline for the cycle top:
This is what it would look like if the deviated bar pattern was shifted. Could this be a major clue showing us the future again? Are we catching a glimpse of what’s to come?
According to this new timeline, Chainlink rallies slowly until October 2025 — which lines up with Bitcoin’s cycle completion date. Bitcoin has never passed 1,064 days in a bull market. The last two cycles took exactly that long. So it’s interesting that price appears to grind upward to that date and then roll over.
It continues to roll over and apparently has a major retest of the lows:
This shows a retest of $10 in December 2025 — forming what could be the biggest bear trap in history — before a massive rally in 2026 leading to a March 2027 top.
I’ll be watching Chainlink like a hawk this year. So far, it has led the way for me and made this cycle pretty easy to read. Is it possible that the major run happens in 2026?
Stay safe, marines. 🫡
SOL showing strength despite the orange swan event. SOL will either break out or consolidate into a tradable structure. The orange swan event sell-off leading into the weekend is not a good time to enter fresh trades. However, preparing appropriately for what is coming next is a valid strategy.
Full TA: Link in the BIO

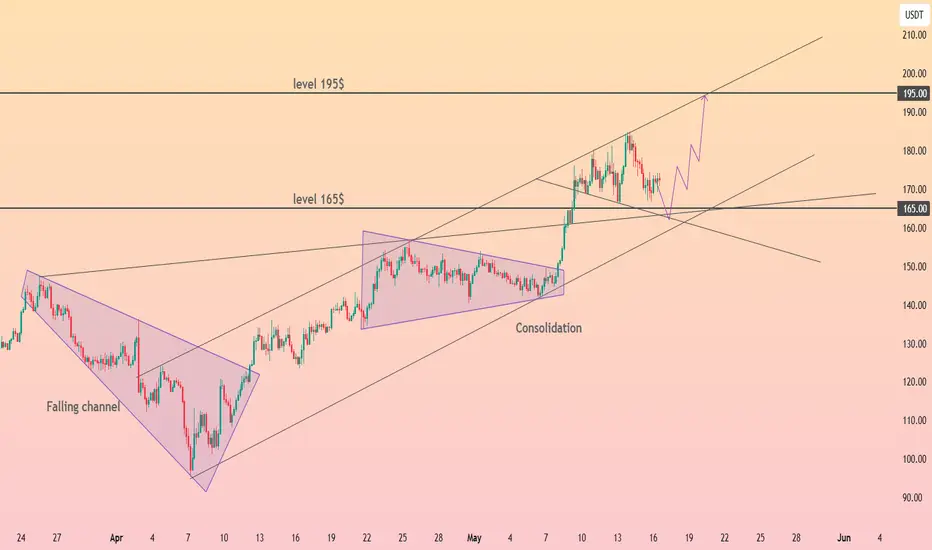
HolderStat┆SOLUSD held the support trend lineCRYPTOCAP:SOL sprinted from a falling channel into a sturdy growing channel, staging pauses at 145 and 170. Price now coils inside a descending mini-flag clamped to the 170 horizontal—flip that lid and the 195-200 magnet comes alive, mirroring the flag’s height. Only a decisive close below 160 would dull the current trajectory toward fresh 200-plus highs.
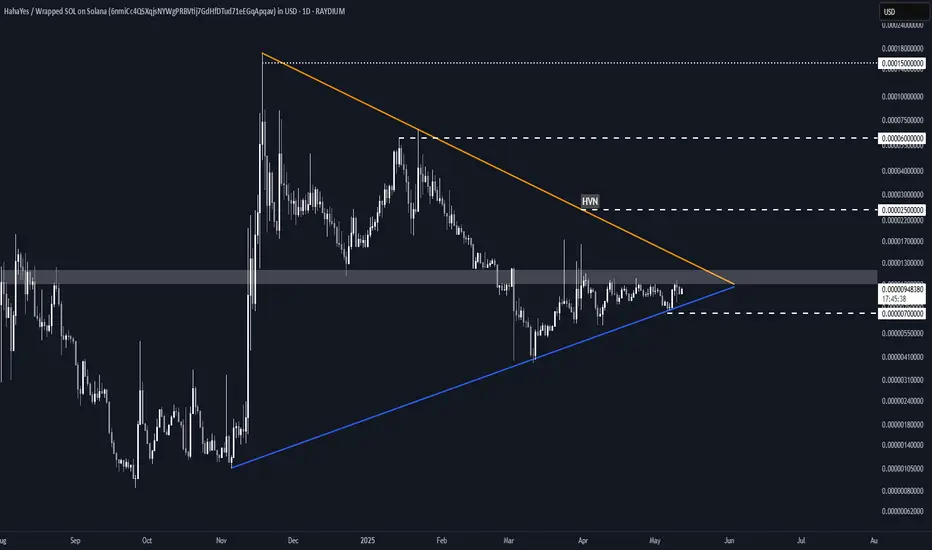
RIZO Symmetrical Triangle (1D - Log)RAYDIUM:RIZOSOL_6NMICC.USD formed a symmetrical triangle, and a minor ascending triangle within it.
Log scale is needed despite the short timeframe considering the volatility.
Clear support and invalidation, with multiple TP targets.
Key Levels to Watch
• $0.000007: Local low. A break below the blue support trendline would invalidate the setup, with this horizontal level offering a more reliable invalidation point.
• $0.000010-$0.000012: Current resistance and minor ascending triangle upper boundary. Also an S/R dating back to August 2024. A break above it could be a good long trigger, aligning with the broader symmetrical triangle breakout scenario.
• $0.000025: High volume node, roughly aligned with the minor ascending triangle target.
• $0.000060: Local high from January 2025.
• $0.000150: ATH area, most likely strong resistance.
Until a confirmed breakout above $0.000012, RIZO remains in a compression phase and a no-trade zone for me.
HolderStat┆SOLUSD retesting the supportCRYPTOCAP:SOL has ridden a well-behaved growth channel since early April. After rejection at 180 USDT, price tests the channel spine around 165, which also marks the April breakout node. Defend it and the upper rail near 195-200 beckons; lose 160 and eyes shift to the lower boundary close to 150.

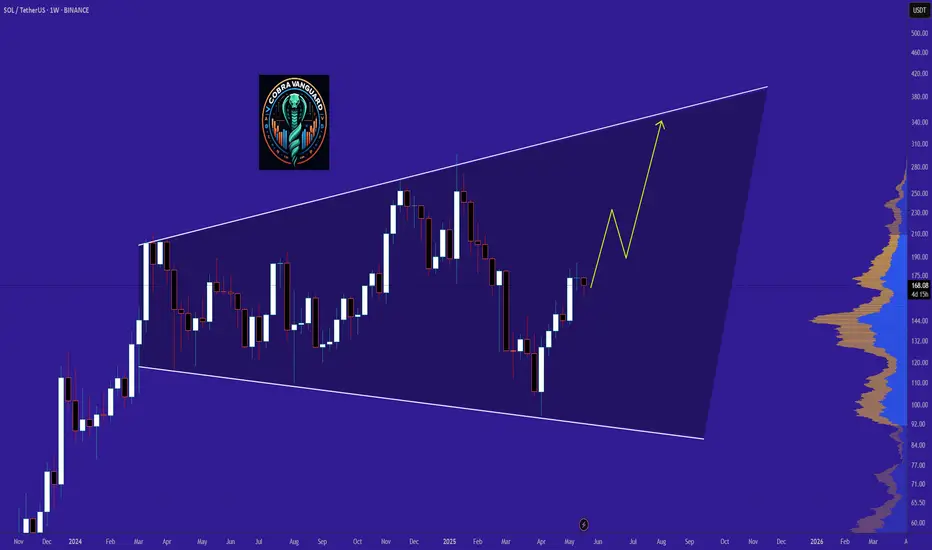
Give me some energy !!!The SOL will increase $150 and reach to the top of the wedge in the coming weeks .
Give me some energy !!
✨We spend hours finding potential opportunities and writing useful ideas, we would be happy if you support us.
Best regards CobraVanguard.💚
SOL Trade Blueprint: Waiting for the High-Conviction EntryAfter printing a SFP at the key high of $180.52 followed by a sharp -8% rejection, SOL made a second attempt to breach the major resistance zone between $180–$185 — but once again, bulls fell short. Since then, price has been in a corrective phase. So the big question is: where’s the next high-probability trade setup? Let’s zoom out and break it down.
📏 Zooming Out: Structure, FVG & Fib Confluence
Back on May 8th, SOL broke through the April 25th swing high at $157 with strong momentum, leaving behind an untested Fair Value Gap (FVG) — a key displacement area that’s yet to be filled. When we draw the Fibonacci retracement from the low of that move to the current high, the 0.618 retracement lands precisely at $157.34 — right on the old breakout high. That’s a beautiful confluence.
Timing-wise, if SOL pulls back to that level between May 21–22, the 0.75 Fib speed fan also kicks in — adding dynamic trendline support to the static Fib level.
📉 What About the $164 Golden Pocket?
There's a golden pocket forming around $164 from a recent mini-impulse, and while it may look tempting, context matters. This pocket isn't supported by enough confluence — no major structure, volume shelf, or EMA alignment. For a quick scalp? Yes. But for a high-conviction swing? It's not ideal.
Remember, in trading we're not here to chase every candle — we're here to wait for the setups that stack the most reasons to say yes.
📍 The Zone to Watch: $157
Now let’s talk about that $157 zone — and why it’s standing out as the highest-probability long setup:
0.618 Fib retracement of the major impulse
Retest of the breakout swing high
Untested Fair Value Gap (FVG)
233 EMA + 233 SMA on the 4H timeframe lining up as dynamic support
1.5 outer pitchfork support line crossing through
1:1 trend-based Fib extension confluence
Prior area of interest
This is what we call a “stacked setup.” The more layers of confluence, the more conviction we have in the trade. Add to that the potential for a liquidity sweep (SFP) just below the current low at $159.44 — and it becomes a zone worth watching closely.
🎯 Long Setup:
Entry: $157–$159.44 (watch for SFP confirmation)
Stop-Loss: Below $154
Target: $200
R:R: Approx. 1:12 — a setup worth being patient for
🧠 Educational Note: Why Confluence Is King
High-probability trades don’t come from guessing. They come from stacking confluence: structure, Fibonacci, moving averages, time-based levels, pitchforks, VWAPs, volume profiles — the more that lines up, the less you need to hope and the more you can trust your edge. Think like a sniper, not a machine gun.
The market rewards patience and precision — not noise and FOMO.
🔻 Short Setup (Alternative Play)
While we’re primarily bullish, there’s a valid short opportunity at the psychological $200 mark — but only if price shows clear rejection and confirmation (e.g. SFP, bearish engulfing, high volume reversal).
Entry: $200 rejection
Stop-Loss: Above $205
Target: $185–$180
R:R: Approx. 1:3+
🔥 Final Words: Trade With Purpose
This is what trading is about — not chasing green candles, but waiting for structure, clarity, and alignment. Whether you’re trading long or short, focus on high-conviction setups backed by logic and levels, not emotion.
Don’t trade for action. Trade for precision. The market will always reward the patient ones who are willing to wait for that clean entry, stacked with reasons to act.
Trust the process, stay disciplined, and let the charts do the talking. 💪📈
___________________________________
If you found this helpful, leave a like and comment below! Got requests for the next technical analysis? Let me know.

Binance Blinked! High level of USDC volume across Binance..Binance has for many years tried their own versions of buying US debt with USD made from selling a stablecoin of their own. This has been squashed nearly every time and has most likely hindered the flow on binance itself.
It seems binance may have blinked. USDC has been flooding into Binance this year maintaining often very high levels of relative volume. This flow is overall better than if neither party capitulated. Must be careful of different streams of volume fragmenting both bullish and bearish data. While USDT is seeing all time highs its market share is falling with the wider adoption of stablecoins on chain and in traditional finance.
All this is occuring as stablecoin regulation is being passed in the US tradingview.sweetlogin.com and Dimon says NYSE:JPM will be buying COINBASE:BTCUSD for clients soon

sol sell midterm"🌟 Welcome to Golden Candle! 🌟
We're a team of 📈 passionate traders 📉 who love sharing our 🔍 technical analysis insights 🔎 with the TradingView community. 🌎
Our goal is to provide 💡 valuable perspectives 💡 on market trends and patterns, but 🚫 please note that our analyses are not intended as buy or sell recommendations. 🚫
Instead, they reflect our own 💭 personal attitudes and thoughts. 💭
Follow along and 📚 learn 📚 from our analyses! 📊💡"

Solana – Speculative Long Trade Setup Ahead of Narrative CatalysDespite BTC and ETH rallying, SOL has lagged, making it a potential rotation play as capital moves across majors. With attention building around the Internet Capital Markets narrative, SOL may soon attract speculative inflows, especially given its historical performance during sector-wide momentum shifts.
🔹 Entry Zone:
$152 – $154
🎯 Take Profit Targets:
🥇 $172 (local resistance / prior rejection zone)
🥈 $181 (next HTF resistance and possible momentum breakout zone)
🛑 Stop Loss:
$144 (invalidates current short-term bullish structure)

HolderStat┆SOLUSD 165 retest could launch 195-200CRYPTOCAP:SOL escaped a falling channel in April and has since respected a well-behaved growing channel. After tagging 180 USDT resistance, price is backing into the channel heart around 170 with potential for a classic 165 support retest. A bounce there would position bulls to challenge the 180 lid again and potentially sprint toward the channel extension at 195-200 USDT. Breakdown below 160 would mark the first technical warning of fatigue.
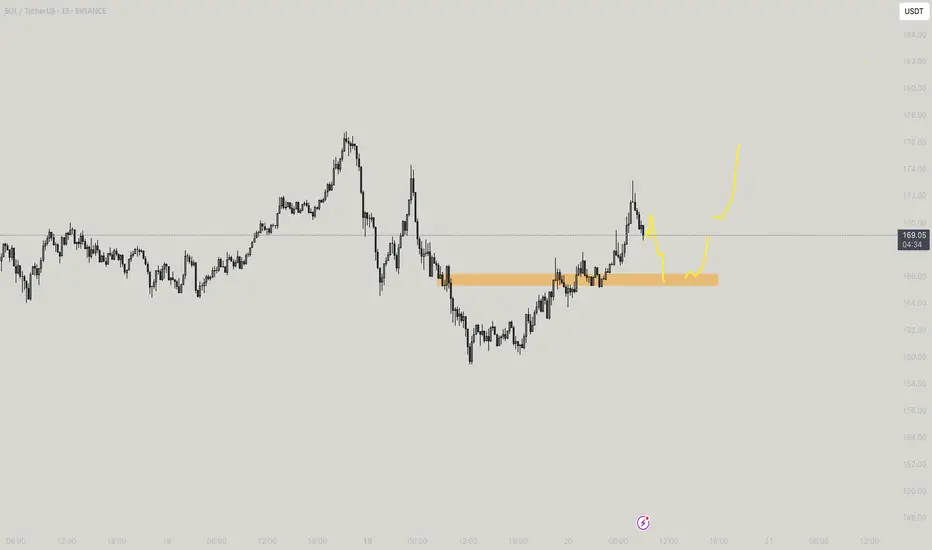
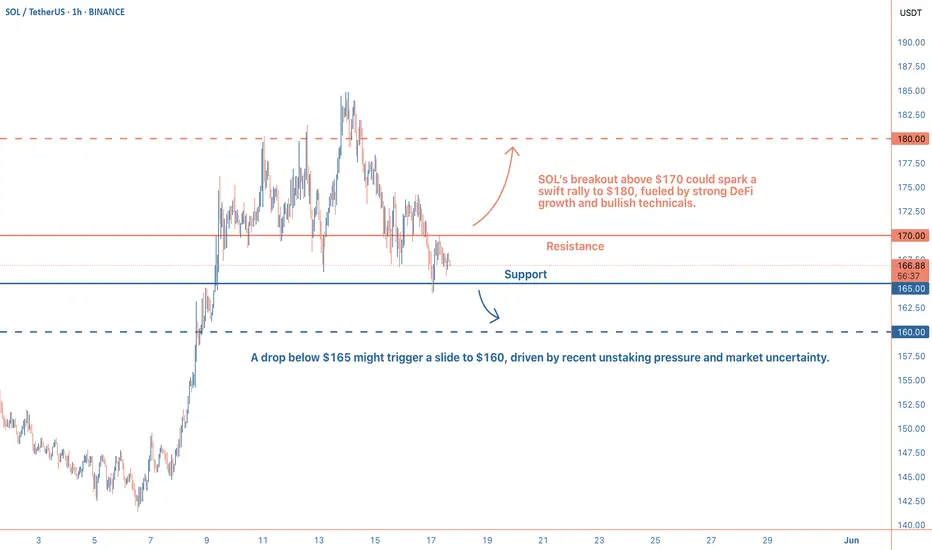
Poised for a Breakout at $168?Solana is currently trading around $168, showing a period of consolidation after some recent volatility. The price has been hovering in a tight range over the past few hours, which often signals that a bigger move could be on the horizon. With the broader crypto market showing mixed signals, SOL’s ability to hold this level suggests it’s gathering strength, but traders should stay alert for a breakout.
Recent News:
Solana’s ecosystem has been buzzing lately, with its decentralized finance (DeFi) sector showing solid growth, total value locked (TVL) recently jumped from $7.5 billion to $9.6 billion as of May 2025. This uptick reflects growing confidence in the network’s high-speed, low-cost transactions. On the flip side, over 1.4 million SOL tokens were unstaked in the past week, adding some selling pressure.
Meanwhile, Bitcoin’s stability above $100,000 provides a supportive backdrop for altcoins like SOL, though any sudden market shifts could sway the momentum.
Technical Analysis:
Solana is sitting just above the 50-hour moving average at $165, which is acting as a short-term support. The 200-hour moving average at $160 offers a stronger safety net below. As long as the price stays above $165, the short-term trend leans bullish.
A bullish flag pattern seems to be forming, hinting at a potential upward breakout. If SOL pushes past the $170 resistance, it could aim for $180 next.
The RSI is at 55, showing neutral momentum with room to climb before hitting overbought territory. The MACD is teasing a bullish crossover, which could confirm stronger upward pressure if it completes.
Watch $165 as key support, with $170 as the immediate resistance. A break above $170 opens the door to $180, while a drop below $165 might test $160.
SOL is at a pivotal moment on this 1-hour chart. Positive network developments and a stable broader market give it a bullish edge, but the recent unstaking adds a layer of caution. If the price clears $170, a run to $180 looks likely, especially with technical indicators tilting upward. However, a failure to break resistance could see it retest $165 or lower. Traders should keep an eye on volume and the $170 level—any surge there could signal the next big move!
$SOL and Most Major Alts Get Hard Rejection from 200DMAMost of your favorite Alts such as CRYPTOCAP:SOL had hard rejections from the 200DMA.
If this trend breaks into the red box we should see a retest around the .236 Fib and 50DMA ~$140
RSI also looks McDonald's toppy
Not a good time to FOMO.
PS. Normally i dont post TA this late in the night from the US but I'm gonna consider doing more if i get some decent engagement.
Lmk if you think i should post more at these midnight hours 🎃

TradeCityPro | SOL: Key Retest at Support Before Next Breakout👋 Welcome to TradeCity Pro!
In this analysis, I’m going to review the SOL coin—one of the most requested assets and a very popular project in the crypto space.
✔️ This coin holds a market cap of $3.61 billion and is ranked 6th on CoinMarketCap.
⏳ 4-Hour Timeframe
As you can see, a bullish leg started from the 142.25 support and extended up to the 177.51 resistance.
🔍 Currently, after a fake breakout of 177.51 and a rejection from 183.86, the price has dropped back below 177.51 and formed a support level around 166.82.
📈 So far, the price has tested the 166.82 level twice and shown a strong bullish reaction. Recently, a powerful support candle has formed at this level, suggesting it’s being defended.
💥 If the price can move back toward the upper levels, a breakout of either 177.51 or 183.86 would provide a long entry trigger. If a higher low and higher high form before the breakout of 177.51, the trigger becomes even more reliable.
📊 Market volume has declined since the upward move ended. If volume increases as price rises again, it would provide a volume confirmation.
🔽 For a short position, the 166.82 level serves as a valid trigger. In my view, it’s a strong enough level to justify opening a short. The next major support below lies at 142.25.
❌ Disclaimer ❌
Trading futures is highly risky and dangerous. If you're not an expert, these triggers may not be suitable for you. You should first learn risk and capital management. You can also use the educational content from this channel.
Finally, these triggers reflect my personal opinions on price action, and the market may move completely against this analysis. So, do your own research before opening any position.

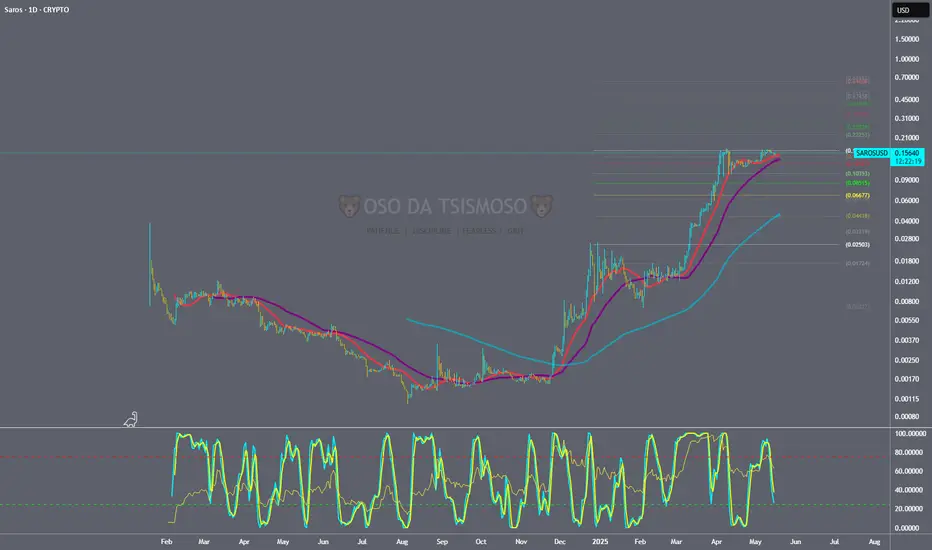
ALTCOIN BOOM FOR SAROS 2025-2026 PROPOSALIntro & Core Info SAROS ($SAROS) is a decentralized finance (DeFi) ecosystem built on Solana, focusing on liquidity solutions, decentralized exchange (DEX) aggregation, and cross-chain swaps. It aims to solve fragmented liquidity across Solana-based protocols while offering low fees and near-instant transactions. Think of it as the "Uniswap of Solana," but with ambitions to bridge ecosystems like Ethereum and Cosmos.
Recent News Launched "Saros Super Pool," a concentrated liquidity protocol with $50M TVL in its first week. Partnered with Jupiter Exchange to integrate Solana’s largest DEX aggregator into Saros’ interface. SAROS price jumped 60% in July, fueled by Solana’s resurgence.
Deep Dive Solana’s DeFi TVL has tripled in 2024, and SAROS is riding the wave. The Super Pool launch taps into Solana’s speed to attract yield farmers, while the Jupiter collab positions SAROS as a one-stop trading hub. However, Solana’s history of network outages remains a risk. If SAROS can’t ensure uptime during congestion, users might flock to rivals like Raydium.
Latest Tech or Utility Update
Update Details Saros deployed "Cross-Chain Swaps" this month, enabling asset transfers between Solana, Ethereum, and Binance Smart Chain via Wormhole bridges. Also introduced "Dynamic Fees," which adjust based on network congestion.
Implications Cross-chain swaps could make SAROS a hub for multi-chain traders, but reliance on bridges like Wormhole introduces security risks. Dynamic Fees help retain users during Solana’s traffic spikes, but if fees rise too high, it might negate Solana’s low-cost advantage.
Biggest Partner & How Much Was Invested
Partnership Spotlight Jupiter Exchange invested $5M in SAROS’ liquidity incentives program, locked for 12 months.
Impact Analysis Jupiter’s liquidity dominance on Solana gives SAROS instant access to deep order books. This partnership could funnel Jupiter’s user base into SAROS’ Super Pools, creating a flywheel effect. If successful, SAROS becomes the go-to for Solana yield farming.
Most Recent Added Partner & Details
New Collaboration Saros partnered with marginfi (Solana lending protocol) to enable leveraged yield farming. No direct investment, but revenue-sharing on margin trading fees for 18 months.
Future Prospects Leveraged farming could attract degens and boost TVL, but overcollateralization risks could backfire during market crashes. Short-term, this adds hype; long-term, it tests SAROS’ risk management.
Tokenomics Update
Token Dynamics Burned 1.5M $SAROS (3% of supply) in July via protocol revenue. Staking rewards now include 20% of swap fees (up from 10%). DAO voted to extend token vesting for team tokens by 2 years.
Deep Analysis Burns + fee-sharing make $SAROS more deflationary, but the token’s value hinges on volume. Extended vesting reduces sell pressure, signaling team commitment. However, if trading activity stalls, stakers could dump rewards.
Overall Sentiment Analysis
Market Behavior Retail traders are FOMO-ing into $SAROS (social mentions up 300%), while whales are taking partial profits. Funding rates turned negative on derivatives, suggesting short-term caution.
Driving Forces Hype around Solana’s comeback and leveraged farming. Concerns linger about Saros’ ability to scale without Solana-level outages.
Deeper Insights Sentiment is overly tied to Solana’s performance. If SOL dips, SAROS could crash harder. But if Solana’s DeFi summer continues, SAROS might outperform.
Recent Popular Holders & Their Influence
Key Investors Alameda Research survivor wallet bought 500K $SAROS. Solana co-founder Raj Gokal praised Saros’ UX in a tweet.
Why Follow Them? Alameda’s remnants are known for trading Solana ecosystem gems aggressively. Raj’s endorsement signals insider confidence, which could attract more builders to Saros.
Summary & Final Verdict
Recap SAROS is Solana’s liquidity aggregator on steroids, combining cross-chain swaps, leveraged farming, and deep Jupiter integration. Its tokenomics are tightening, and Solana’s revival gives it tailwinds.
Final Judgment $SAROS is a high-beta Solana play . If you’re bullish on SOL’s comeback, this could 3x-5x. But if Solana stumbles, SAROS will bleed harder than blue chips.
Considerations Can Saros’ infrastructure handle Solana’s next congestion crisis? Will leveraged farming lead to cascading liquidations in a crash? How dependent is SAROS on Jupiter’s continued dominance?
If you’re riding the Solana wave, buy the dip. If skeptical about Solana’s reliability, stay clear.