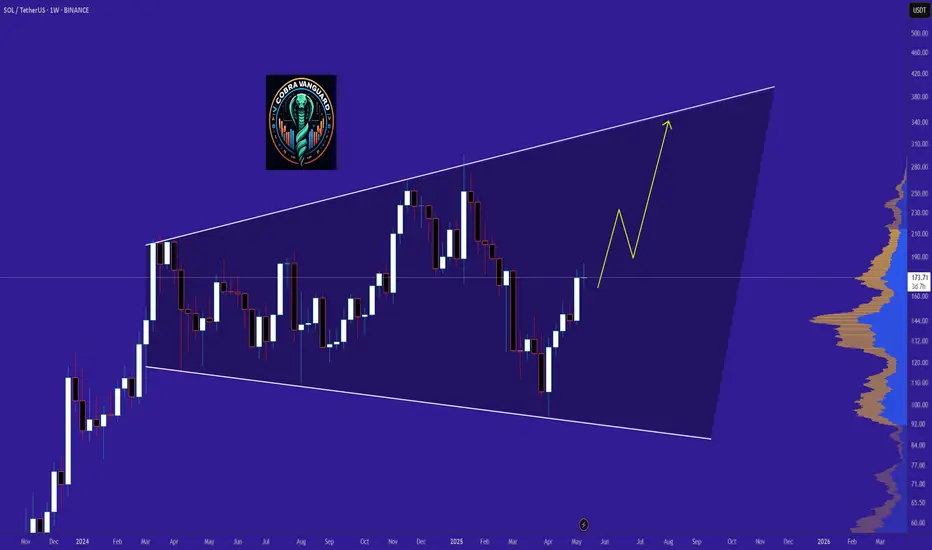
Nothing !!!The SOL will increase $150 and reach to the top of the wedge in the coming weeks .
Give me some energy !!
✨We spend hours finding potential opportunities and writing useful ideas, we would be happy if you support us.
Best regards CobraVanguard.💚
SOL
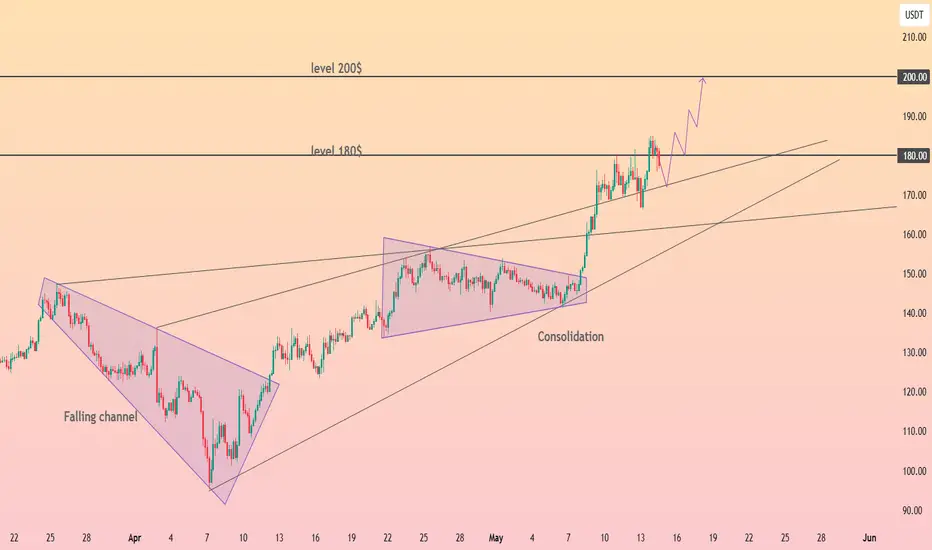
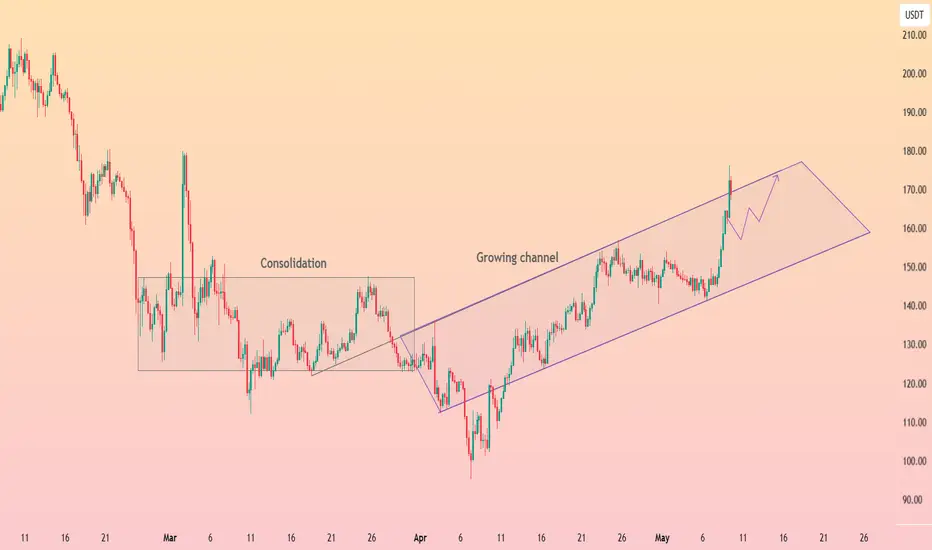
HolderStat┆SOLUSD 180 $ flip, 200 $ nextSolana price escaped April’s consolidation box, flipped the old down‑sloping resistance into a rising support line, and is now pressing the 180 $ ceiling inside a well‑defined growing channel. A decisive daily close above 180 transforms that barrier into a launch pad, opening the measured channel extension toward 200‑205 $. Channel lows near 150 remain key invalidation for the bullish momentum.
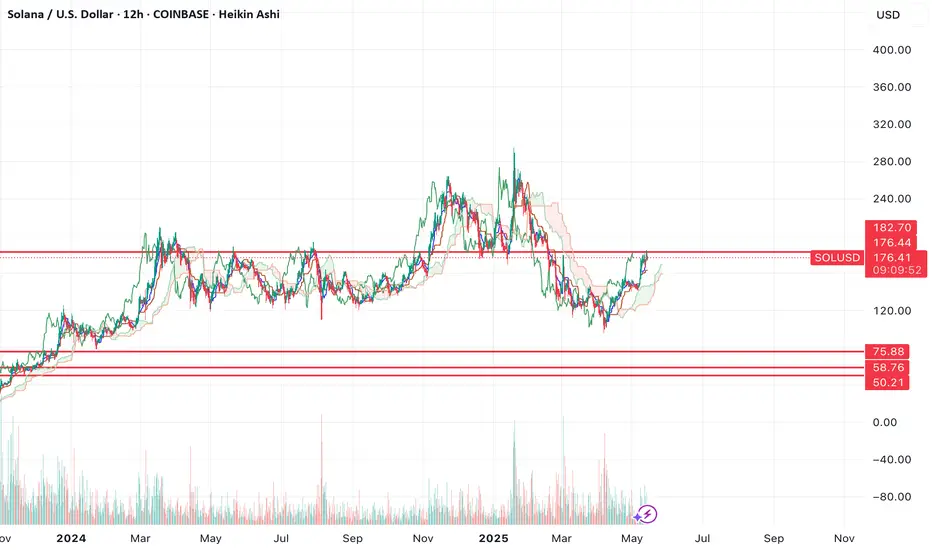
$SOL rejecting resistance $50-75 targetSol looks to be rejecting resistance here, which sets it up for a large move lower.
I think it's likely that unless price can flip the resistance above as support, that we revisit the support levels.
Pretty simple chart. All of crypto looks the same, look out below.
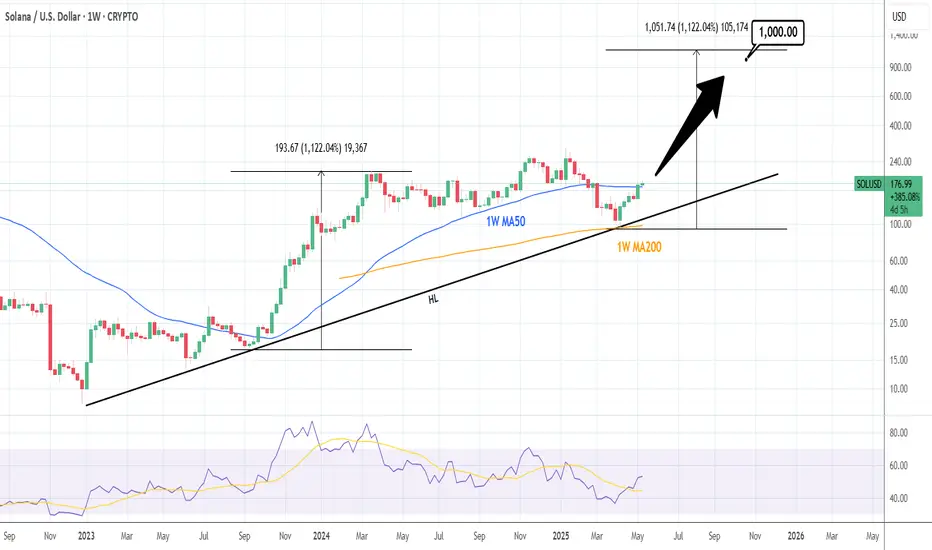
SOLUSD: Can it hit $1000?Solana is heavily bullish on its 1D technical outlook (RSI = 67.130, MACD = 11.423, ADX = 35.600) and just last week only crossed over its 1W MA50 again. This rebound started exactly on the 1W MA200, after holding the HL trendline of the Bull Cycle. Last time SOL crossed above its 1W MA50 after a HL, was on September 25th 2023 and a +1,122% rally unfolded. If macro and fundamentals assist, SOL can repeat this and reach the 1k mark (TP = 1,000).
## If you like our free content follow our profile to get more daily ideas. ##
## Comments and likes are greatly appreciated. ##
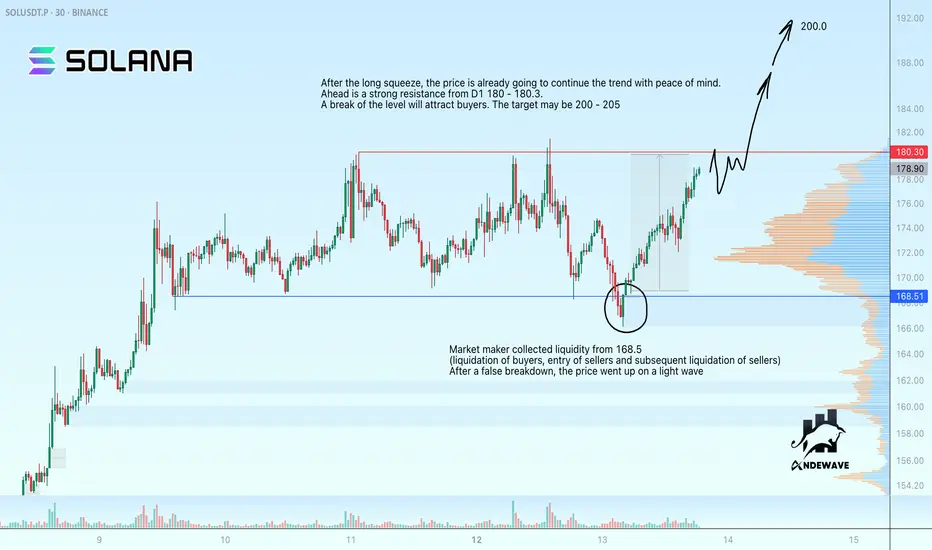
SOLUSDT may rise to 200.0 after long-squeezeMarket maker collected liquidity from 168.5 (liquidation of buyers, entry of sellers and subsequent liquidation of sellers)
After a false breakdown the price went up on a light wave
After the long squeeze, the price is already going to continue the trend with peace of mind.
Ahead is a strong resistance from D1 180 - 180.3.
A break of the level will attract buyers. The target may be 200 - 205
Scenario: a retest of the resistance may end in a small correction. If there is no reversal and the price continues to test 180-180.3, we can expect a breakout, which may attract buyers and further growth to 200 - 205.

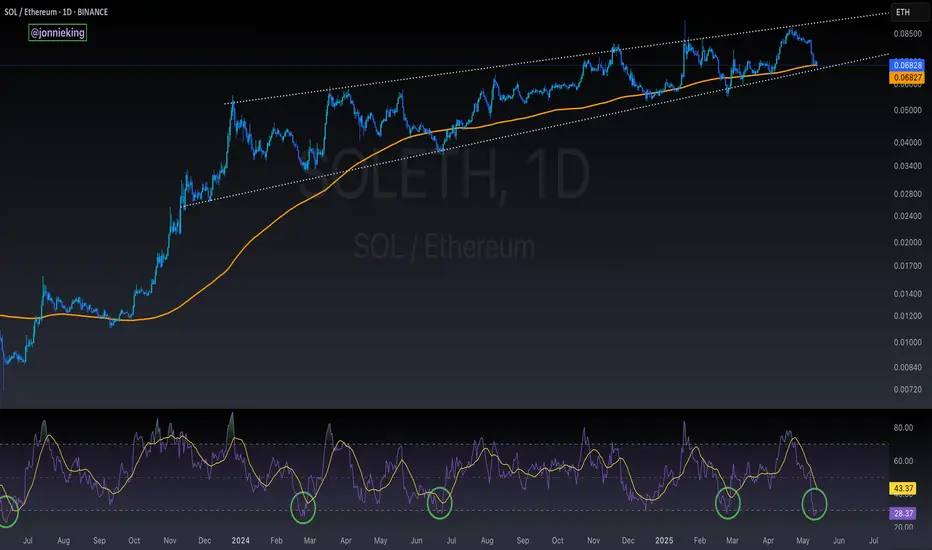
$SOL About to Outperform $ETHToday looks like a good day to flip your CRYPTOCAP:ETH for CRYPTOCAP:SOL 😎
Flirting with the 200DMA,
RSI has bottomed,
feels good man 🐸
HolderStat┆SOLUSD fixed above the trend lineSOL spent March in a messy consolidation box before rotating into a disciplined rising channel that has marched price from 110 to the doorstep of 180. Bulls are now wrestling with that major horizontal barrier; acceptance above it would turn the former ceiling into fresh support and open the calculated channel extension toward 205. Until channel lows around 150 give way, trend traders may lean on pullbacks inside the lane to stay positioned with momentum. 🔥

Solana 1-Day Chart – Are We on the Brink of a $1,000 MOONSHOT?!Solana is absolutely on fire! On this 1-day chart, we’re witnessing a massive rising channel that’s been building since 2023. After a solid rebound from the $93 support, Solana has smashed through a fractal resistance line (check that arched arrow from mid-2023 to early 2024 top) . Now, it’s breaking out at a parallel resistance, hanging around $174 — and this could be the setup for a MASSIVE move upward!
I’m calling a potential target of $1,000 if SOLUSDT can muscle through the big resistances ahead: $200, the ATH at $270, and everything beyond. This breakout screams opportunity — Solana might just catch another wave of demand and go parabolic! The $93 support (marked "Back to Nothing Below This Line") looks rock-solid, giving us a strong foundation for this rally.
Key Levels to Watch:
Support: $93 (channel base)
Current Price: $174 (breakout zone)
Resistances: $200, $270 (ATH)
Target: $1,000 (if momentum holds)
Are you ready for this? I’m buzzing — I can’t believe this might actually happen!
Let’s hear your thoughts, traders! Are we heading to $1,000, or will resistance hold us back?

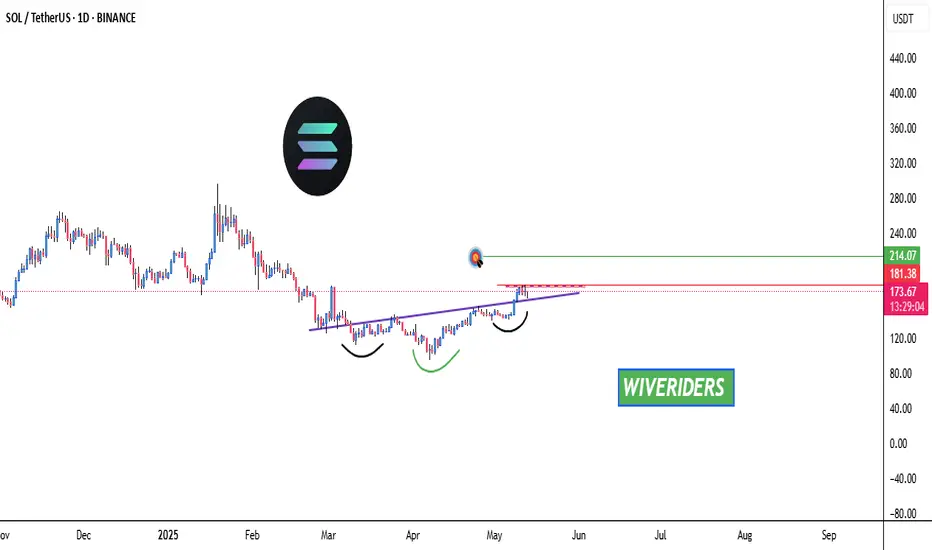
SOL Inverted Head and Shoulders – Breakout Potential!🚀 SOL Inverted Head and Shoulders – Breakout Potential! 📈
SOL has formed an inverted head and shoulders pattern and is now testing the red resistance zone. If the price breaks through this resistance, the first target could be the green line level! 📊
Let’s watch this breakout unfold! 💼💸
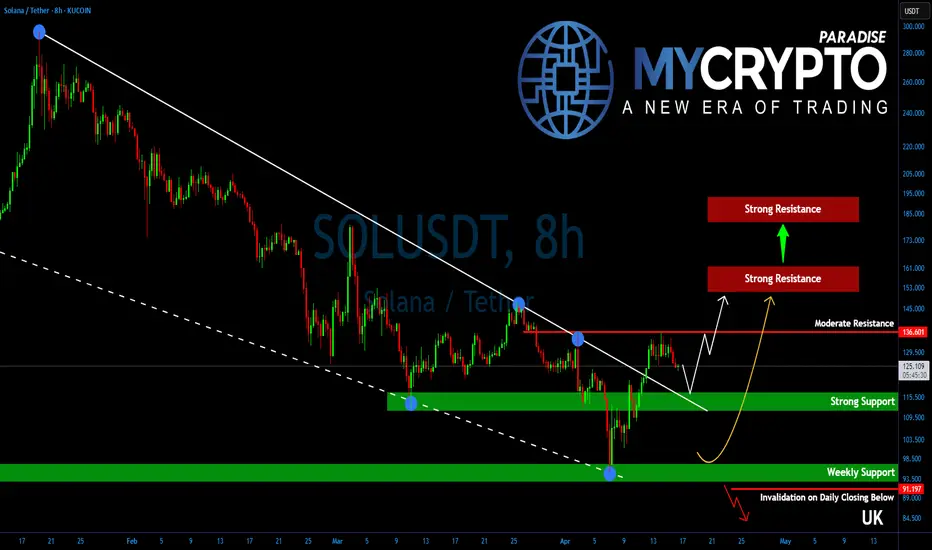
Solana Is One Breakout Away From a Bullish Explosion!Yello, Paradisers! Did you notice how #SOLUSD has been quietly positioning itself while the rest of the market remains uncertain? If you're not paying attention right now, you could be missing one of the cleanest setups on the charts.
💎After several weeks of downside grind and tight consolidation, Solana has just broken out of a falling wedge—a powerful bullish pattern that typically signals trend reversals or the start of a strong upside leg. This breakout wasn’t random either. It occurred after SOL successfully defended a key higher time frame support zone, signaling strength behind the move.
💎For #SOLUSDT, all eyes are on the $136.50 resistance level. This is a critical structural pivot. A clean break and close above this level would confirm a shift in higher time frame momentum from neutral to bullish. Until that happens, bulls still need to proceed with caution—but the setup is clearly developing in their favor.
💎Adding conviction to the idea of a bullish breakout are several supporting factors. Oscillators are showing bullish divergences, a classic sign that seller momentum is fading. At the same time, a golden cross formation on the 12-hour chart is getting closer which typically precedes sustained trend reversals and stronger moves to the upside.
💎If bulls succeed in reclaiming $136.50, the next price targets are $155–$160 as the initial strong resistance zone where some profit-taking could occur. If bulls hold strength, SOL is likely to head further higher and aim for $180–$190, which lines up with the target of the wedge pattern. This is a strong resistance zone and a level which could mark end of the corrective phase for Solana.
💎On the downside, immediate support lies between $110–$115. This is a well-defined range of demand and should offer strong buying interest if any short-term pullbacks occur.
Paradisers, strive for consistency, not quick profits. Treat the market as a businessman, not as a gambler.
MyCryptoParadise
iFeel the success🌴
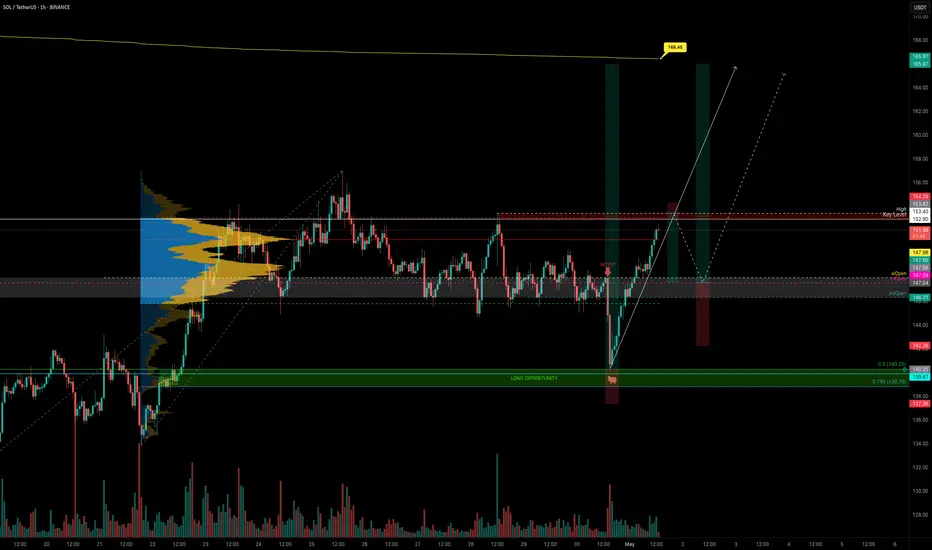
SOL Hits Major Resistance — Patience Over FOMOOne of the most common mistakes traders make—especially in fast-moving markets—is jumping into trades impulsively at major resistance. It feels exciting when price is surging, but ironically, this is often where risk is highest and reward is most limited.
Why? Because historical resistance zones—like the $175–$183 region on SOL—tend to attract heavy sell pressure. These are levels where many past buyers look to exit, where smart money hunts liquidity, and where false breakouts are most common. Without volume confirmation and a proper retest, breakouts through such zones often fail.
That’s why experienced traders wait. The smarter approach is to let the market come to you, and only act when one of two things happens:
A pullback into a well-defined, confluence-rich support zone
A clean breakout above resistance, followed by a retest and confirmation
SOL has respected structure beautifully, but now is not the time to chase. Either wait for a healthy correction into support, or let price prove its strength through a confirmed breakout. No trade is also a trade — and capital preservation is the foundation of long-term success.
Patience isn’t passive — it’s a strategy. Let the market come to your desired levels. You don't need to catch every move, only the high-probability trades and there aren’t born from impulse — they’re built on patience, structure, and right timing. 💎
Technical Breakdown
SOL has entered a major resistance zone between $175 and $183 — a historically significant level respected for over a year.
Within this zone lie two key highs:
$179.85: Recently swept with a clean Swing Failure Pattern (SFP)
$180.52: Still untested — if broken, it would confirm a strong bullish continuation
Breaking through such a well-established resistance on the first attempt is uncommon — it typically requires momentum and structure. A rejection here would suggest that SOL needs a healthy correction before mustering the strength for a true breakout.
📉 Elliott Wave Count
Looking at the structure, we’ve completed a 5-wave sequence — signaling the potential end of this impulse leg. According to Elliott Wave Theory, a corrective phase is now expected before continuation.
📐 Additional Confluence: Fib Speed Fan
The 0.618 Fib Speed Fan — drawn from the all-time high at $295.83 to the swing low at $95.26 — aligns perfectly with this resistance zone, adding more weight to the idea of a potential rejection or pause.
🟢 Long Setup: The Next High-Probability Entry Zone
We now shift our focus to where the next long opportunity could arise. Here’s the technical confluence:
Anchored VWAP from the recent low at $141.41 sits at $164.70
4H bullish order block around $164.46
0.382 Fib retracement of the full 5-wave impulse: $165.42
0.412 Fib retracement: $164.25
All these levels converge in a tight band, providing a solid long entry zone between:
Long Entry Zone: $165.50 to $164.25
Stop-Loss: Below $160 (to protect against any deep wick)
Targets:
TP1: $171.75 (Point of Control from the range)
TP2: $180.00 (resistance retest)
TP3: $200.00 (psychological level)
Estimated R:R: ~6:1 — High-conviction setup
Bonus: If price returns to this $165 zone within 24 hours, it will also be supported by the 0.618 Speed Fan — adding one more layer of support.
🔴 Short Setup: Reversal Play at $200
For those watching from the sidelines or looking to fade the rally, the psychological level at $200 presents a strong short opportunity — but only on confirmation (e.g., SFP or bearish engulfing).
Short Entry: On rejection at $200
Stop-Loss: $206.10
Target: $187.00
Estimated R:R: ~2:1
🧠 Summary:
Completed 5-wave structure → potential correction phase underway
Strong resistance at $175–$183 with SFP and speed fan alignment
High-probability long setup at $165.5–$164.25 with multi-layered confluence
Potential short at $200 on confirmation
⚠️ Key Takeaway: Don’t Chase the Highs
This is where many traders slip — FOMOing into trades at major resistance. Please, don’t do it. Instead, wait for:
A pullback into well-defined support (like the $165 zone), or
A clean breakout above $180, followed by a confirmed retest
____________________________________
If you found this helpful, leave a like and comment below! Got requests for the next technical analysis? Let me know.

SOLANA - Tale of Two ExtremesOver the past ten months, Solana’s price action has swung from manic highs down to panic lows—and now into a disciplined base:
Euphoric Rally (Oct ’24 – Dec ’24)
SOL surged from ~$100 to a December peak near $290 on booming DeFi activity, NFT hype, and new network tooling.
The green‐shaded bars in late November/early December mark a near-vertical ramp, with “B” buy signals clustering as momentum supercharged itself.
Brutal Unwind (Jan ’25 – Mar ’25)
Once Bitcoin stalled and macro headwinds arrived, SOL gave back almost two-thirds of its value, plunging from $270 to a $96 trough by mid-March.
Red “S” sell markers at lower highs confirmed aggressive profit-taking and capitulation.
Disciplined Base Building (Mar ’25 – May ’25)
A clear single bottom at the P0 pivot around $96 (also last year’s low) drew in fresh bids each time price tested that floor.
Since early April, SOL has chopped sideways between $100–$140, tightening volatility and coiling like a spring.
2. Technical Anatomy of the Bounce
As of today, SOL sits at $175.43, flirting with short-term resistance and carving out a fresh up-move:
Level Price Role
Current (Monday’s High) $175.43 First line for breakout conviction
Year-Open Pivot (Y0) $189.50 Next hurdle—flip to support if cleared
Year-High (YH) $295.00 Measured target of the Dec rally
Dynamic Fib R1 $160.56 Prior falling-wedge resistance, now support
Dynamic Fib R3 $137.76 Secondary support on pullbacks
Volume & Momentum: Recent green candles have arrived on increasing volume, and fractal buy signals (“B” dots) cluster on each higher low—classic signs of renewed demand.
Pattern Resolution: What looked like a falling wedge from January has broken up through its upper trendline, validating the bullish bias.
3. Catalysts & Sentiment Drivers
Macro Tailwinds: Any dovish shift in Fed policy or a sustained Bitcoin rally above $70K will likely turbocharge altcoins like SOL.
On-Chain Upgrades: Watch for network announcements (e.g., new staking features, throughput improvements) that can reignite developer interest.
Event Flow:
FTX Claim Distributions: Final phases due in late May could return tokens into the ecosystem and fuel liquidity.
DeFi Incentive Programs: Fresh liquidity mining launches often spark sharp altcoin reprieves.
4. Strategic Playbook
Aggressive Entry:
Trigger: A daily close above $175.43 (Monday’s high) locks in the breakout.
Targets:
$189.50 (Y0 pivot)
$230–$250 (interim swing highs)
$295 (YH, the December peak)
Risk-Managed Longs:
Pullback Setup: A retrace to $160.56 (Dynamic Fib R1) offers a lower-risk entry with tight stops below $155.
Stop Loss: Under $137.76 (Dynamic Fib R3) keeps you clear of a retest of the March low.
Option Flavor:
Call Spreads: Consider a $180/$200 call spread into June expiries—defined risk with asymmetric upside if SOL breaks higher.
Caution:
A failure to hold $160 on a daily close exposes SOL back to the coiled range ($140–$100), so trim or hedge if that level cracks.
5. Conclusion: Coiled for Altseason
Solana’s collapse from $290 to $96 cleaned out weak hands. The subsequent wedge-style base and recent breakout attempt speak to a market that’s ready for its next leg up—provided it can conquer $175.43 and flip $189.50. Keep an eye on on-chain news and macro flows: if they align, SOL could sprint toward $230 and beyond, rejoining the next chapter of crypto’s broader altseason.

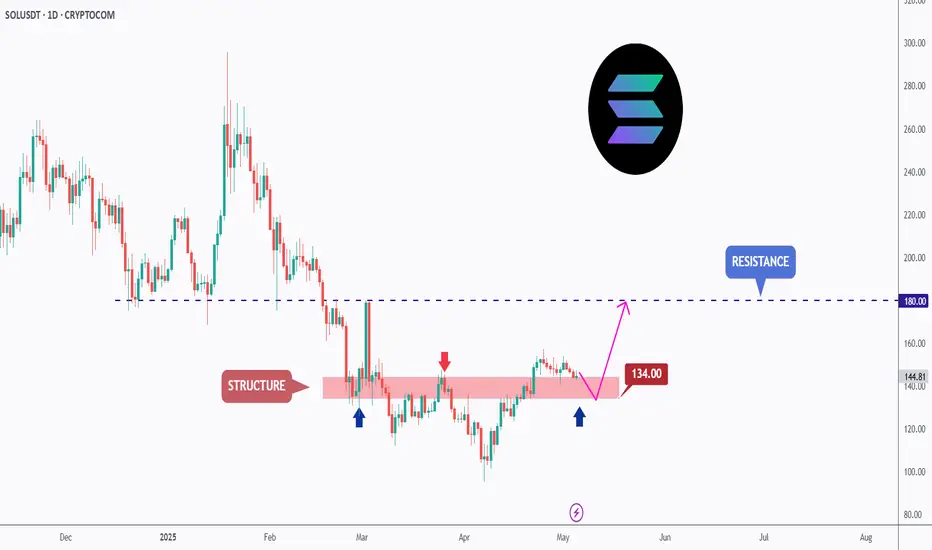
SOL - Strong Structure Rejected!Hello TradingView Family / Fellow Traders! This is Richard, also known as theSignalyst.
The picture says it all!
📈As long as the $134 structure marked in red holds, I will be expecting a bullish continuation towards the $180 resistance level.
📚 Reminder:
Always stick to your trading plan — entry, risk management, and trade management are key.
Good luck, and happy trading!
All Strategies Are Good, If Managed Properly!
~Rich
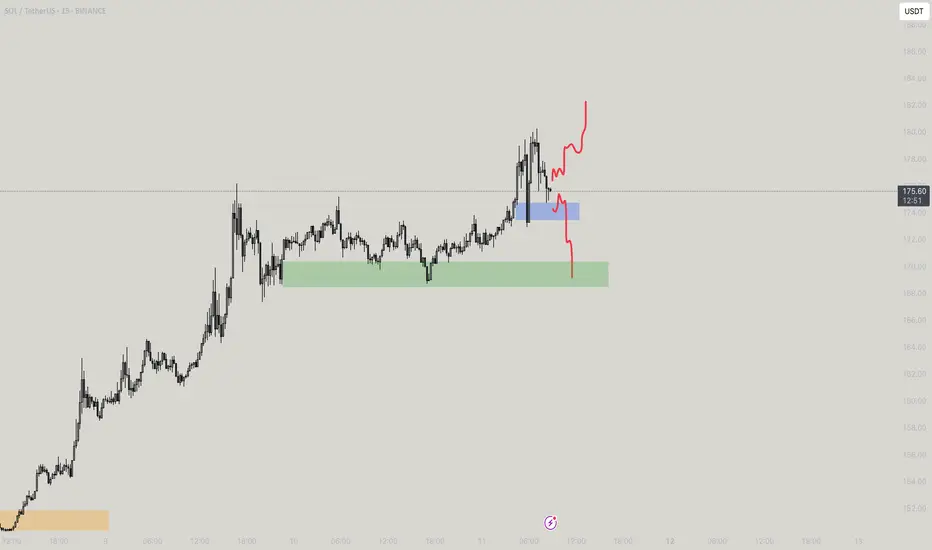
SOUL for a SOL - Part 1Hey Guys! This is M-Prof of SOL
The 4H SVP chart of SOL/USDT shows a clean bullish continuation with strong volume acceptance at higher levels. After consolidating around the $166–$170 range where the POC and VAL stacked tightly, Solana broke out impulsively, forming a fresh profile with value clearly migrating higher. The new POC and VAH are now centered near $174–$176, confirming that buyers are comfortably accepting higher prices. The thin tail below $171 shows rejection of lower prices, suggesting a strong demand zone now sits between $171 and $173. As long as SOL holds above this value area, any dip into that range offers a good risk-reward long opportunity. If the price accepts above $176.5, it could trigger further upside targeting $180+. Bias remains bullish above $171.
Coming to my doodle - Breaking the blue box would drag to the green one, changing structure though the latter towards the top is most probable!
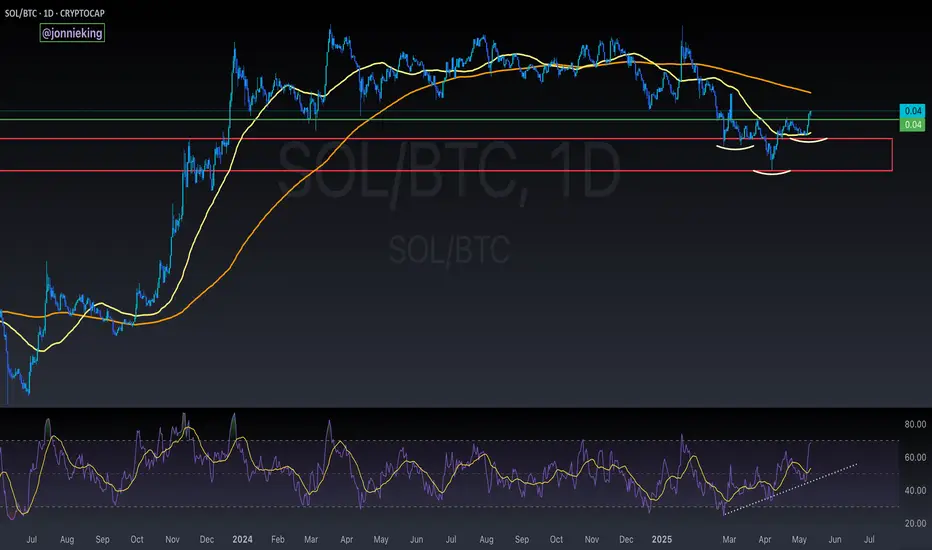
$SOL / $BTC Inverse Head and Shoulders BREAKOUT!!CRYPTOCAP:SOL / CRYPTOCAP:BTC Inverse Head and Shoulders reversal pattern confirmed 🥳
PA has also reclaimed the 50DMA
Bullish Divergence on RSI
So many signs indicators aligning across the market.
IS IT REALLY TIME !!?!?
HolderStat┆SOLUSD bullish channel points higherAfter a consolidation base, SOL launched into a growing ascending channel. As long as price respects the lower trendline, bullish momentum is expected to continue with a potential target near $170-180.
💡 Short-term pullbacks inside the channel may offer entries as bulls eye higher resistance zones.
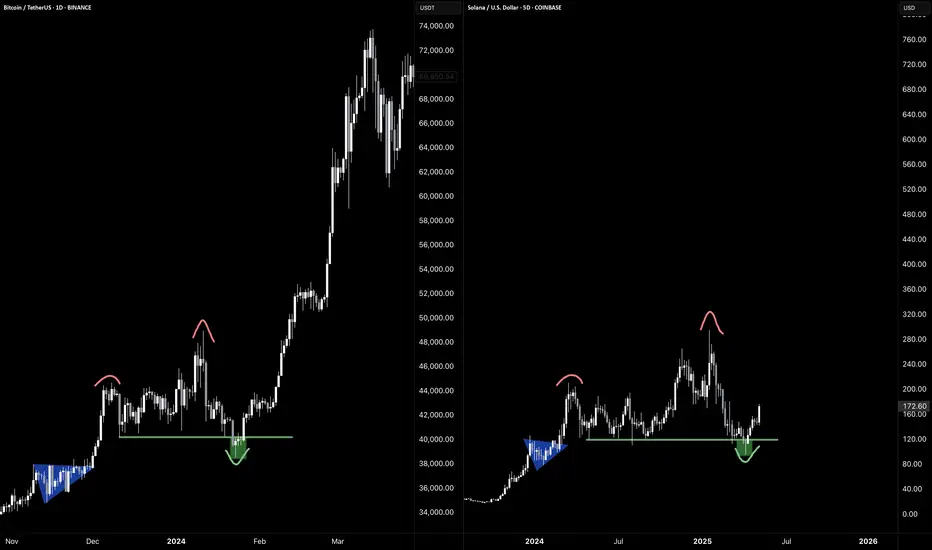
$SOL - Long FractalCRYPTOCAP:SOL Fractal compared with CRYPTOCAP:BTC from 2024.
Do not fade Solana.
My top pick this cycle.
-@CryptoCurb
This Low Cap Alt will 20-50x (CULT DAO)This crypto cycle has been brutal for alts. There have been massive shakeouts over and over, a relentless onslaught of rug pulls and scams, and the "Pump.fun" casino on Solana that’s drained billions of retail liquidity and transferred it to the few.
The few always seem to win, and the many always seem to lose. Today, if you’re reading this, it might all change.
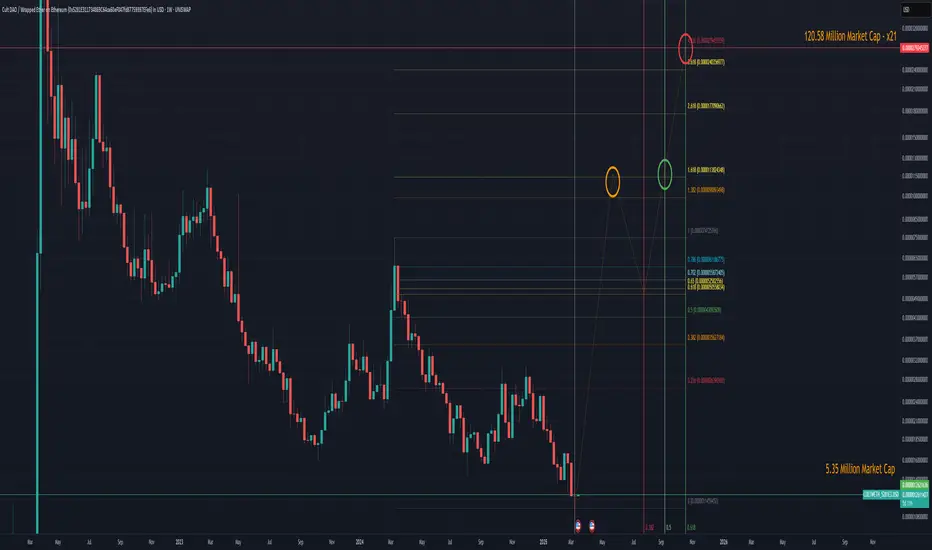
CULT DAO could easily 20-50x from now until October 2025. Let’s take a look at the MACD divergence.
### Technical Divergence
For 750 days, this bullish divergence has been forming on the histogram MACD. Every new low on price has formed a higher low on the MACD.
Let’s take a look at a case study of what happens when we get this form of divergence.
I traded this exact same pattern in 2022 that resulted in a nearly 425% move. The play function doesn’t work because they rebranded, and that ticker is no longer valid, but you can scroll to the bottom in my comments on that TA and see the move. I’ll post it under this as well.
As you can see, we got that 425% move. Currently, CULT DAO is showing exactly the same histogram divergence.
Here are some examples of zigzag impulses on low-cap alts. You tend not to get 5 waves; instead, you get this zigzag pattern. This is what I predict CULT DAO will do since it’s only a 5 million market cap.
We can also see in the chart that the 0.618 time Fibonacci level hits at the end of October 2025, which is exactly where I think the altcoin market will top. Check out previous TA on that.
This is only scratching the surface of what is to come for CULT DAO. I have presented to you the technical reason why a big move is stirring and why, at the apex of these divergences, the stars align, and you have the catalyst present itself, and boom—the explosive move comes all at once, and it will be extremely volatile because of its low market cap.
### Let’s Start with the Tokenomics
Every time someone sells or buys CULT DAO on Uniswap, there is a 0.40% tax that goes to a treasury. The top 50 stakers get to pass proposals that fund projects/investments. The idea is to remove the centralized component of funding a project.
121 projects have been funded over the last three years with 3 million dollars.
- Total CULT Funded: 479,751,081,214 CULT
- Total ETH Funded: 1,573 ETH
- Proposals Funded: 121
- Total USD Funded: $3,289,596
- Total ETH Burned: 303 ETH
Allocating these funds has been a learning process over the last three years, but every failure has been necessary in preparing the DAO for what’s to come next.
### The Big Catalyst
The creator of CULT DAO has been working on a blockchain that will function on a custom gas token—that’s right, and that custom token will be CULT DAO. You heard correctly.
Every transaction, every deployment on the blockchain will require the CULT DAO token as gas to execute. The implications are massive. There are multiple dApps that are currently being constructed on the Modulus blockchain.
A privacy-first zkEVM blockchain like Modulus means a scalable, Ethereum-compatible blockchain that prioritizes user privacy through zero-knowledge proofs, allowing optional private transactions while maintaining decentralization.
Modulus is a privacy-first zkEVM blockchain and is scheduled to release this year between April and August 2025. I hope now you’re starting to see the picture.
### CULT DAO and ETH Liquidity Pools
So, why does the price of CULT go down if there is currently very little volume? Well, CULT DAO and ETH liquidity pools are tied together, so if the ETH price goes down, so does CULT. In turn, if ETH goes up, so does CULT.
You can see that CULT is nearly at a 1:1 ratio with ETH for now, coming in at a 0.91 ratio.
In other words, if my thesis is correct about ETH and it goes to 15,000 dollars, the price of CULT would be as follows:
- ETH at $10,000:
CULT Price: $0.000005008 (4x increase).
Market Cap: $21.38M (4x increase).
- ETH at $15,000:
CULT Price: $0.000007512 (6x increase).
Market Cap: $32.08M (6x increase).
That’s right—if nobody even bought CULT, not one dollar, the base liquidity increase of ETH would bring the market cap to possibly 32 million, in other words, if you were thinking of buying ETH, why don’t you just buy CULT DAO?
You can buy ETH now; from this price, 15,000 is 7x, or you can buy CULT DAO, get 6x plus whatever extra volume is coming in. It seems like a logical play, really.
Everything you’ve seen so far is why I believe this MACD histogram divergence has been forming for 750 days. As I said, the stars will align at the apex, and the explosion will come.
### Unruggable and No Whales Controlling Supply
As you can see from the bubble map, the largest wallet that is not an exchange has a cluster total of 0.7%. The rest of the clusters you see in the image are basically exchange wallets, which are the red and dark green circles mostly.
Liquidity is also locked for over 200 years.
- Burned Supply = 1.29664T
- Circulating Supply (including staked) = 4.27T
- Staked Supply = 1.07599T
- Remaining Tradable Supply (excluding burned and staked) = 4.27T - 1.29664T - 1.07599T ≈ 1.89737T
So, no whales, and it’s not possible to rug because liquidity is locked.
### Modulus Blockchain Liquidity Injection
The average liquidity injection for DAOs in ZK would be anything from 200,000 to 10 million. Let’s assume it’s a $1M injection that is split 50/50 between CULT and ETH, a common practice for Uniswap-style pools.
- CULT Amount in Pool: At the current price of $0.000001252, $500,000 buys ~399.36B CULT ($500,000 ÷ $0.000001252).
It would increase the price to a 10 million market cap overnight.
### Conclusion
- Liquidity is locked for 200 years
- No whales
- Not possible to rug
- Mainnet launching this year
- ETH pools tied to CULT
- MACD histogram divergence
The target I have for CULT is just based on Fibonacci levels. Honestly, it’s unpredictable what will happen, how high it will go, or the impact the Modulus chain will have. 120 million is my low-end estimate; the macro Fibonacci is much higher.
The last extension puts it at a 1.4 billion market cap and 266x from where we are now.
This is where you want to be for the upcoming alt season—right here, down 98% with this massive divergence and all these factors that come into play. Just the mainnet launch and ETH going to 10,000 basically sends this to a 30-50 million market cap.
Cult DAO and Satoshi Nakamoto share a common ethos of decentralization and anti-centralization. We need to embrace this notion and bring back the power to the many. If CULT DAO hits 1.4 billion dollars, the treasury funds would be in the millions; we fund our own future.
moduluszk.io
cultdao.io
cultdao.io
coinmarketcap.com
SOL Analysis Deep Dive: Identifying Optimal Entry and Exit ZonesYesterday, SOL gave a sharp downside shakeout, dropping from the weekly open at $147.98 (perfectly retested) down to the 0.5 Fib retracement of the swing at $140.25. Here’s a structured breakdown of the key levels, trade setups, and R:R profiles for both longs and shorts:
🔑 Key Levels & Confluences
1. Higher-Timeframe Opens
Weekly Open & Retest: $147.98 – pivoted price before the drop
Monthly & Prior-Day Open Cluster: $147.98–$146.31 – strong support confluence zone
2. Fibonacci Support Zones
0.5 Fib at $140.25 – primary mean-reversion entry
0.786 Fib (smaller wave) at $138.78 – secondary, deeper support
3. Order Block
Daily Bullish Order Block at $139.87 – just below 0.5 Fib, adds extra support
4. Volume-Weighted Average Price
Anchored VWAP (from ATH $295.83) at ~$166.45 – key upside resistance
5. Market Profile Value Areas (10-Day Range)
Value Area High (VAH) at ~$153.00 – overhead resistance confluence
Value Area Low (VAL) at ~$145.75 – underpins support
📈 Long Trade Setups
1. 0.5/0.786 Fib + Daily Bullish Order Block
Entry: $141-138.78
Stop-Loss: $137.5
Target: $165 (anchored VWAP / Fib zones)
R:R ≈ 9:1
2. Higher-Timeframe Open Cluster
Entry Zone: $147.98–$146.31(monthly/weekly open)
Stop-Loss: $142.5
Target: $165
R:R ≈ 3:1
• Why these levels? The 0.5 Fib is a classic mean-reversion zone, bolstered by the daily order block. The $147–146 zone ties together multiple opens (weekly, monthly, prior-day), offering a solid demand area if price retraces back up.
📉 Short Trade Setup
Trigger: Rejection / swing-failure around $153.4
Entry: $153.4
Stop-Loss: $154.3
Target: Weekly/Monthly open (~$147)
R:R ≈ 6:1
• Low-risk short: A clean rejection at the recent high lets you define risk tightly above the swing, aiming to capture the retrace back to the opens.
🎯 Summary & Game Plan
Primary bias: Look for long entries at the 0.5 Fib ($140.25) or the open-cluster zone ($147–146), with targets toward the anchored VWAP at ~$166.
Alternate bias: A short on clear rejection from $153.4, targeting the opens as support.
Risk management: Keep stops tight (SL below $137.5 or above $154.3) to maximize R:R on your favored setups.
Volume & Price Action: Confirm entries with an uptick in volume or bullish price structure (for longs) or swift failure patterns (for shorts).
Now it’s a waiting game! Let price revisit these zones, watch for confirmation signals, and then scale into your chosen side. Good luck! Don't chase, let the charts come to you!
____________________________________
If you found this helpful, leave a like and comment below! Got requests for the next technical analysis? Let me know.
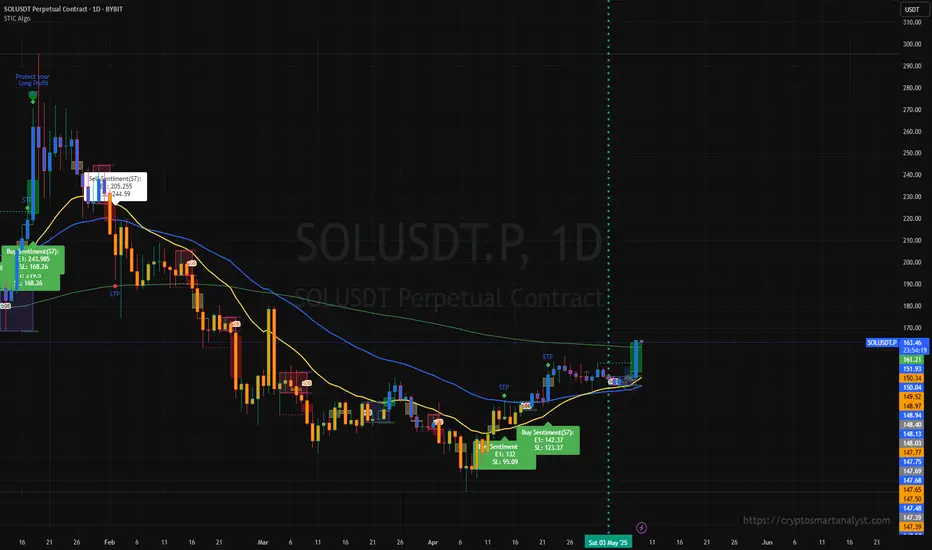
SOL breakout?Trading SOL on LTF was a good scalp; coming to the HTF, now this is looking good
Price action is still at exponential resistance, though. Fingercrossed, the bulls hold strong
Using STIC, i'm still bullish till otherwise.
#Tradesmartly
Solana - Here Comes The Bullish Reversal!Solana ( CRYPTO:SOLUSD ) might head for new all time highs:
Click chart above to see the detailed analysis👆🏻
Just a couple of months ago, Solana perfectly retested the previous all time high and created an expected short term rejection. However, with the current major support area and a potential bullish reversal, Solana remains in a strong market, potentially heading for new all time highs.
Levels to watch: $120, $250
Keep your long term vision,
Philip (BasicTrading)

U scared, I'm eyeing $100k by May.What beautiful price action.
We are going higher.
disagree if you want.
But you should probably hedge that viewpoint, with a bullish bet.
BALLA JI!
WE WILL WIN.
