Brett: Your Altcoin ChoiceA Solana memecoin, Brett produced a year long higher low with the classic ending diagonal pattern to signal an upcoming trend reversal.
The first low happened in April 2024. The second and higher low this month, this week, 7-April 2025.
The chart dynamics are very simple. Are you wondering, is the timing right? Right for a buy, maybe. Right to hold or, will a reversal happen soon?
The answer is positive to all those questions.
The time is right and is also ripe for a reversal to take place. This is the best possible time right now to buy and hold. The market must be bought when prices are low and red. This is the situation with the chart today. Prices are low and red but ready to turn. All the early signals are in.
BRETTUSDT is showing potential for a strong bullish wave in the coming months. Being new and also trading at bottom prices, growth can go off the chart. I will not be surprised when this pair goes beyond the 1,115% shown on the chart, this target is based on the mid-term.
The first target can reach 415%.
This is an easy chart. This is an easy trade.
I don't like memecoins, but it is not about what I like, it is about what the chart says.
The chart says that this pair is bullish with huge potential for growth. If you like it, feel free to enter with force. The Cryptocurrency market is turning bullish now and this and other pairs are sure to grow.
Thanks a lot for your continued support.
Your timing is great. A good Altcoin Choice.
Namaste.
Solana

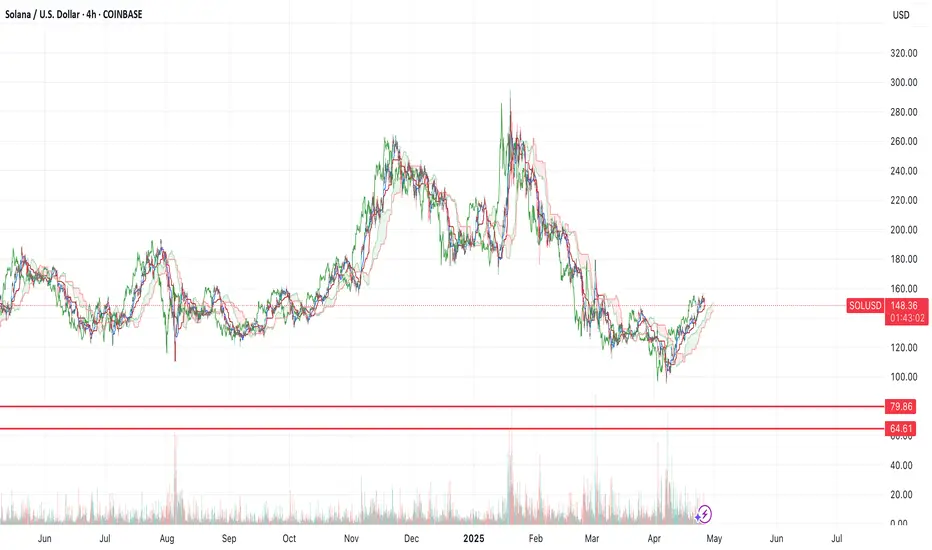
$SOL one more leg lower to $64-80Even though CRYPTOCAP:SOL has bounced nearly 50% from the bottom, the fall isn't over yet.
If we look at the chart, we can see that Solana has only fallen 4/5 waves down and it's the last leg down that will be painful for most.
Everyone is long again calling for new highs, yet the chart is still bearish.
I think it's likely that price retraces from around this level and falls down to the lower supports at $64-80.
Once we hit that region, it'll setup a good trade for the long term.
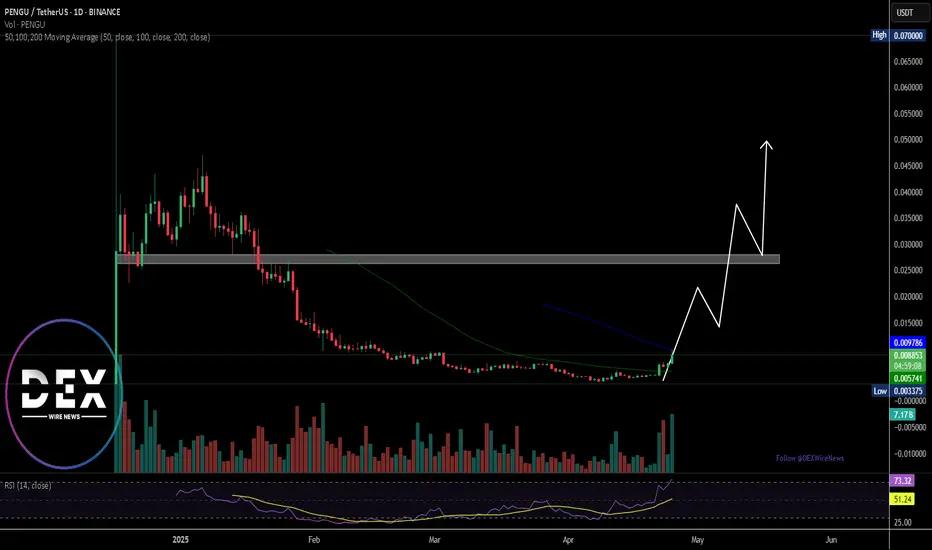
Breaking: $PENGU Spike 33% Today Gearing For Another Leg UpThe price of Pudgy Penguins ( CSECY:PENGU ) a solana based NFT platform similar to Magic Eden saw notable uptick of 33% today, reclaiming $600 million market amidst breaking out of prolong oversold levels.
About
PENGU is the official coin of Pudgy Penguins.
Pudgy Penguins has become the face of crypto with one of the most influential communities in the industry. From large companies wearing the Penguin, to being featured in ETF commercials, to garnering millions of followers and over 50 billion views, the Pengu has become a cultural icon.
Technical Outlook
Since listing, CSECY:PENGU has seen a notable uptick of +2,000% before sharply consolidating losing about 94% of market value. Present market metrics hints at a possible move to the $0.0266 resistant point and a break above the ceiling of that pivot would spark a move to the ATH recorded.
With the RSI at 73, CSECY:PENGU is looking to capitalize on the dip and make a comeback, with all present metrics hinting at a bullish reversal to the ATH territory.
Pudgy Penguins Price Data
The Pudgy Penguins price today is $0.008763 USD with a 24-hour trading volume of $379,038,248 USD. Pudgy Penguins is up 31.78% in the last 24 hours. The current CoinMarketCap ranking is #107, with a market cap of $550,838,659 USD. It has a circulating supply of 62,860,396,090 PENGU coins.
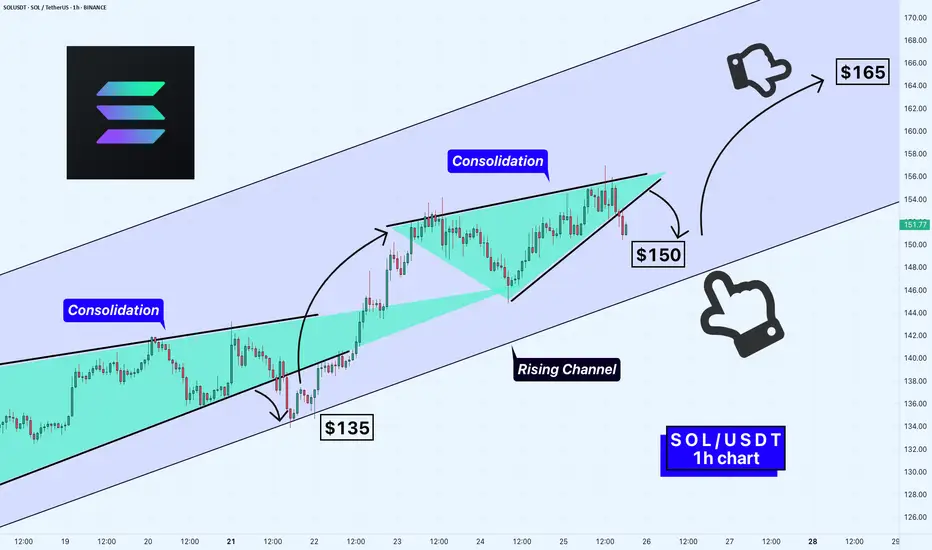
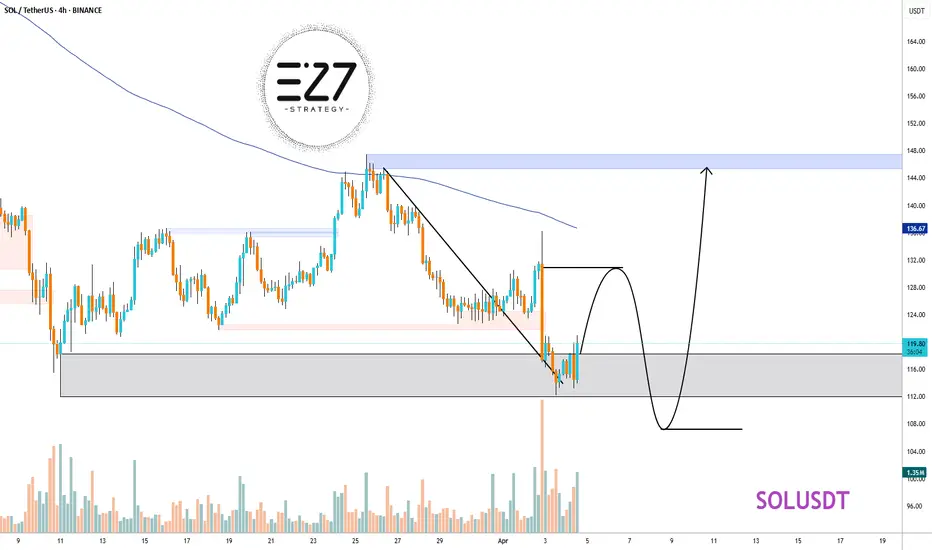
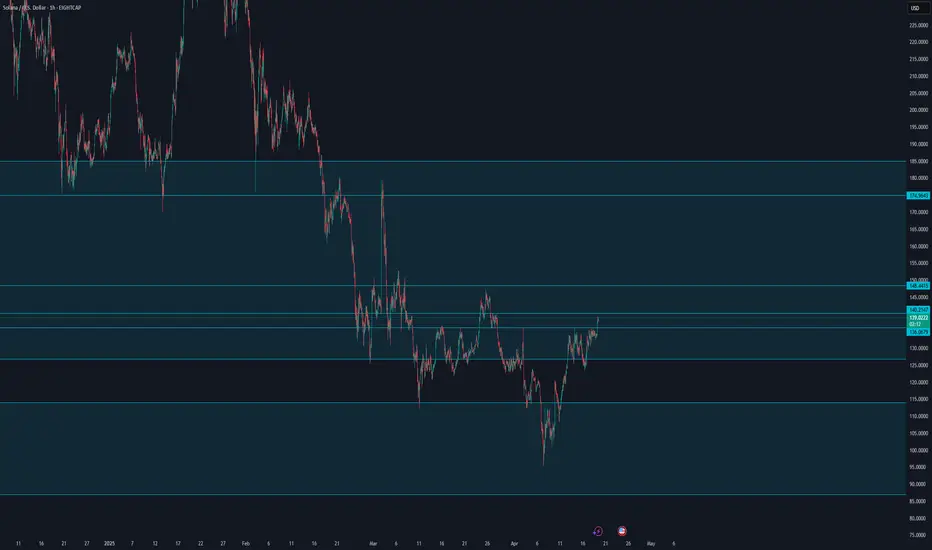
SOL / USDT Update - Breakout in Play! Check out the 1H chart for SOLUSDT. Solana is showing strength in a rising channel, with a recent breakout from a symmetrical triangle to support at $150.
If we break to $165, we could see a strong move higher. But if rejected, watch for a pullback to $150 or lower.
What’s your take?
Is a great time for holding Solana?!Hello guys!
What I see:
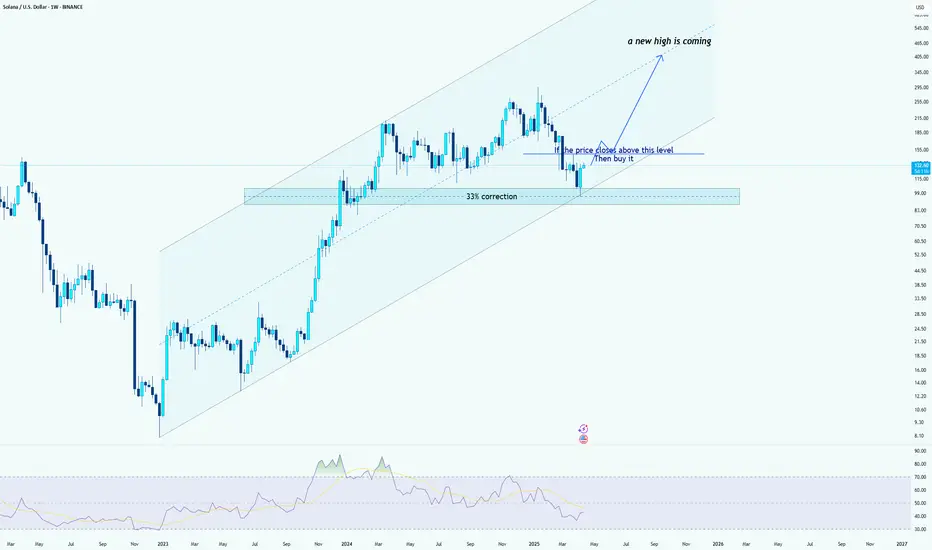
Ascending Channel: Price has been moving inside a clearly defined upward-sloping channel since the start of 2023, showing a strong long-term uptrend.
33% Correction: Recently, SOL experienced a 33% correction from its local high, testing the previous breakout zone (highlighted in light blue). This area has now acted as a strong support.
Bullish Signal: Price is attempting to reclaim and close above a key horizontal resistance level (~$132), noted by the text: “If the price closes above this level, then buy it.” A close above this level would confirm a bullish reversal and suggest strength returning to the trend.
RSI Outlook: The RSI indicator at the bottom shows a potential reversal from the lower range, indicating possible bullish momentum building.
Projection: If the price successfully closes above the mentioned resistance zone, the structure supports a potential move toward a new high, as marked by the arrow pointing toward the upper channel boundary (above $250 and potentially up to $300+).
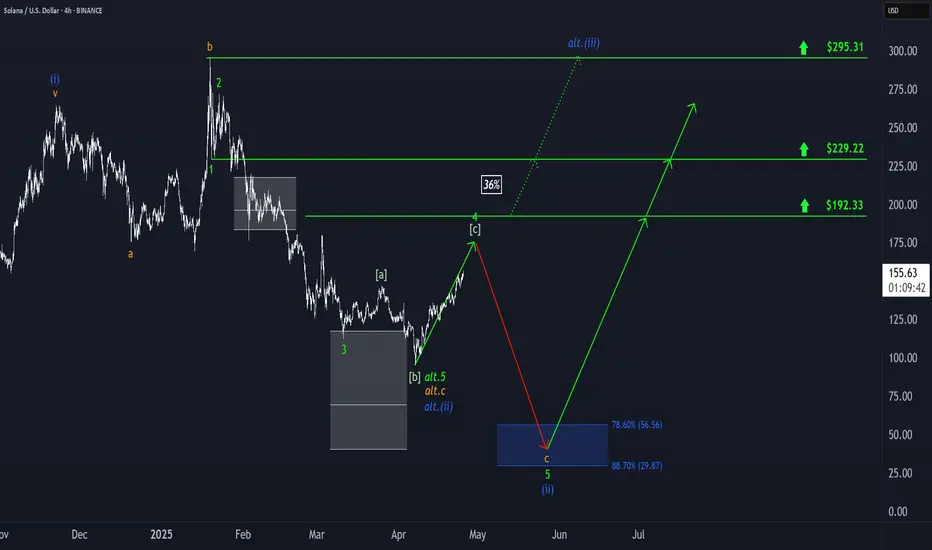
Solana: More RoomSolana’s countermovement of the green wave 4 has some more room on the upside. Once the wave-4-top is established (below the resistance at $192.33), we primarily anticipate a wave 5 sell-off down into the blue Target Zone on the downside (coordinates: $56.56 – $29.87). In this range, the wave (ii) corrective movement should conclude, and the altcoin should start the next sustainable upward impulse. However, if the price rises above the mentioned $192.33 mark during the current upward movement (36% likely), this will suggest that the low has already formed via wave alt.(ii) in blue.
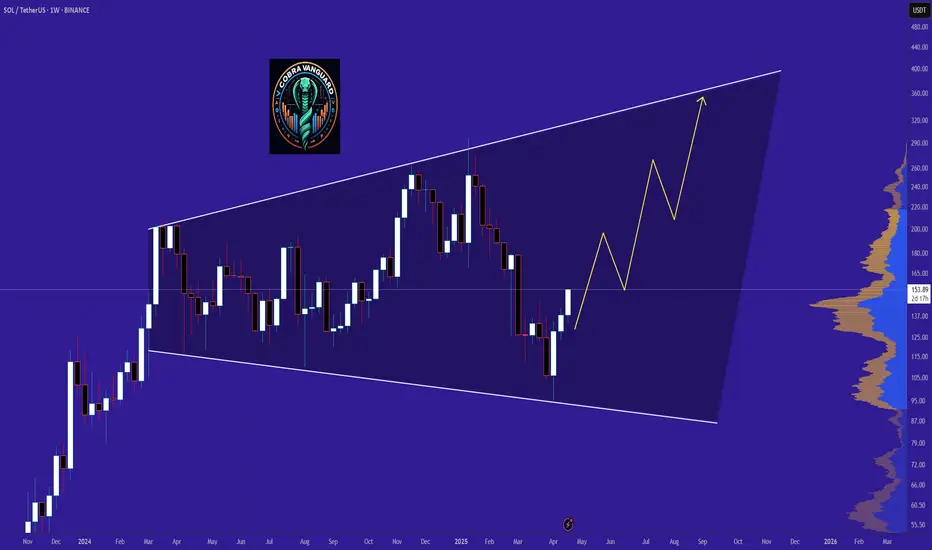
SOL in coming weeksThe SOL will increase $150 and reach to the top of the wedge in the coming weeks .
Give me some energy !!
✨We spend hours finding potential opportunities and writing useful ideas, we would be happy if you support us.
Best regards CobraVanguard.💚
_ _ _ _ __ _ _ _ _ _ _ _ _ _ _ _ _ _ _ _ _ _ _ _ _ _ _ _ _ _ _ _
✅Thank you, and for more ideas, hit ❤️Like❤️ and 🌟Follow🌟!
⚠️Things can change...
The markets are always changing and even with all these signals, the market changes tend to be strong and fast!!
SOL/USDTInitially, there is a level, there is also a liquidity removal.. but I would like to show you the indicator that I came up with and prescribed and how it works. Thank you all so much!
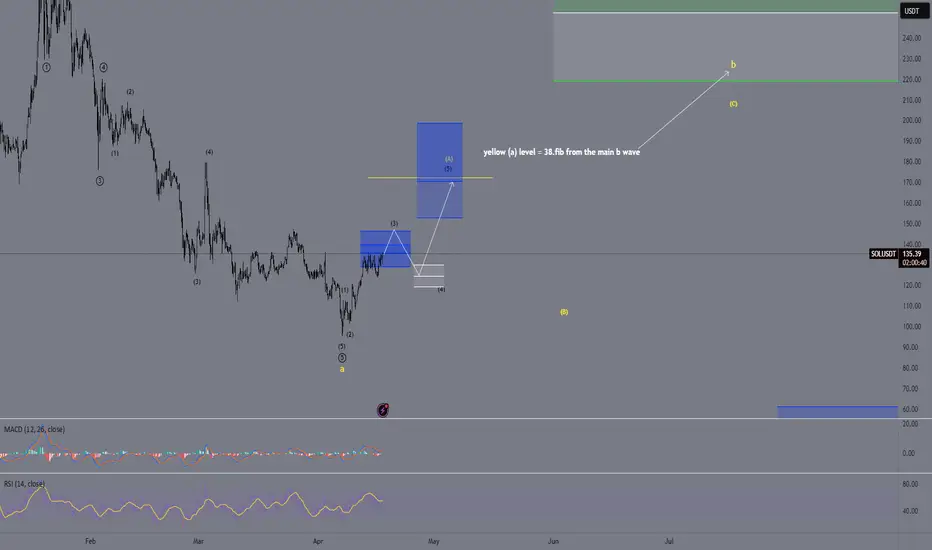
Solana structur-update ElliotWaveBINANCE:SOLUSDT
I'm still anticipating the same pattern; the only change is an additional high in wave 3.
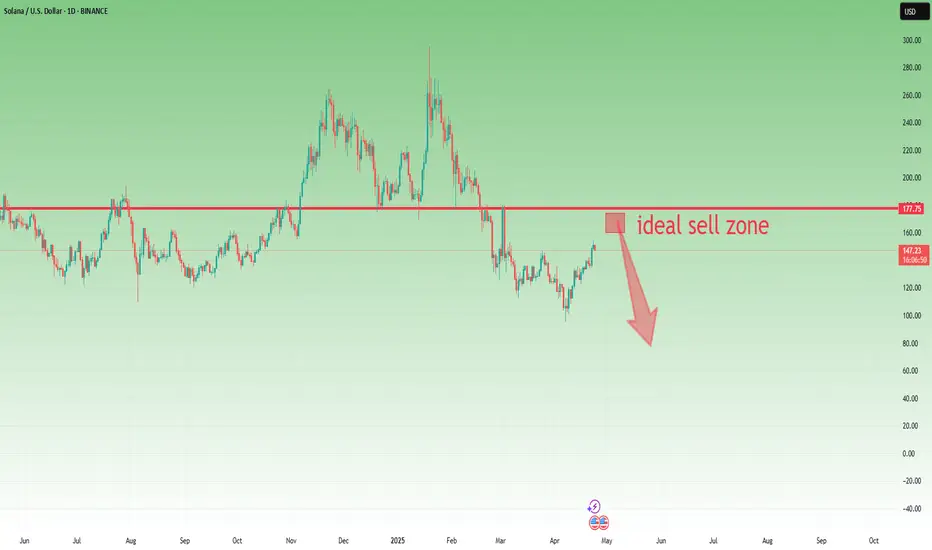
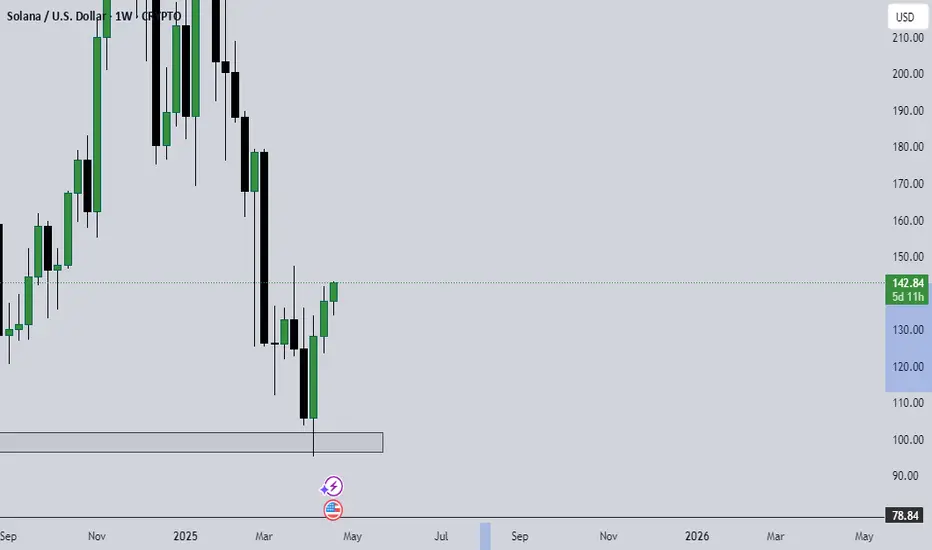
Solana – Bear Market Rally or Reversal?Like the rest of the crypto market, Solana started rebounding on April 8th, pushing more than 50% up from the recent lows. But just like with many altcoins, I'm not convinced this is a true trend reversal. Instead, it looks more like a classic bear market rally.
Let’s not forget: SOL is coming down from nearly $300. A bounce from $95 to $150 is strong, yes—but in the bigger picture, it’s still just a correction.
📍 Key resistance zone: $160–$170
As long as price remains under this zone, the probability of another leg down remains high.
🧠 My plan:
If Solana creates a new local high around $160, I’ll be looking to sell into the rally.
🎯 Target:
$100 at least, depending on how the market reacts.
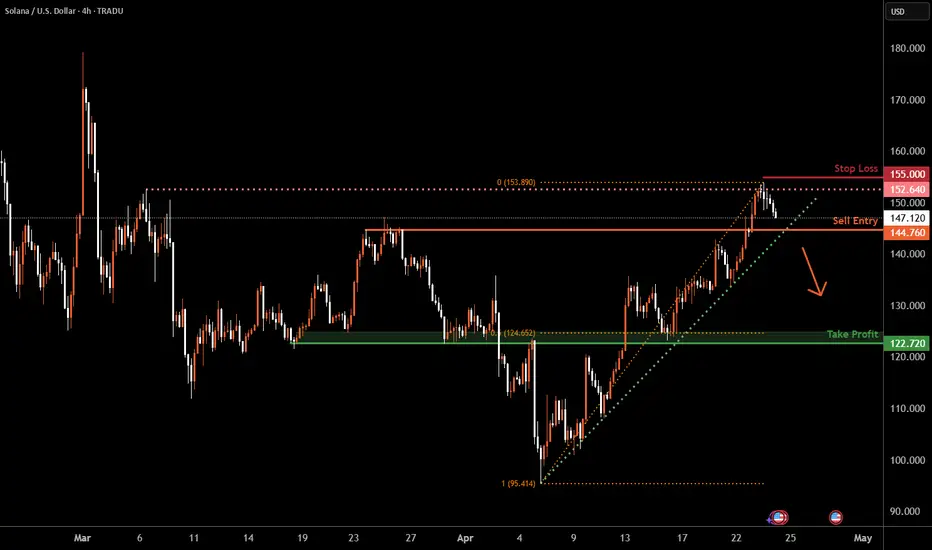
Solana H4 | Potential bearish breakoutSolana (SOL/USD) is falling towards a potential breakout level where the price could fall lower from here.
Sell entry is at 144.76 which is a potential breakout level.
Stop loss is at 155.00 which is a level that sits above a multi-swing-high resistance.
Take profit is at 122.72 which is an overlap support that aligns close to the 50.0% Fibonacci retracement.
High Risk Investment Warning
Trading Forex/CFDs on margin carries a high level of risk and may not be suitable for all investors. Leverage can work against you.
Stratos Markets Limited (tradu.com):
CFDs are complex instruments and come with a high risk of losing money rapidly due to leverage. 63% of retail investor accounts lose money when trading CFDs with this provider. You should consider whether you understand how CFDs work and whether you can afford to take the high risk of losing your money.
Stratos Europe Ltd (tradu.com):
CFDs are complex instruments and come with a high risk of losing money rapidly due to leverage. 63% of retail investor accounts lose money when trading CFDs with this provider. You should consider whether you understand how CFDs work and whether you can afford to take the high risk of losing your money.
Stratos Global LLC (tradu.com):
Losses can exceed deposits.
Please be advised that the information presented on TradingView is provided to Tradu (‘Company’, ‘we’) by a third-party provider (‘TFA Global Pte Ltd’). Please be reminded that you are solely responsible for the trading decisions on your account. There is a very high degree of risk involved in trading. Any information and/or content is intended entirely for research, educational and informational purposes only and does not constitute investment or consultation advice or investment strategy. The information is not tailored to the investment needs of any specific person and therefore does not involve a consideration of any of the investment objectives, financial situation or needs of any viewer that may receive it. Kindly also note that past performance is not a reliable indicator of future results. Actual results may differ materially from those anticipated in forward-looking or past performance statements. We assume no liability as to the accuracy or completeness of any of the information and/or content provided herein and the Company cannot be held responsible for any omission, mistake nor for any loss or damage including without limitation to any loss of profit which may arise from reliance on any information supplied by TFA Global Pte Ltd.
The speaker(s) is neither an employee, agent nor representative of Tradu and is therefore acting independently. The opinions given are their own, constitute general market commentary, and do not constitute the opinion or advice of Tradu or any form of personal or investment advice. Tradu neither endorses nor guarantees offerings of third-party speakers, nor is Tradu responsible for the content, veracity or opinions of third-party speakers, presenters or participants.
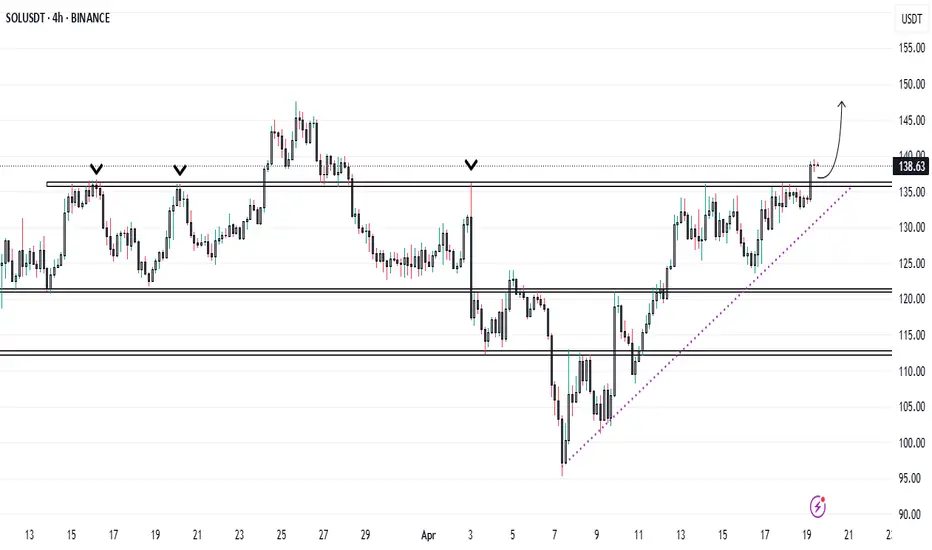
$136 Resistance Crumbles: Solana Bulls Take the Lead...Solana Breaks Key Resistance – Eyes Set on $150 and $180 Targets
Solana (SOL) has successfully broken through the strong resistance level at $136 after several failed attempts, signaling a potential continuation of its current uptrend. This breakout marks a significant technical milestone for SOL, which had previously struggled to maintain momentum above this price zone.
If Solana is able to hold above the $136–$137 level, it could open the door for further gains, with short- to mid-term price targets around $150 and $180. The breakout aligns with broader bullish sentiment in the crypto market and may attract new buyers looking to ride the trend.
For traders or investors interested in entering a position, the $136–$137 range could offer a potential entry point, provided the breakout holds and is supported by volume. As always, proper risk management is recommended, and watching for confirmation on the next few candles could be key.
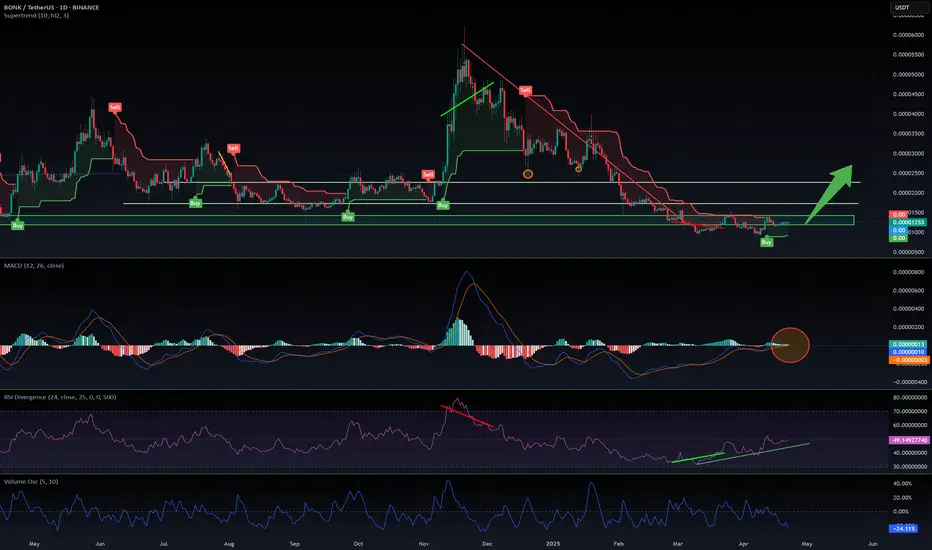
$BONK: Prepping for a Potential Explosive Move🚀 SEED_DONKEYDAN_MARKET_CAP:BONK : Prepping for a Potential Explosive Move
SEED_DONKEYDAN_MARKET_CAP:BONK is known for its wild, high-volatility pumps—and we may be approaching another one.
After a significant bearish divergence on the daily chart, SEED_DONKEYDAN_MARKET_CAP:BONK has retraced to levels lower than last year. However, it's important to remember: SEED_DONKEYDAN_MARKET_CAP:BONK is the original meme coin of the Solana ecosystem, and it's strongly supported by Solana whales.
📈 If CRYPTOCAP:SOL rallies, SEED_DONKEYDAN_MARKET_CAP:BONK usually follows.
While a new all-time high might be out of reach in the short term, a significant move to the upside is on the table. Here's why:
✅ RSI is rising, forming a bullish divergence
✅ Price has entered my 2025 buy zone
✅ MACD has just crossed bullish on the 1D timeframe
✅ Volume is low, often a precursor to explosive moves
✅ CRYPTOCAP:OTHERS index is showing signs of strength—altcoin momentum is building
🧠 If momentum picks up, we could see a 2x to 3x move from current levels.
📌 Keep an eye on this one. As always, DYOR.
#BONK #Solana #MemeCoin #Altcoins #CryptoTrading #CryptoSignals #BONKArmy #MACD #RSI #DYOR #Altseason #CryptoAnalysis
SOLUSDT SOLUSDT Analysis 📊
🔹 Support Levels: 118, 112, and 107 USD
🔹 Resistance Levels: 130 and 150 USD
✅ The price has reacted positively after testing the 118-112 USD support zone, showing a short-term bullish move with increasing volume.
📉 If the price fails to break 130 USD, a pullback to 118 USD is possible.
📈 A breakout above 130 USD could pave the way for a move toward 150 USD.
🔍 Conclusion: The bullish trend remains unconfirmed until 130 USD is broken.
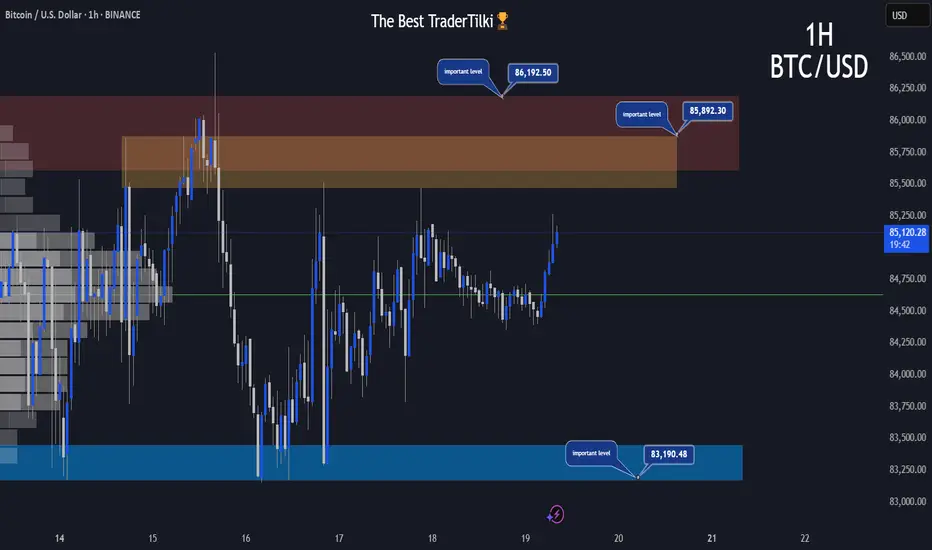
BTCUSD | 1H | IMPORTANT LEVELSHey There;
I’ve prepared a fresh Bitcoin analysis just for you.📈
Key resistance levels for Bitcoin are 85,892.00 and 86,192.00, while the support level stands at 83,190.00.⚠️
If Bitcoin breaks above the 86,192.00 level, the next target could be around 88,860.00.📣
I truly care about you all, and keeping you informed is something I see as my responsibility.🥰
Wishing you an amazing day ahead!💙
$SOL - Pullback to $120 Likely?Solana recently rebounded from a key higher-timeframe support level. However, a short-term pullback to around $120 could be on the horizon before any significant upward move.
For a short-term outlook, check this video.

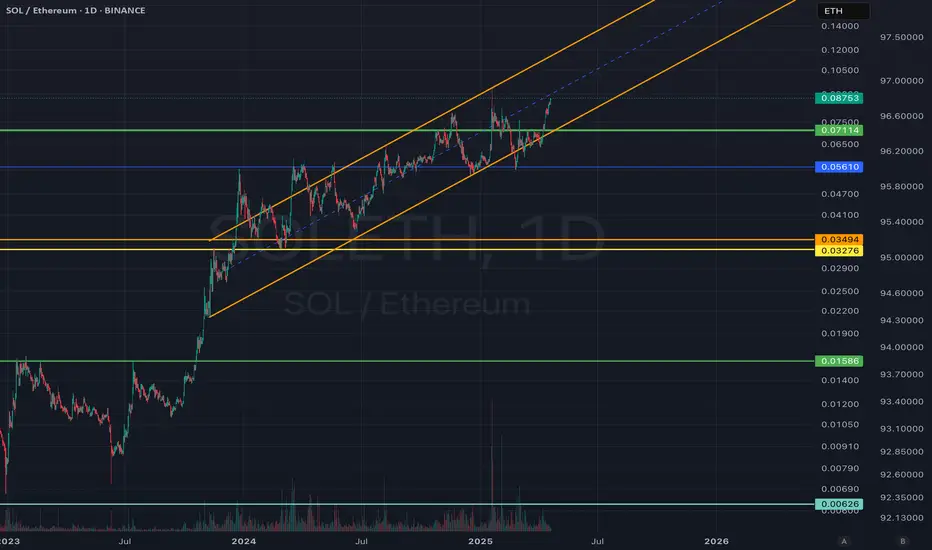
SOLANA has obliterated ETHERIUM in this bull market.We now know that approximately 70% of all daily blockchain fees are collected on Solana chain. This reminds us of Etherium in the previous cycle. Solana's being faster and cheaper, ETH L2's cannibalizing their mother chain in activity and fees, and complexity of execution in Etherium chain might be seen as the main reasons here (please comment if any more).
When we look at the price action, we see that CRYPTOCAP:SOL has outvalued CRYPTOCAP:ETH 1200% since the start of 2023. The interesting fact is that this uptrend has been intact since then. While ETH maxis, like a religious revelation, claim that ETH will rise from its ashes and beat BTC eventually, the fundamentals and technicals do not support this idea. I predict that unless dramatical fundamental changes happen, this trend will continue throughout the final stages of this bull market. So I continue to be long SOLETH
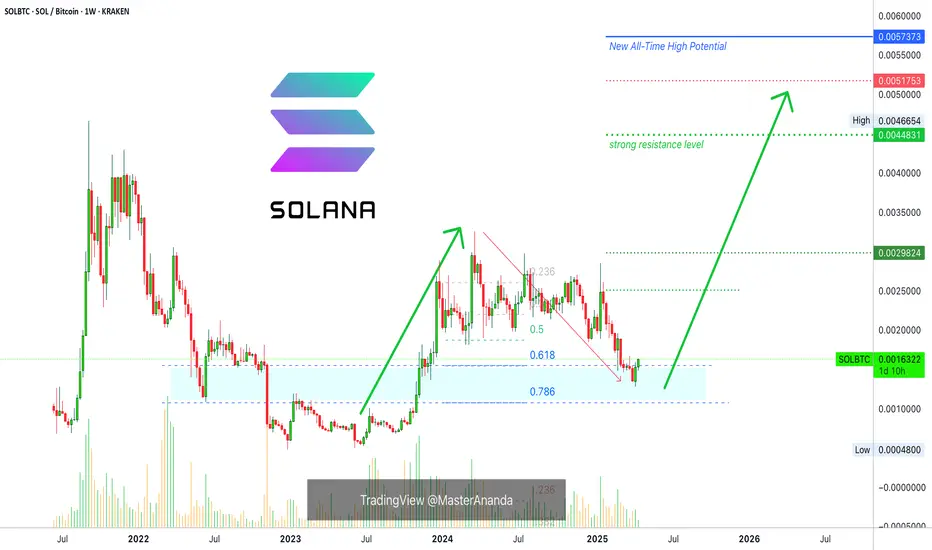
Sol Extremely Bullish FractalHi
Please click like
So this is as fractal from previous bull run in 2021, and used the same fibonacci targets for this bull run.
The chart here is SOLBTC, so if peak on this chart is 0.01BTC and BTC today is 100K =
SOL 1k.
If BTC peak is 200K -> Sol is 2K... etc.
----
This is a dreamy target, but it is in my opinion important to have some extreme targets.
I have been in crypto for 7 years, and havent we all seen extreme things happen ?
Perhaps this could be possible with SOL "eth killing" and taking the coin nr 2 place ?
Watch below some other SOL vs ETH ideas. It looks.. possible..
Or ? What do you think ?
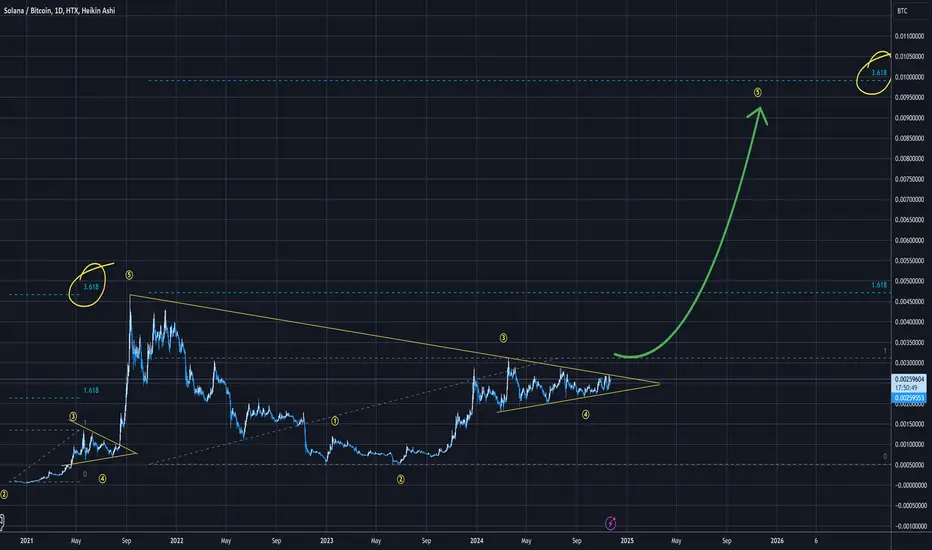
Solana Vs Bitcoin: New All-Time High In Late 2025Solana vs Bitcoin has not been bullish since March 2024 and is about to go bullish now after more than a year of no growth. It went sideways first and then it produced a crash but finally, the market found support.
What we have here is simply awesome because there is no better trade than to trade against Bitcoin when Bitcoin is going up. SOLBTC growing while Bitcoin also grows.
Support was already tested and confirmed. It is over. We are now green.
SOLBTC moved below 0.618 Fib. retracement but bounced before reaching 0.786. Support was found right at the middle. The action recovered back above 0.618 and this is super bullish. This is literally as bullish as it gets and prices are extremely good right now. Bottom prices. The lowest possible before the next bullish wave.
I mentioned with XRPBTC (visit my profile) that the project is developing nicely and a new All-Time High is very likely, high probability. The same is true for SOLBTC. This is another project that is growing very fast and there is strong support from the market and great adoption across the world. Solana is one of the top Altcoins, this we all know.
This week is the second green week with a full green candle. The action will be up, up, up, like late 2023 and early 2024. Something similar but the final swing will be much stronger, the bull market bull run.
It is likely that the end price, the new All-Time High, will go beyond what is shown on the chart.
Namaste.
Global Market Overview. Part 4.2: SOLANA
Solana: The American Blockchain Making a Comeback
(Previous post: )
Continuing from everything I’ve written earlier about Bitcoin and Ethereum, Solana deserves a separate spotlight.
Because this asset is a different story altogether. It’s not like Bitcoin. It’s not like Ethereum.
Solana has its own path, its own logic — and most importantly, its own market cycle, which follows a very different pattern of growth.
Why did Solana rally?
Let’s be blunt: Solana isn’t just a blockchain — it’s the epicenter of the new crypto cycle, where the main drivers weren’t decentralization or institutional capital, but memes, hype, and community.
Thousands of new tokens launched on Solana became the spark behind an explosion of interest.
The network surged with activity, and it was that real usage — not marketing — that pushed market cap higher.
But that’s not all.
Solana is Made in the USA.
And in crypto, just like in politics, that matters.
An American project, developed on U.S. soil, Solana quickly gained the trust of the largest and wealthiest crypto investor base in the world — American investors.
To be precise: it was the U.S. crypto community that pushed Solana into the mainstream.
And once funds and OTC brokers joined the party, it became clear — this asset isn’t going anywhere.
What about fundamentals?
Peak price: nearly $300
Growth from 2021 to 2024: one of the fastest in crypto
Network load: consistently high
Number of projects in the ecosystem: growing
Confirmed approval for a Solana ETF in the U.S.
Technological flexibility and strong developer support
U.S. jurisdiction: trusted by both institutions and retail
Why didn’t it crash with the rest of the market?
Here’s the twist: even as the crypto market was rocked by negative news and broad corrections, Solana held above $100.
That’s a key support level — and it held up under pressure from:
Trump’s tariff panic
Futures market liquidations
Capital outflows from other altcoins
Rising Bitcoin dominance
Yes, the price pulled back to the $130–140 range, but it never broke major support — a clear sign that strong hands haven’t let go.
But why hasn’t it gone higher if things are so good?
Simple: the Solana ETF hasn’t officially launched yet.
But once formal approval from the SEC is in place — the asset is set to explode.
We already saw a pump above $200 just on rumors.
Now the clock is ticking — when will rumor become reality?
And here’s a spoiler: the Solana ETF has already been approved.
In crypto, that’s how it goes — first the whispers, then insider info leaks, then the price runs.
And finally, when the official news drops — that’s when the real move starts.
We haven’t seen that final leg yet because of all the macro confusion over tariffs.
What’s next?
I’m not giving financial advice.
But here’s the reality — I bought Solana on the dip and I’m still buying.
Why?
Because I need to recover the $300K I lost on Ethereum
Because everything points to a continuation of the bull trend
Because no other major asset offers this kind of symmetry between fundamentals and upside potential
Solana isn’t a bubble.
It’s a trading platform for the meme economy — and one of the few blockchains where actual demand matches real scalability and low fees.
And in crypto, that means a lot.
My personal take
If you’ve got free cash right now — don’t be afraid to look Solana’s way.
I see no reason to fear this asset in the medium to long term.
The network is alive. The network is growing. The asset is holding strong.
Now all we need is the next trigger — and it will come.
The potential to see $200 again in the coming months?
Very real.

Solana has just made an upward moveSolana has just made an upward move due to liquidation levels. At the $140 level, we will most likely see a brief downtrend again, after which we will set the price target at $174. Based on historical data, this timing would also make sense, and it aligns with the liquidation levels from futures positions.
SOLUSDT - Trade LogSOLUSDT – Long Setup in Daily FVG
Entry: Buy at 124 USDT (floor of the daily Fair Value Gap)
Stop Loss: 105 USDT (just below the daily FVG low)
Take Profit: 200 USDT (new all‑time highs)
Rationale:
• Price is retracing into the daily FVG, offering a high‑probability support zone
• Daily RSI double divergence & trendline support reinforce the FVG floor
• Spot accumulation targeting euphoria phase—leveraging the FVG for entry
Risk Management: Risk ~5% of account. If SOL closes below 105 USDT (invalidating the FVG), exit and reassess. Keep an eye on BTC direction as the primary driver.
