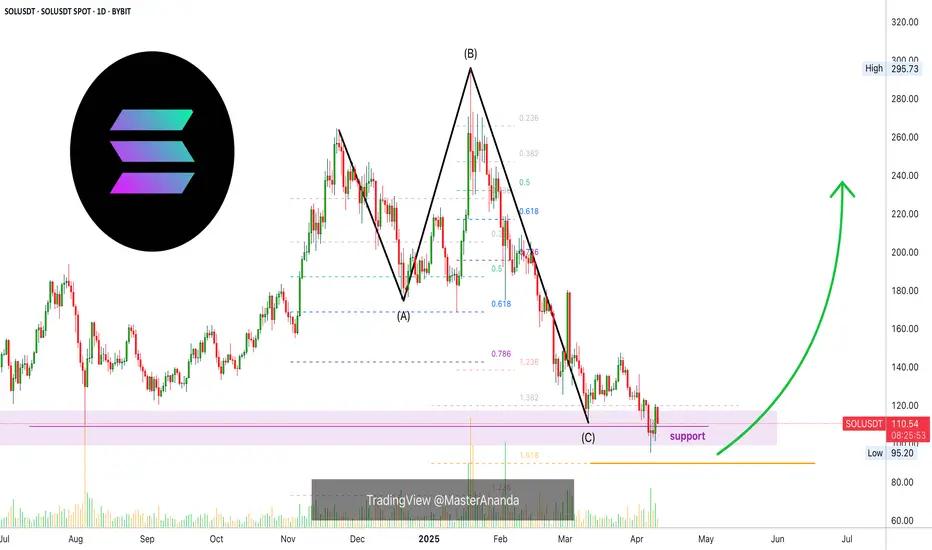
SOL preppin for a 300 revisit from this 100 bargain zone. SEED!SOL has been on rollercoaster ride the past few months -- going from 100 to almost 300 in a zoom when the market is at its peak.
Moreso, when memes started taking over the market and everyone, including the president himself is launching one on SOL blockchain, market started pickup up pace and eliciting euphoria among all, albeit momentarily. It has stirred up some hype and frenzy skyrocketing prices only to be met with so much saturation and gravity, then the BIG BLEED happens.
After a few weeks thing seem to have settled down -- a shift is gradually transpiring as we speak. SOL is now exhibiting some basing behavior at this current range at 100 levels. Net longs has started to pile up around this zone conveying a prep work of upside reversal soon.
Long term metrics suggests a tap at 61.8 FIB levels - a buyers convergence zone. This is where it all starts.
Ideal seeding is at the current discounted price range.
Spotted at 110
Mid target 300.
Long term 500.
TAYOR. Trade safely.
Solana

Janover Stock Spike 1100% After Completing First Solana PurchaseJanover (NASDAQ: NASDAQ:JNVR ) has invested over $9.6 million into Solana (83,000+ SOL) as part of a new digital asset treasury strategy, with plans to stake its holdings and run validators to generate onchain revenue.
The move follows a $42 million funding round and has triggered a 1,100% surge in Janover’s stock price as the company positions itself as a transparent, publicly traded vehicle for crypto exposure.
The company bought $4.6 million of Solana’s SOL token on Thursday. Earlier this week, Janover announced that it raised $42 million through the private offering of convertible notes and warrants, with plans to acquire SOL.
Janover shares were last higher by more than 64%, after skyrocketing more than 1,100% earlier in the day.
“Our aim is to be the most efficient and transparent vehicle for crypto accumulation in the public markets,” Janover CEO Joseph Onorati said in a statement Thursday. “Executing our first SOL purchase within days of completing our restructuring reflects that commitment.”
Janover, a software company founded in 2018, on Monday announced a new crypto-focused treasury management strategy after a team of former executives from the popular Kraken crypto exchange acquired majority ownership of the firm. It also plans to change its name to DeFi Development Corporation and revise its ticker symbol.
As of the time of writing, the stock is up 13.88% with the RSI at 58.77 there could be room for more bullish campaign. Similarly, the 45 -minute price chart depicts a cup formation with the handle still forming- this is typically identified as a bullish pattern.

Solana Surges Nearly 8% As Janover Pivots to Solana Treasury The price of Solana ( CRYPTOCAP:SOL ) famously known as the ethereum killer has surged nearly 8% today as Commercial property platform Janover pivots to Solana treasury strategy, stock surges 1,100% as investors rush in prior the news.
Janover has invested over $9.6 million into Solana (83,000+ SOL) as part of a new digital asset treasury strategy, with plans to stake its holdings and run validators to generate onchain revenue.
The move follows a $42 million funding round and has triggered a 1,100% surge in Janover’s stock price as the company positions itself as a transparent, publicly traded vehicle for crypto exposure.
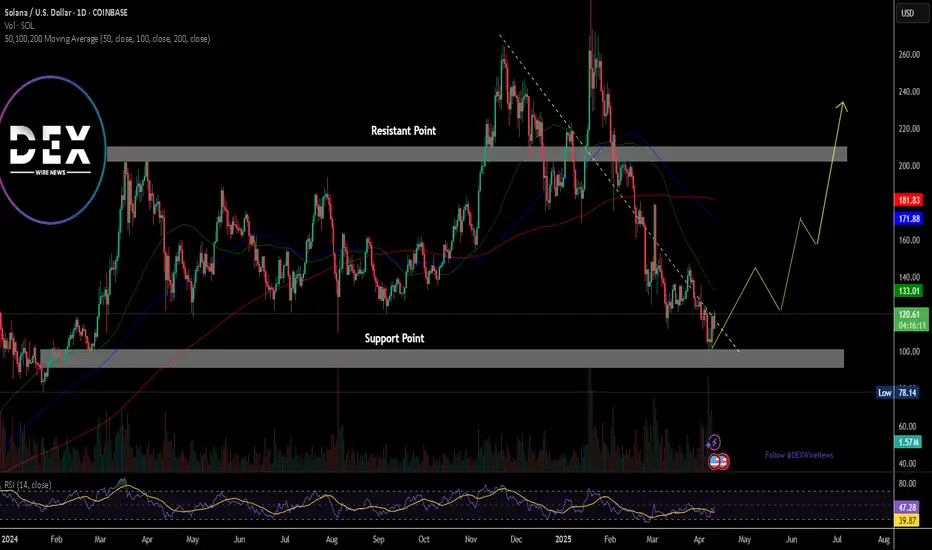
Solana has lost grip of the $120 pivot for the past 2 weeks, but reclaimed the zone today currently trading at $120.54 per $SOL.
The daily price chart shows Solana has been trading within an enclose rectangular zone with the Resistant and support points slightly above each other. For Solana, a break above the $170 zone could pave way for a move to the $200- $270 zone. Similarly, a break below the $100 zone could be catastrophic for Solana.
However, the RSI shades a bit of a light at the end of the tunnel as it stands at 47, which is prime for a reversal.
Solana Update: To Buy Or Not To Buy? Hold Or Sell?Here is an update on Solana.
The chart has the same numbers as before but the support line has been moved to match the 5-August 2024 low. The action is happening right above this level.
While Solana trades above its August 2024 low, the action is considered bullish. Below this level and we are certainly bearish. Being bearish in this way does not change the long-term outlook, bias and perspective, we are set to grow long-term based on a broader trend and bigger cycle. This is a closer look.
The low in April is a shy lower low compared to March. This is always important. Notice the steep decline. This is a bearish impulse, prices tend to move down fast and strong. When bearish momentum starts to die down, we see patterns like the one we have on the chart above. Some shaky action and then a lower or higher low. The market (SOLUSDT) is preparing to change course.
The correction is present since November 2024. For Solana, the higher high in January 2025 is part of a complex correction, an extended flat. 3-3-5 wave in Elliott terms.
This is irrelevant. The point is that once the correction is over prices tend to grow.
Consider this, between June and September 2024 we have more than three months of consolidation. The market garnered enough strength to produce a bullish wave. It took a while but it happened. Then there is a correction and this bullish wave was erased by more than 100%.
If buyers showed up at a price of $100, $120, $130 and even $150 in the past, they can definitely show up again. Now that the bullish move has been erased, we are back to square one, the starting point, the base; from this point forward Solana can grow again.
Solana looks weak right now on the very, very short-term. But do not let this deceive you, we are going up next. Focus on the long-term.
Accumulation can be done each time prices hit support.
What happens if I buy and prices move lower?
Wait patiently. If you have capital available, buy more.
And if it drops again? Keep waiting, continue buying.
You will be happy with the results once the market turns.
Thank you for reading.
Patience is absolutely key.
If you didn't sell at $290, $280 or $250, why would you sell when prices trade at $100? It makes no sense.
Buy when prices are low and hold.
Only sell when prices are moving higher.
Namaste.
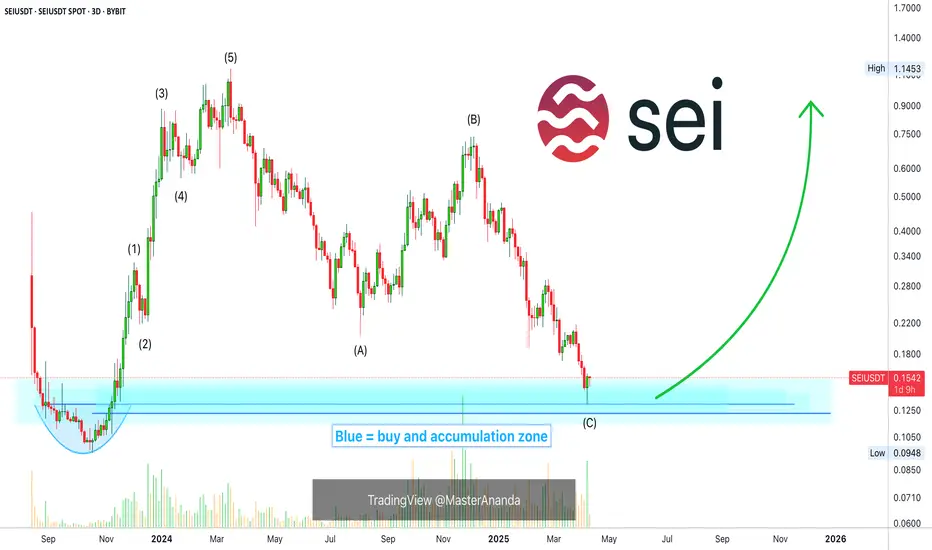
SEI: Your Altcoin ChoiceThe last session produced the highest volume since November 2024 and activated the baseline of a rounded bottom pattern that launched the first SEIUSDT bullish wave.
SEI's first bullish wave produced more than 1,101% growth. The peak happened in March 2024. After this peak, bearish all the way. The next major low happened on the 7-April 2025 trading session, 3D. More than a year of bearish action. I say this is enough.
A long-term higher low is present vs October 2023. The chart is clear and easy. Market conditions are about to change. The high volume on the more than a year strong higher low indicates that buyers were present. Support is activated but still early. Confirmation comes when multiple sessions close green without the last low, 0.1303, getting challenged again.
I don't think we should wait for confirmation. The wise move would be to do like the whales and start an accumulation phase. Instead of waiting for a certain market condition to be met, once support is hit we start to buy as much as we can. Prices will always fluctuate and fake signals are the norm. The market can move down and pierce support just to produce a fake bearish signal and then grow. It is very hard if not impossible to predict the short, short-term. When focusing on the bigger picture, we know the market is set to grow next. Knowing this, we buy, accumulate, as much as we can in anticipation of this bullish wave.
It is early but a long-term correction is over. What follows, is growth.
Thank you for reading.
Namaste.
SOLANA on its huge Bull Cycle Support.Solana / SOLUSD just hit the Rising Support that started back on the December 26th 2022 Bear Cycle Bottom.
Meanwhile, it hit for the first time in its history its 1week MA200. This is a huge Support cluster.
Having declined by -68.21% from its January All Time High, it looks identical to the last correction (also -68.21%) of the last Bull Cycle in May-June 2021.
A +1278% rally followed and it since we now enter the final phase of the Bull Cycle with the most aggressive rallies historically made, a new +1278% increase is technically possible.
Target 1200.
Follow us, like the idea and leave a comment below!!

SOL LONG????🔍 Overall Market Structure
The price recently saw a sharp drop from the $120.69 high and is currently consolidating around the $108–110 area.
A bullish structure is forming, suggested by the potential for a reversal pattern from a support zone.
🧠 Key Technical Components
📉 Fibonacci Levels (retracement from $101.21 to $120.69):
0.236 – $115.78 (resistance)
0.382 – $112.84
0.5 – $110.53
0.618 – $108.25 ← Current support
0.786 – $105.20
Price is bouncing from the 0.618 zone, a strong reversal area.
🟣 RSI (Relative Strength Index):
RSI is near oversold (31.15) and showing bullish divergence:
Price made lower lows.
RSI made higher lows.
This divergence suggests momentum is weakening on the downside, signaling a potential bullish reversal.
🟪 Support & Resistance Zones:
Demand Zone (support) around $107–108 (marked with purple box).
Supply Zone (resistance) around $118–120.
Price could bounce from support, targeting higher fib levels and possibly retesting the supply zone.
✏️ Projected Price Action (Black Curve):
Anticipated short-term reversal from $108.
Price might climb through:
$110 (0.5 fib)
$112.84 (0.382 fib)
Potentially to $115.78 (0.236 fib) or even back to the $120.69 high.
Shown within a larger wedge structure, so upper trendline resistance around $120.
✅ Conclusion:
Bullish reversal likely from $107–108 support.
RSI divergence + Fibonacci confluence supports the reversal thesis.
Next targets: $110.50 → $112.84 → $115.78 with final resistance near $120.69.

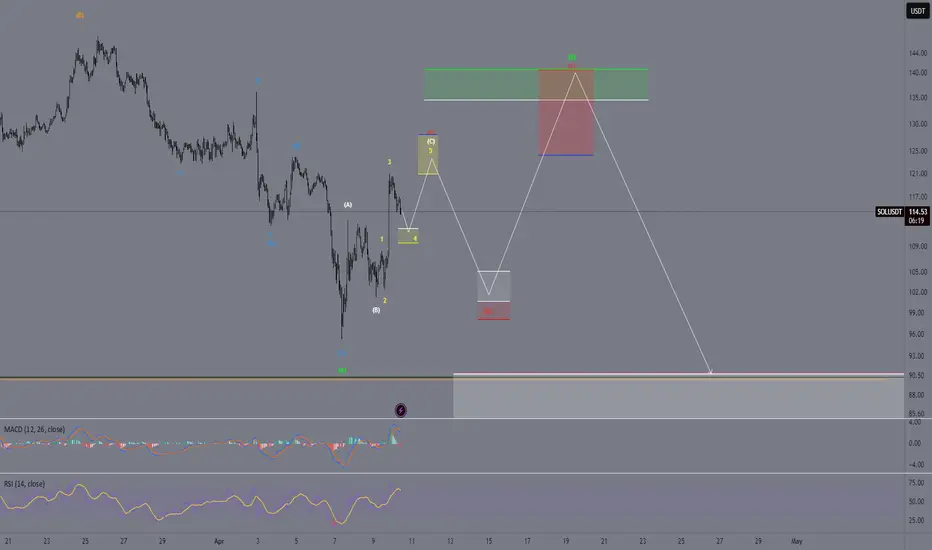
Elliott Wave Update – Clean Count DevelopmentBINANCE:SOLUSDT
We are currently tracking a developing (B) wave as part of a larger corrective structure.
The move up from the local low unfolds as a classic 5-wave impulse (yellow), where wave 3 is completed, wave 4 is forming as an A-B-C flat correction, and wave 5 is still expected to follow, completing wave (C) of (A).
After that, we anticipate a drop into wave (B) of the corrective sequence before a potential final push into the green target zone to complete wave (C) of (B).
Once this entire correction is done, the expectation remains for a larger 5-wave decline to complete the macro structure.
Wave count stays valid as long as internal rules of Elliott Wave Theory are respected.
$DAKU Set for A 50% Surge Amidst Bouncing From Support Point Der Daku ($DAKU) a token created and deployed on the Solana blockchain from the pump.fun platform has graduated from a bonding curve and transition to Raydium a DEX on the Solana ecosystem is set to break with an estimated 50% surge.
The asset is trying to find support in the $0.045 pivot. Should $DAKU consolidate from that point, a breakout is imminent without major CEX listings and a thriving community with about 19300 members on Telegram and about 1039 followers on X.
This Dog-themed memecoin on Solana ecosystem could be the next big thing with the RSI at 44.52 this only proffers more room for a breakout albeit the crypto market is highly volatile.
The $0.07 pivot is acting as a resistant point should buyers break above this point, $DAKU will be setting course for a new all time high price.

Elliott Wave Analysis – Focus on Wave StructureBINANCE:SOLUSDT
The current setup shows a completed green (A) wave, followed by a corrective (B) wave unfolding as an A-B-C structure.
Within wave (C) of (B), we can clearly identify a 5-wave impulse:
Wave 1 is complete
Wave 2 formed as a correction
Wave 3 extended strongly
Wave 4 is currently developing
Wave 5 is expected to complete wave (C) of (B)
Once this move finalizes, a larger downward (C) wave is anticipated to complete the overall corrective pattern.
This setup remains valid as long as the internal structure respects the rules of Elliott Wave Theory.
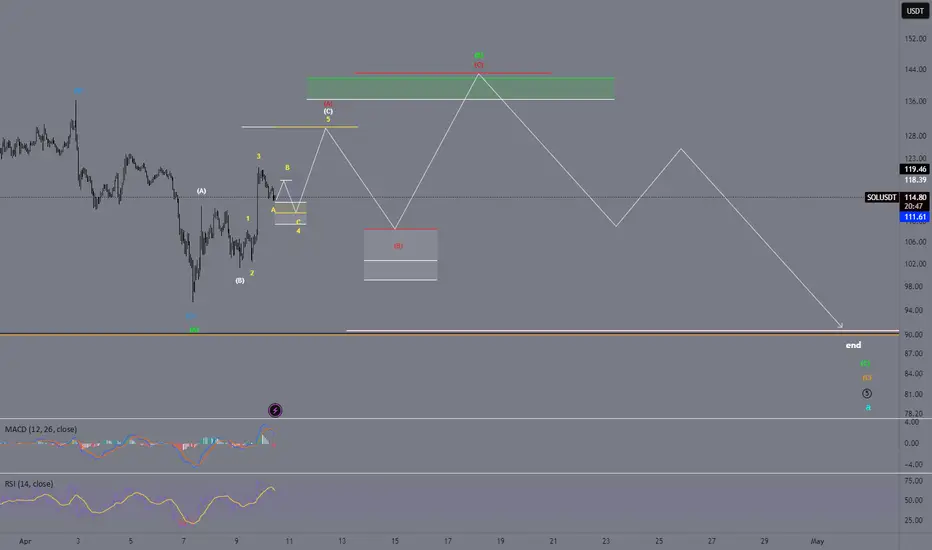
Elliott-Wellen Analyse 1-2-3-4-5 incomingBINANCE:SOLUSDT
🧠 Elliott Wave Analysis
🔍 Market Structure & Wave Count:
After a strong bearish impulse, the market completed a complex corrective (A)-(B)-(C) structure.
The recent move up appears to be wave (2) of a larger downward impulse and seems to have finished.
We are currently in the early stages of wave 3 to the downside, aiming for a full 5-wave structure (1-2-3-4-5) within wave (C).
The final wave 5 is expected to complete in the demand zone (gray box) around 90–95 USDT.
📉 Short-Term Bearish Target:
Target zone for the completion of wave (C)-(B) lies around 97 USDT.
📈 Next Bullish Move (Rebound Target):
After completing wave (C), a new upward move in the form of wave (A) is expected.
This bullish corrective wave could reach up to 115 USDT, completing a larger A-B-C structure.
📊 Indicators:
MACD shows weakening bullish momentum – potential confirmation for wave 3 downside continuation.
RSI is near the oversold zone (~27) – supporting the idea of a wave 5 bottom and a bullish reversal afterward.
🧭 Conclusion:
➡️ Focus is on a final move down to complete wave (C) around 90–95 USDT.
➡️ After that, a possible long setup is expected for a corrective rally.
➡️ Great setup for swing or scalp trades using Elliott Waves + demand zone confluence.

Solana vs. Ethereum: Why Investors Are Turning to Solana in 2025In recent months, a growing shift in sentiment has been observed among crypto investors: many are increasingly eyeing Solana (SOL) as a strong alternative to Ethereum (ETH). The comparison chart above, plotting Solana’s price action alongside Ethereum's, reveals that despite ETH retracing back to October 2023 levels, SOL is still holding higher support zones—a sign of relative strength and growing market confidence.
But why exactly is Solana capturing investor attention more than Ethereum in 2025? Let’s dive into the technical, fundamental, and sentiment-driven reasons behind this evolving preference.
___________________
📊 Technical Outlook: Solana Holding Strong
Ethereum (red line) has dropped back to its October 2023 price levels (~$1500), reflecting a broader altcoin weakness.
Solana, on the other hand, is still trading above $100, even though the macro market has turned bearish.
SOL has tested and respected the long-term ascending trendline that began in early 2023, while holding above a key horizontal support near $68–$82.
This divergence in structure suggests stronger buy-side interest and support zones forming on Solana, while Ethereum appears to be losing momentum.
___________________
🧬 Fundamental Comparison: Solana vs. Ethereum
Solana’s technical design gives it a speed and cost edge that appeals to users and developers building consumer-facing applications like NFTs, GameFi, and micro-transactions. Ethereum remains the institutional and DeFi heavyweight, but it’s starting to feel the pressure of competition in usability and scalability.
___________________
💬 Investor Sentiment: What’s Driving the Shift?
User Experience
Solana offers near-instant confirmation and negligible fees, making it ideal for gaming, NFTs, and mainstream use cases. Ethereum's scaling solution rollouts are still clunky and fragmented (Layer 2s like Arbitrum, Optimism, etc.), creating friction.
Vibrant Ecosystem Growth
Solana’s ecosystem is experiencing a boom in dApps, especially with high-profile launches like Jupiter, Marinade, and Phantom wallet integration. The mobile-first approach (Saga phone initiative) and deeper ties with consumer apps are also pushing adoption.
Performance During Market Pullbacks
As seen in the chart, SOL is showing relative strength during market corrections, indicating long-term accumulation rather than panic selling.
Narrative Momentum
The "ETH killer" narrative has found new life with Solana's resurgence. While Ethereum focuses on L2 scaling and abstract complexity, Solana is betting on a simpler, high-performance monolithic chain.

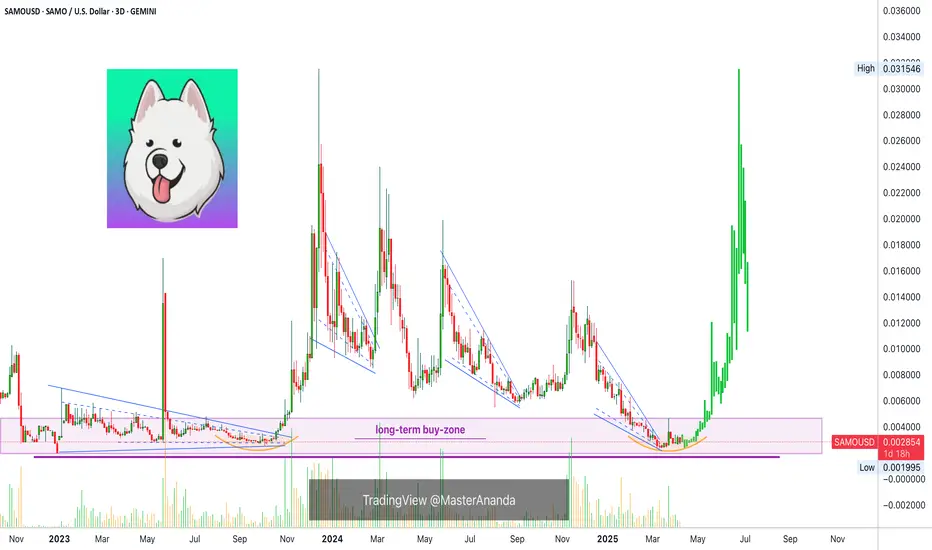
Samoyedcoin: Your Altcoin ChoiceSamoyedcoin (SAMOUSD) is trading within a long-term buy-zone with a long-term higher low. The market bottom was hit in December 2022 and the higher low comes now, March 2025.
The long-term buy-zone is marked with a purple box on the chart. This zone launched two bullish jumps. One a short move that was quickly erased, +490% within days, and the second one a bullish cycle with total growth reaching 1,165%.
The same level now can lead to an even bigger wave. Can be 2-3 times bigger. I am very optimistic and that is because I've been around Cryptocurrency for long. I know how the market works and I've seen how prices tend to go beyond expectations all the time.
Many people are new and have not experienced a bull market and so they have big doubts, this is understandable. They weren't around in 2021 and joined the market only after. Even three years in the market means no bull market experience. A bull market tends to produce new All-Time Highs all across.
Not only 2021 but we also have 2017 and 2013 and these were the same. Back in 2013 there weren't that many choices nor many exchanges but still growth was off the chart. In 2017 things were great but many of the coins were new. Still, the growth that happened was always in the same proportions as with every Crypto bull market, simply surprising.
This time it won't be different, we are set to experience something great. Even if the bull market is weak, we are going to see 10-30X growth on most pairs.
I thought this was a real project but it seems to be a doggy coin. Nothing changes, this pair can still be bought. For a long-term strategy and portfolio, we prefer actual cryptos, actual companies with an actual function and real products, but, if you like you can always buy for profits and to trade. Just know that having a real Altcoin makes for a completely different experience and you support the market along the way.
The SAMOUSD chart looks great. Buy-zone, accumulation phase. A great entry price. Can be approached with patience and a simple strategy. Timing is of the essence. If you are reading this now, you are literally looking at bottom prices. It doesn't get any better. After this period, a bottom tend to last between 2-3 months, we will be green and going up.
The best Cryptos are ones that are more decentralized and based on proof of work. Bitcoin is a great example. Its price says it all.
Namaste.
SOL Trade Plan: Daily Support, Liquidity Grab & Trade Idea.Solana (SOL) is currently navigating a challenging market environment, with broader sell-offs across the crypto space weighing heavily on its price action. On the daily and 4-hour timeframes, SOL has traded into a significant support zone, marked by previous swing lows. This area has historically acted as a magnet for buyers, but the recent dip below these levels suggests a liquidity grab is underway. This move has likely triggered sell stops sitting below the lows, creating the potential for a reversal as smart money steps in. ⚡
Zooming into the 15-minute timeframe, SOL is consolidating within a tight range, reflecting a period of indecision. This range-bound behavior often precedes a breakout, and a bullish break above the range could signal the start of a recovery. A shift in market structure—marked by higher highs and higher lows—would provide further confirmation of bullish intent.
Key Insights:
Daily Timeframe: SOL has dipped below key support levels, sweeping liquidity.
4-Hour Timeframe: Price is overextended, trading into a critical demand zone.
15-Minute Timeframe: Consolidation within a range, awaiting a breakout for directional clarity.
Trading Plan:
Patience is Key: Wait for SOL to break out of the 15-minute range to the upside. 🚀
Market Structure Confirmation: Look for a clear shift to bullish market structure (higher highs and higher lows). 📊
Entry Strategy: Enter long positions after confirmation, with a stop-loss placed below the range low. 🛡️
Profit Targets: Focus on resistance levels on the 4-hour and daily timeframes for potential take-profit zones. 🎯
Levels to Watch:
Support Zone: Previous daily swing lows, now acting as a liquidity zone.
Resistance Zone: The upper boundary of the 15-minute range and key levels on the 4-hour chart.
This setup highlights the importance of waiting for confirmation before entering a trade. While the liquidity grab below support is a promising signal, a breakout and bullish structure are essential to avoid false moves. As always, this is not financial advice—traders should conduct their own analysis and manage risk appropriately. ⚠️

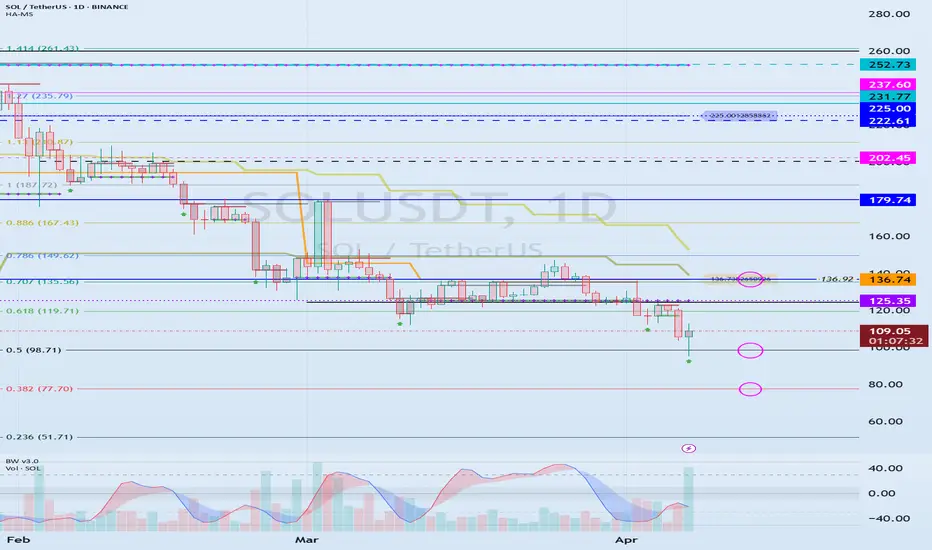
The key is whether it can rise to around 136.74
Hello, traders.
If you "Follow", you can always get new information quickly.
Please also click "Boost".
Have a nice day today.
-------------------------------------
(SOLUSDT 1M chart)
In terms of Fibonacci ratio, the key is whether it can rise after receiving support near 0.5 (98.71).
In order to continue the uptrend, the price must be maintained above the M-Signal indicator on the 1M chart.
Accordingly, we need to see whether it can rise above 136.92 and receive support.
If not, and it falls, you should go up again and check if it is supported near the Fibonacci ratio 0.5 (98.71) or if the HA-Low indicator on the 1M chart is generated, and then create a trading strategy.
-
(1D chart)
Therefore, if possible, it is more important to check if it is supported near the HA-Low indicator on the 1D chart, that is, near 136.74.
-
Fibonacci ratio 0.5 (98.71) should be interpreted as having an important meaning because it is in the middle of the overall chart.
Fibonacci ratio is a chart tool that helps with chart analysis, but it is not recommended to trade with it.
-
(30m chart)
The indicator that can create a trading strategy on my chart is the HA-Low, HA-High indicator.
Therefore, you can create a trading strategy by looking at the movement of the HA-Low, HA-High indicator formed on the time frame chart that you mainly view and trade.
-
Thank you for reading to the end.
I hope you have a successful trade.
--------------------------------------------------
- This is an explanation of the big picture.
I used TradingView's INDEX chart to check the entire range of BTC.
I rewrote it to update the previous chart while touching the Fibonacci ratio range of 1.902(101875.70) ~ 2(106275.10).
(Previous BTCUSD 12M chart)
Looking at the big picture, it seems to have been following a pattern since 2015.
In other words, it is a pattern that maintains a 3-year bull market and faces a 1-year bear market.
Accordingly, the bull market is expected to continue until 2025.
-
(Current BTCUSD 12M chart)
Based on the currently written Fibonacci ratio, it is displayed up to 3.618 (178910.15).
It is expected that it will not fall again below the Fibonacci ratio of 0.618 (44234.54).
(BTCUSDT 12M chart)
I think it is around 42283.58 when looking at the BTCUSDT chart.
-
I will explain it again with the BTCUSD chart.
The Fibonacci ratio ranges marked in the light green boxes, 1.902 (101875.70) ~ 2 (106275.10) and 3 (151166.97) ~ 3.14 (157451.83), are expected to be important support and resistance ranges.
In other words, it seems likely to act as a volume profile range.
Therefore, in order to break through this section upward, I think the point to watch is whether it can rise with support near the Fibonacci ratios of 1.618 (89126.41) and 2.618 (134018.28).
Therefore, the maximum rising section in 2025 is expected to be the 3 (151166.97) ~ 3.14 (157451.83) section.
To do that, we need to look at whether it can rise with support near 2.618 (134018.28).
If it falls after the bull market in 2025, we don't know how far it will fall, but considering the previous decline, we expect it to fall by about -60% to -70%.
So, if the decline starts near the Fibonacci ratio 3.14 (157451.83), it seems likely that it will fall to around Fibonacci 0.618 (44234.54).
I will explain more details when the downtrend starts.
------------------------------------------------------
Solana’s Critical Support at $120 - Will It Hold or Break?Solana has been respecting its $120 support level for over a year, consistently bouncing back every time it tested this zone. However, the price is now once again hovering around this crucial level after a small bounce a couple of weeks ago. The key question remains: will Solana hold this support and rally again, or is a major breakdown coming?
Weakening Support: A Bearish Signal?
When a price level is tested repeatedly, it often weakens as buyers at that level get exhausted. The most recent bounce from $120 was notably weak, indicating that buying pressure might be fading. This could be an early warning sign that sellers are gaining control, increasing the probability of a breakdown.
The $75 Scenario: What If Support Fails?
If Solana fails to hold $120, the next major support level sits around $75—a price zone where significant demand previously emerged. A breakdown could trigger a sharp move lower as stop-losses get triggered and bearish momentum accelerates.
Key Factors to Watch:
• Volume & Strength of the Current Test – Is buying volume picking up, or are sellers in control?
• Market Sentiment & Macro Trends – Broader crypto market trends, Bitcoin’s movement, and macroeconomic factors could influence Solana’s direction.
• False Breakouts & Traps – Sometimes, a brief break below support is a shakeout before a strong reversal. A reclaim of $120 after a breakdown could signal a bullish trap for shorts.
Final Thoughts
While $120 has been a strong floor for Solana, repeated tests make it more fragile. If buyers fail to step in with conviction, a drop toward $75 becomes a real possibility. However, if bulls defend this level strongly, we could see another bounce, potentially setting up a reversal.
Thanks for your support.
- Make sure to follow me so you don't miss out on the next analysis!
- Drop a like and leave a comment!
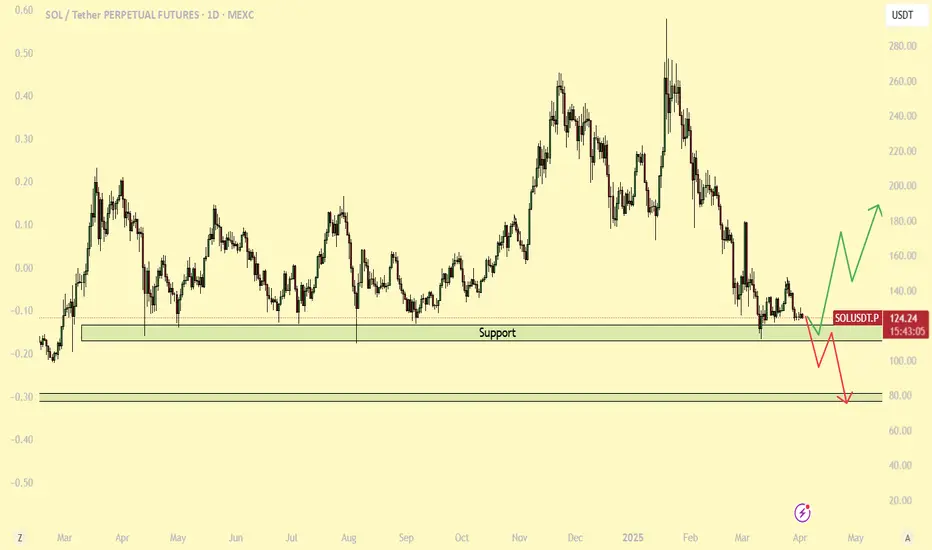
Crypto Sell-Off: Is Solana Headed for $80?Without a doubt, Solana was the hottest topic in the crypto market last year and at the start of this one—especially with the meme coin craze.
However, after peaking near $300, the price began to decline in what initially appeared to be a normal correction. But once Solana broke below the $200 mark, things turned ugly, and the price quickly dropped to the key $120 support zone—a level that held strong over the past year.
Now, it looks like Solana is on the verge of breaking below this support, which could trigger an acceleration toward $80, with the $100 psychological level as an intermediate stop.
________________________________________
Why the Downside is Likely to Continue
📉 Bulls Can’t Hold Gains – Short-term rallies are fading fast, showing a lack of real buying strength.
📉 Bearish Engulfing Candle – Yesterday’s price action printed a lower high, adding further pressure on support.
📉 $120 Breakdown Incoming? – If this level fails, expect a sharp decline toward $80.
________________________________________
Trading Plan: Selling Under $130
🔻 Sell Rallies Below $130 – Targeting a move to $80 in the medium term.
🔻 Only a Sustained Move Above $130 – Would shift Solana to a neutral stance—not bullish by any means.
For now, the bearish pressure remains, and selling rallies is the strategy to follow. 🚀

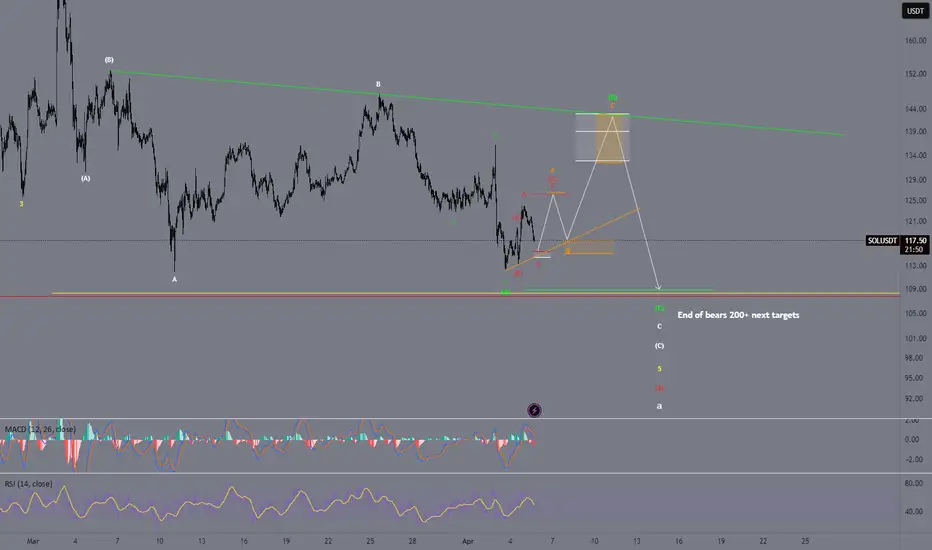
Elliott Wave Analysis on $SOLUSDT – ElliotWave count🟢 Current Wave Structure
The chart shows a complex corrective structure that fits well within the Elliott Wave principle:
We are currently in a larger ABC correction, with the green-labeled wave (C) likely approaching completion.
The most recent move down in green (C) may have marked the end of a broader corrective cycle.
The current movement looks like a short-term ABC correction in red – typical for a corrective bounce after a strong sell-off.
🟥 Short-Term Movement (Red Wave A-B-C)
Within the lower timeframe, we can see a corrective recovery forming a red A-B-C structure:
Wave A (red) has already completed,
Wave B (red) is currently forming (sideways or slightly lower),
Wave C (red) could result in a final push upwards towards the green descending trendline – targeting around 138–142 USDT – unfolding as an internal orange A-B-C.
🟩 Key Trendline (Green)
The green descending trendline has been respected multiple times and acts as strong technical resistance.
⚠️ Scenario: A rejection from this level is highly likely and would mark the end of the current relief rally – completing the larger green wave (B).
🟧 Short Entry Zone
The orange Fibonacci zone around 142 USDT marks an ideal short setup area.
This level is confluence of Fibonacci extensions and previous resistance.
⚪ What’s Next?
After the orange wave C finishes (completing green wave (B)), I expect an impulsive move to the downside – likely unfolding as a classic 1-2-3-4-5 wave within the green wave (C).
Target zones:
First zone: ~108 USDT (highlighted by green/yellow/red Fibonacci extension),
Final bear target: Possible deep wick below due to the high volatility and liquidity in that zone.
✅ Key Support Zone (Green / Yellow / Red)
Around 108 USDT, we find a strong confluence support – labeled as End of Bears.
This zone may act as a potential reversal point, possibly kicking off a new bullish cycle with long-term targets reaching 200+ USDT.
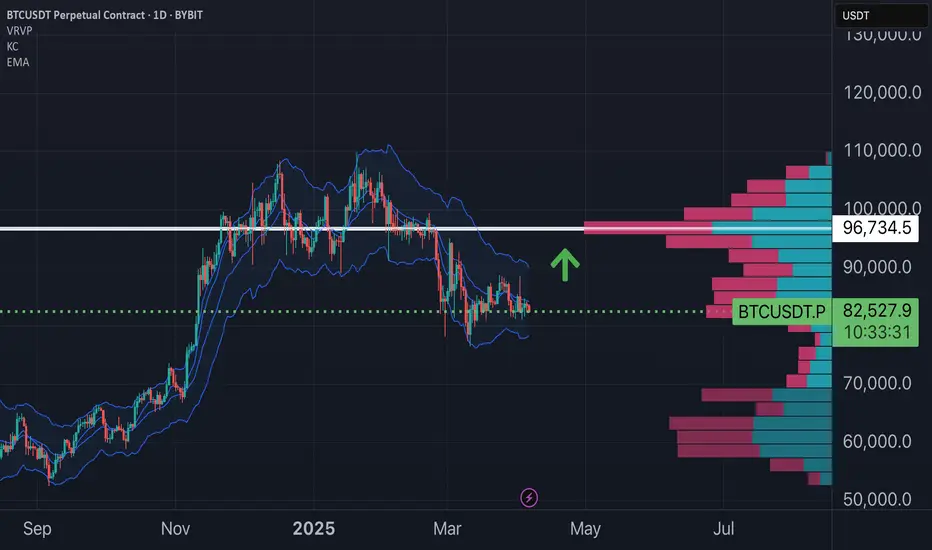
Bitcoin Eyeing 95K? Short-Term Momentum BuildsBitcoin has been showing strength recently, holding key support levels and hinting at a potential breakout. If bullish sentiment continues and macro conditions remain favorable, BTC could retest the $95K zone in the short term.
On the daily chart, we’re seeing higher highs and higher lows, with the RSI in a healthy range and moving averages trending upward. A clean break above the GETTEX:92K resistance could trigger a strong upward move.
Watch for volume confirmation and strong candle formations — this might be a solid opportunity for traders looking for short-term setups.
🚨 Always remember: proper risk management is just as important as the technicals.
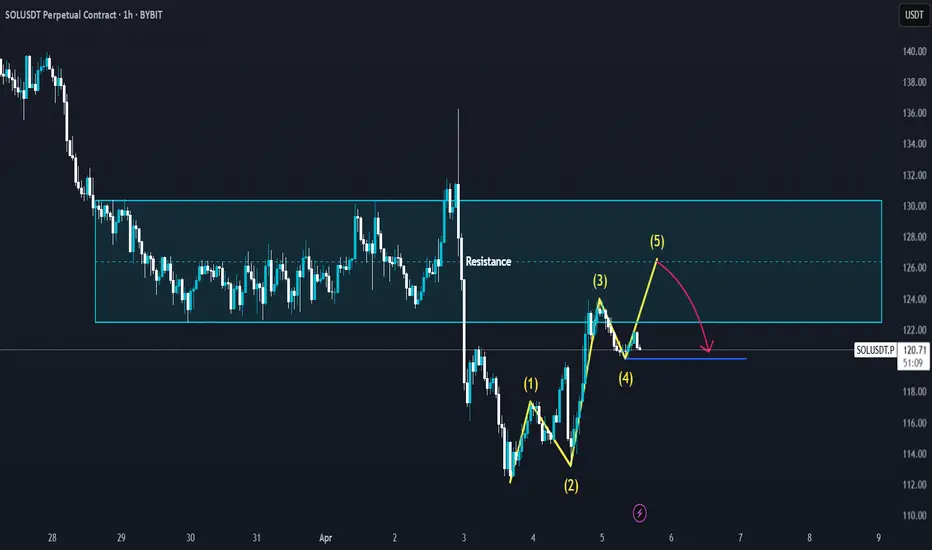
SOLUSDT - Wave 5 Completion into resistance zoneThis 1-hour chart of SOLUSDT (Solana Perpetual Contract) showcases a potential 5-wave Elliott impulse structure forming within a larger resistance zone.
- After breaking down from the highlighted resistance range (roughly $122–$129), SOL is currently retracing upward in what appears to be an impulsive 5-wave correction.
- Waves (1) through (4) seem to be in place, with Wave (5) projected to complete just below or near the resistance zone again.
- A potential bearish reversal is anticipated upon the completion of Wave (5), likely targeting support around the $120–$121 level.
Traders should monitor the price reaction near the $126–$128 region for rejection signals. A failure to break and hold above resistance could validate the short scenario, while a clean breakout could invalidate the bearish outlook and signal continuation.
Tight stop-loss management and confirmation through volume or momentum indicators are recommended before entering a trade.
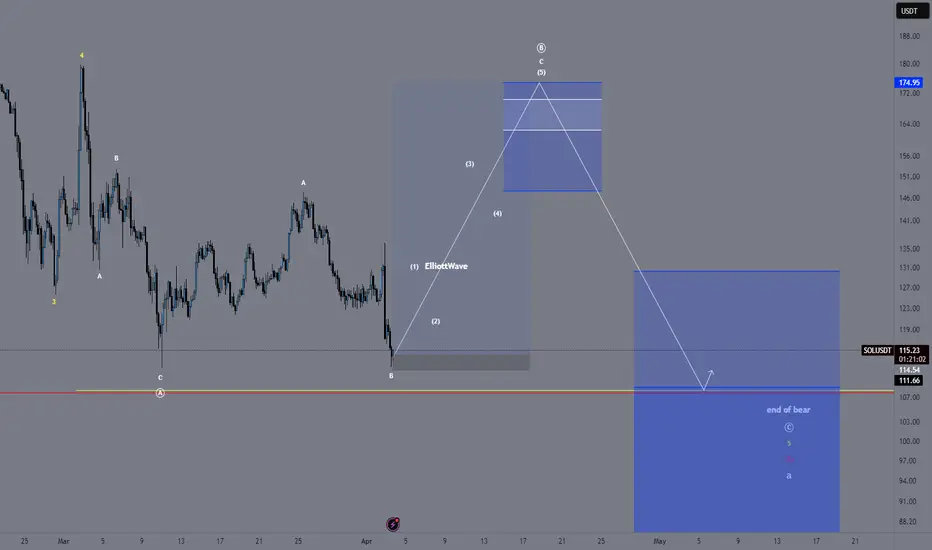
SOLUSDT | Elliott Wave Projection – Next big Move Incoming 50%+BINANCE:SOLUSDT
The chart is probably currently developing a five-wave impulsive structure (1)-(2)-(3)-(4)-(5), suggesting a potential bullish movement towards the 174-175 USD resistance zone before a larger correction unfolds.
📈 Bullish Setup:
- A corrective A-B-C structure seems complete, with a potential impulsive wave (1)-(5) forming.
- Price is reacting at a strong demand zone, initiating Wave (1) upwards.
- Possible target for Wave (5) lies near **174-175 USD**.
📉 Bearish Continuation Afterwards
- After reaching the projected high, expect a sharp rejection and reversal.
- The final bearish target lies within the "End of Bear" zone (~108-109 USD).
---
### 🔹 Key Levels to Watch:
✅ First Bullish Target: ~174-175 USD
⚠️ Critical Support Zone: 108-109 USD
---
### 📌 **Trading Plan:**
1️⃣ Long Opportunity: If price respects the current support, target Wave (3)-(5) completion near 174 USD.
2️⃣ Short Confirmation: If price rejects at resistance, a larger bearish wave is expected.
3️⃣ Final Bear Target: 108-109 USD zone for possible long-term support.
🚨 Risk Management:
- Stop-loss below 111 USD for longs.
- Wait for confirmation before shorting after rejection.
💬 What do you think? Will SOL hit 175 USD before the final drop? Comment below!
Solana - The Bullrun Is Not Over Yet!Solana ( CRYPTO:SOLUSD ) might create another move higher:
Click chart above to see the detailed analysis👆🏻
As we are speaking Solana is sitting at the exact same level as it was about 3.5 years ago in the end of 2021. In the meantime we saw a lot of volatility and Solana is now once again retesting a major previous support level. Despite the harsh recent drop, the bullrun remains valid to this day.
Levels to watch: $120, $250
Keep your long term vision,
Philip (BasicTrading)

Short Position SOL/USDT#Singal
SOL/USDT
🔴 Short Position
🎲 Entry1 @ 123.75
🎲 Entry2 @ 125.12
✅ Target1@ 121.79
✅ Target2 @ 119.93
✅ Target3 @ 116.55
✅ Target4 @ 112.38
✅ Target5 @ 103.78
❌ Stop Loss @ 132.32
Leverage: 5X
Margin: 10% of Wallet Balance
⚠️"Take Care of Risk Management for Your Account"
