Can we make it to 700 dollars for SolanaThis crypto has been so strong this bullmarket that I am not surprised seeing at least a 700 dollars target.
Solana

Solana (SOL) Price Technical Analysis - Nov, 2024Solana SOL, priced at currently ($256.83) picked up momentum after breaking out of $249 on Nov. 21st and hit a new all-time high above $264 on Nov. 22nd, breaking from the previous high from 2021.
The new all-time high is a bullish sign as it shows solid demand for the asset from the bulls. With no overhead resistance above the region now, a new high clears the path for further gains. If buyers maintain the price above $248, the SOL/USDT pair is likely to skyrocket to $300.

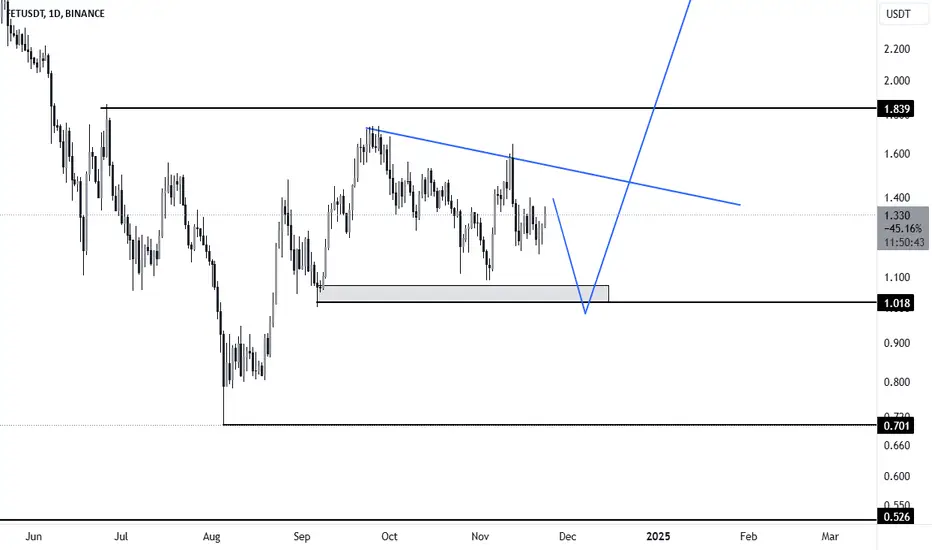
SOL looks bullish againsol seems to have completed a diametric correction as the g wave is dwarfed another bullish trend is expected to form.
By maintaining the green range, it can move towards the targets.
Closing a daily candle below the invalidation level will violate this analysis.
For risk management, please don't forget stop loss and capital management
When we reach the first target, save some profit and then change the stop to entry
Comment if you have any questions
Thank You

NOTHING !!Finally, the Cup&Handle broke .The price can reach the shown targets. That's it.
previous analysis
Give me some energy !!
✨We spend hours finding potential opportunities and writing useful ideas, we would be happy if you support us.
Best regards CobraVanguard.💚
_ _ _ _ __ _ _ _ _ _ _ _ _ _ _ _ _ _ _ _ _ _ _ _ _ _ _ _ _ _ _ _
✅Thank you, and for more ideas, hit ❤️Like❤️ and 🌟Follow🌟!
⚠️Things can change...
The markets are always changing and even with all these signals, the market changes tend to be strong and fast!!

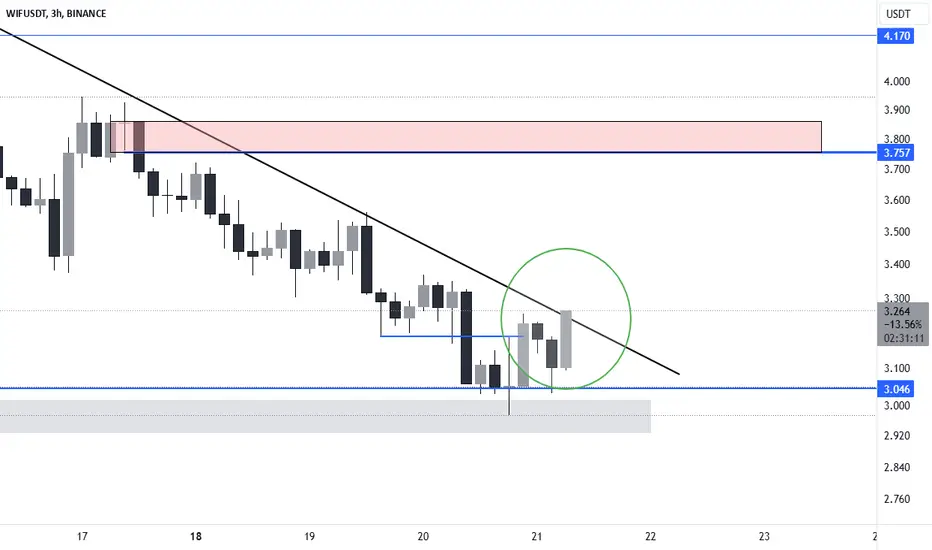
FETFET forming a bullish pennant, which should take the price above $2.
There are EMA resistance working on the trend on several time frames hence I believe it should return to its previous buy zone and hopefully take out the sell side liquidity
Follow me for more content
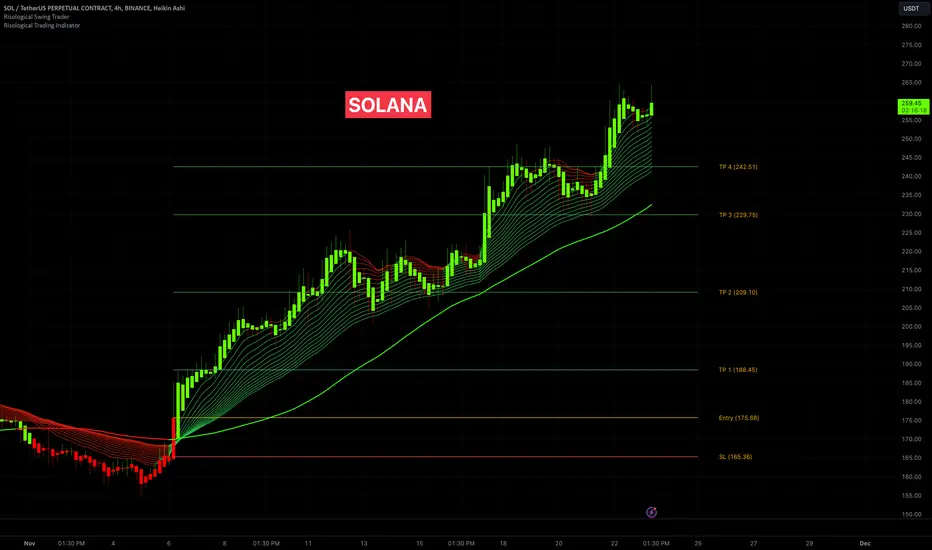
Solana (SOL): 430% Gain at 10x LeverageSolana (SOL) Trade Overview:
Solana (SOL) has delivered an incredible rally on the 4-hour timeframe. Using the Risological Swing Trader , the trade not only hit all predefined targets but exceeded expectations, achieving a 430% gain at 10x leverage.
Key Levels:
Entry Price: $175.68
Stop Loss (SL): $165.36
Take Profit Targets:
TP1: $188.45 ✅
TP2: $209.10 ✅
TP3: $229.75 ✅
TP4: $242.51 ✅
Analysis:
The Risological Lines perfectly highlighted a sustained bullish trend. Solana maintained its upward momentum, achieving rapid target hits. The Risological green lines provided a clear path for the trade's continuation, enabling traders to maximize their profits.
Outlook:
With all targets hit, Solana's trajectory remains strong. Traders may look for additional entries or secure profits as the bullish momentum shows no signs of slowing down. A well-executed trade like this emphasizes the power of Risological indicators for precision trading.
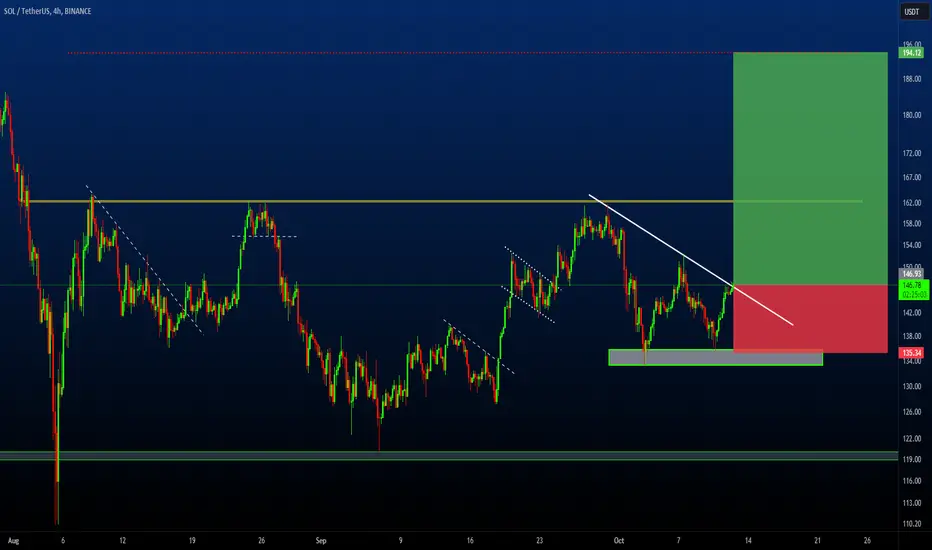
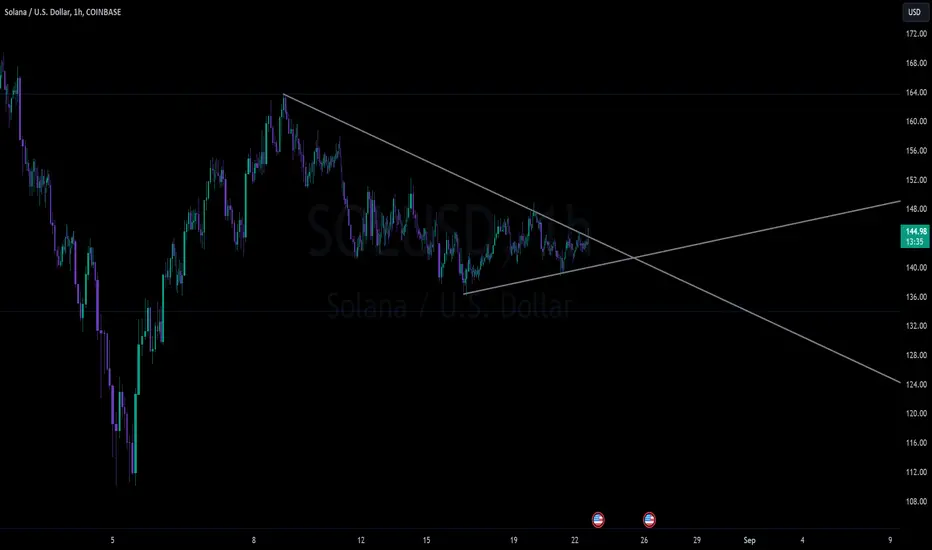
SOLUSDT: Bullish Momentum Building for a Potential All-Time HighSOLUSDT is demonstrating strong bullish potential after bouncing off a key support zone and breaking through a descending trendline. This breakout suggests a shift in momentum, indicating that we could see a significant upward movement in the near future. With the price gaining traction, traders should monitor the market for opportunities to enter positions as SOLUSDT approaches recent resistance levels.
To capitalize on this potential uptrend, consider placing entries on confirmed breakouts while managing risk with stop losses below the recent swing low. As bullish indicators align, the prospect of SOLUSDT reaching new all-time highs becomes increasingly likely. Stay vigilant, as this may be the beginning of an exciting phase for SOLUSDT traders!
SOLUSDT Currently trading at $146
Buy level: Above $146
Stop loss: Below $135
TP1: $152
TP2: $160
TP3: $175
TP4: $195
Max Leverage 3x
Follow Our Tradingview Account for More Technical Analysis Updates, | Like, Share and Comment Your thoughts
Understanding Solana: The Potential for Continued GrowthSolana's native cryptocurrency, SOL, has recently hit a new all-time high, sparking excitement and speculation among investors. This surge in price can be attributed to several factors, including the broader cryptocurrency market rally, increased institutional interest, and the growing popularity of Solana's blockchain network.
The Memecoin Mania Factor
One of the key drivers behind Solana's recent price surge has been the memecoin mania that has swept the cryptocurrency market. Solana has emerged as a popular platform for launching new memecoins, attracting significant trading volume and investor interest. The rapid growth of the memecoin ecosystem on Solana has led to increased demand for SOL, the network's native token.
Bitcoin's Influence
Bitcoin's recent price rally has also had a positive impact on Solana. As the dominant cryptocurrency, Bitcoin often sets the tone for the broader market. When Bitcoin's price rises, it tends to lift the prices of other cryptocurrencies, including Solana. This correlation between Bitcoin and Solana has contributed to SOL's recent upward momentum.
Increased Institutional Interest
Another factor driving Solana's price surge is the increasing interest from institutional investors. Many large financial institutions are now exploring opportunities in the cryptocurrency market, and Solana has emerged as a promising platform for building decentralized applications (dApps). Institutional investors' growing adoption of Solana could lead to further price appreciation in the long term.
Solana's Unique Value Proposition
Solana's unique value proposition, including its high throughput, low transaction fees, and fast block times, has attracted a significant developer community. The growing number of dApps being built on the Solana network has increased the demand for SOL, as it is used to pay transaction fees.
Potential Challenges and Risks
While Solana's future looks promising, it is important to acknowledge that the cryptocurrency market is highly volatile and subject to significant price swings. Several factors could potentially impact Solana's price, including regulatory uncertainty, network congestion, and competition from other blockchain platforms.
Additionally, the recent surge in Solana's price has raised concerns about the sustainability of its momentum. Some analysts believe that the current price levels may not be justified by the underlying fundamentals of the network. As such, investors should exercise caution and conduct thorough research before investing in Solana.
Conclusion
Solana's recent price surge has been impressive, but it is important to approach the future with a balanced perspective. While the long-term potential of Solana is significant, short-term price fluctuations are inevitable. Investors should focus on the underlying technology and the long-term growth prospects of the Solana ecosystem, rather than short-term price movements.
As Solana continues to attract developers, users, and institutional investors, it is likely to remain a major player in the cryptocurrency market. However, it is essential to manage risk and diversify investments to mitigate potential losses.
SOL / USD ConsolidationNeutral consolidation for a week heading into major economic data. Any sort of risk-on response from the overall market could lead to significant upside. However a breakdown could flush out a lot of bulls in quick fashion.
Upwards price targets of: 151, 158, 163, and 184+
Downwards price targets: 134, 110, 104
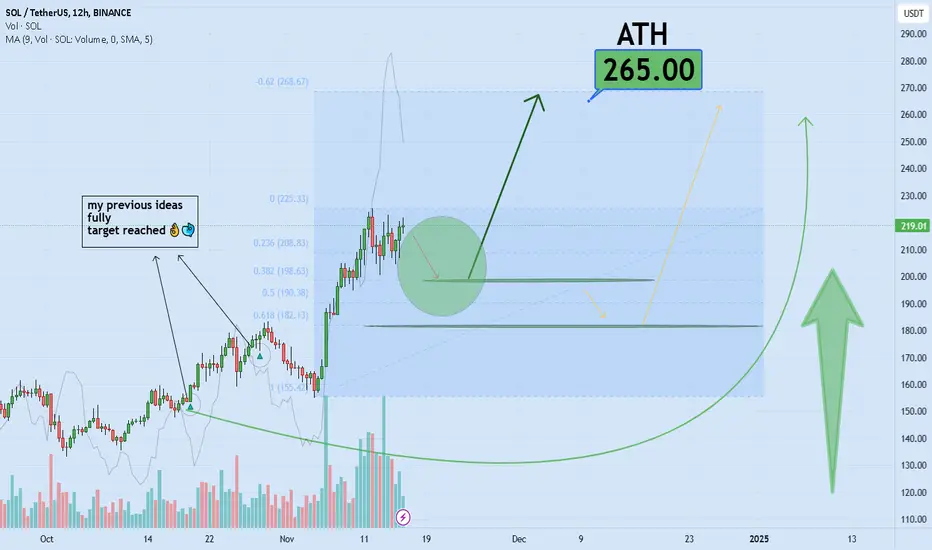
SOLANA ATH is near Hello and greetings to all the crypto enthusiasts, ✌
In several of my previous analyses, I have accurately identified and hit all of the gain targets. In this analysis, I aim to provide you with a comprehensive overview of the future price potential for SOLANA, 📚💣
The trading volume I am currently observing for this stock in the market is unparalleled compared to other coins or equities. This exceptional volume alone sets the stage for a potential explosive price movement toward significantly higher targets. 📚💡
Analyzing the chart, we have a primary scenario that features a period of temporary range-bound candles, underpinned by Fibonacci-based support levels. This setup clearly delineates the anticipated price trajectory in a simplified manner. 📚🙌
Should the primary scenario not hold, the price is expected to rebound upward from a lower Fibonacci indicator support level. 📚🎇
In essence, these support zones can be likened to invisible springs, poised to propel the price upward upon contact, reinforcing the upward momentum and potentially driving significant gains. 📚✌
🧨 Our team's main opinion is The exceptional trading volume in this stock suggests a potential explosive price surge, supported by Fibonacci levels that act like invisible springs, driving upward momentum. 🧨
Thank you for your attention. If you have any questions or comments, I’m here to respond to you. 🐋💡
SOL thesis with RAG AI by Titan_KarmaThe current market conditions for Solana (SOL) present a compelling opportunity for short-term trading, particularly given the recent positive sentiment surrounding the cryptocurrency. With no open positions currently, traders should consider entering a LONG position if market indicators align favorably. The recent news highlights a bullish sentiment towards SOL, especially in conjunction with the rising interest in related cryptocurrencies like Ripple (XRP) and meme coins such as Cutoshi. This broader market enthusiasm could provide the necessary momentum for SOL to continue its upward trajectory.
Financially, SOL is trading at $255.85 with a robust trading volume of approximately 3.87 million. The long-short ratio indicates a strong bullish sentiment, particularly in the 1d and 1h timeframes, where long positions significantly outnumber shorts. This trend suggests that traders are optimistic about SOL's price movement, reinforcing the potential for a profitable LONG position. However, it is crucial to remain vigilant for any signs of market reversal or increased short activity that could signal a shift in sentiment.
From a technical analysis perspective, the indicators present a mixed outlook. The daily RSI is above 70, indicating overbought conditions, while the hourly RSI is around 52, suggesting a neutral stance. The Stochastic indicators also reflect overbought conditions, which may lead to a pullback. The price is currently positioned below the daily EMA20 and SMA20, indicating potential resistance at these levels. Traders should closely monitor price action around these resistance points and be prepared to adjust their strategies accordingly.
Historically, SOL has demonstrated a significant upward trend, particularly from November 18 to November 22, where the price surged from approximately $242.51 to $260.13. This momentum, coupled with strong buying interest, suggests that entering a LONG position could be advantageous. However, caution is warranted due to the potential for pullbacks, and traders should implement appropriate stop-loss levels to manage risk effectively.
In terms of market sentiment, real-time data indicates a generally positive outlook for SOL, with many traders expressing optimism about its future performance. This sentiment aligns with the technical indicators and historical price movements, further supporting the case for a LONG position. Additionally, monitoring upcoming economic events or news releases will be essential to anticipate any abrupt market reactions that could impact SOL's price.
TRADE RECOMMENDATION
json { "OUTCOME": "OPEN_LONG", "STOP_LOSS": "$250.00", "TAKE_PROFIT": "$265.00", "CONFIDENCE_LEVEL": "80%", "EXIT_POINT": "$260.00", "ENTRY_CRITERIA": { "TIMEFRAME": "1h", "RSI": "below 70", "MACD": "above 0, 1h" }, "CURRENT_OPEN_LONG_POSITIONS": 0, "CURRENT_OPEN_SHORT_POSITIONS": 0 }

Solana (SOL) Hits New All-Time HighBreaking Records After Near Collapse
Solana ( CRYPTOCAP:SOL ) has achieved a remarkable milestone, surpassing its previous all-time high of $260. This new peak represents an extraordinary comeback from its low of $8 in late 2022 following the FTX collapse. The cryptocurrency market is buzzing with renewed optimism as Solana's trajectory mirrors the broader market resurgence, including Bitcoin's recent record highs.
Fundamental Drivers: Why SOL is Surging
1. Market Sentiment and Political Shifts
Solana’s resurgence coincides with major political developments in the U.S. The recent presidential victory of crypto-friendly candidate Donald Trump has infused fresh optimism into the crypto market. Additionally, the announcement of SEC Chairman Gary Gensler's resignation in early 2025 signals potential regulatory easing, which has boosted investor confidence across the crypto landscape.
2. Resilience and Technological Advancements
Solana's developers have worked diligently to address past issues, notably network downtimes. These improvements in stability, coupled with a strong focus on scalability, have restored faith in Solana's long-term potential. Solana Labs’ expansion into mobile hardware and decentralized apps has also contributed to this positive sentiment, reinforcing the ecosystem's robustness.
3. Alignment with Bitcoin’s Momentum
SOL's surge is closely aligned with Bitcoin's performance. As Bitcoin smashed past $98,000, Solana's price movement echoed this bullish trend, suggesting that institutional and retail investors are diversifying their portfolios within the crypto space.
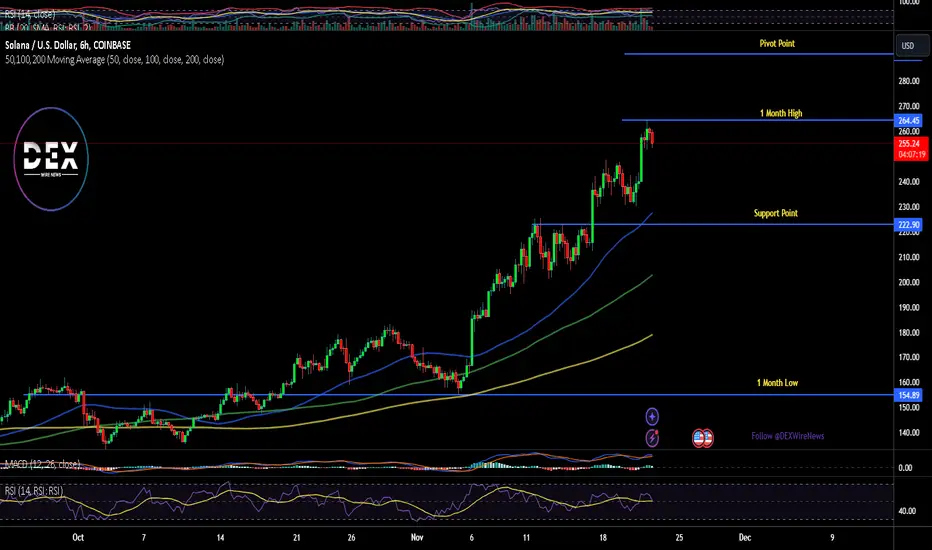
Technical Outlook
Despite a minor pullback of 0.5% at the time of writing, CRYPTOCAP:SOL remains in a bullish zone. Its Relative Strength Index (RSI) stands at 64, indicating strong upward momentum without being overbought.
Key Indicators:
- Support Level: $223, which served as a resistance-turned-support during the recent breakout.
- Resistance Zone: The next significant resistance is at $300, we are suggesting a potential run to $500 before the end of the year.
- Moving Averages (MAs): SOL trades well above key moving averages (50-day and 200-day), indicating strong bullish sentiment.
Future Outlook: Can SOL Reach $500?
Given its current momentum and broader market conditions, Solana's path to $500 seems increasingly plausible. The ecosystem's growth, strategic improvements, and favorable macro conditions provide a robust foundation for continued success. However, investors should watch for potential market corrections and external regulatory shifts.
Conclusion
Solana's rise to an all-time high underscores its resilience and the growing confidence in its ecosystem. With a bullish technical setup and strong fundamentals, CRYPTOCAP:SOL could potentially hit the $500 mark by Christmas, further solidifying its position as a leading blockchain contender.
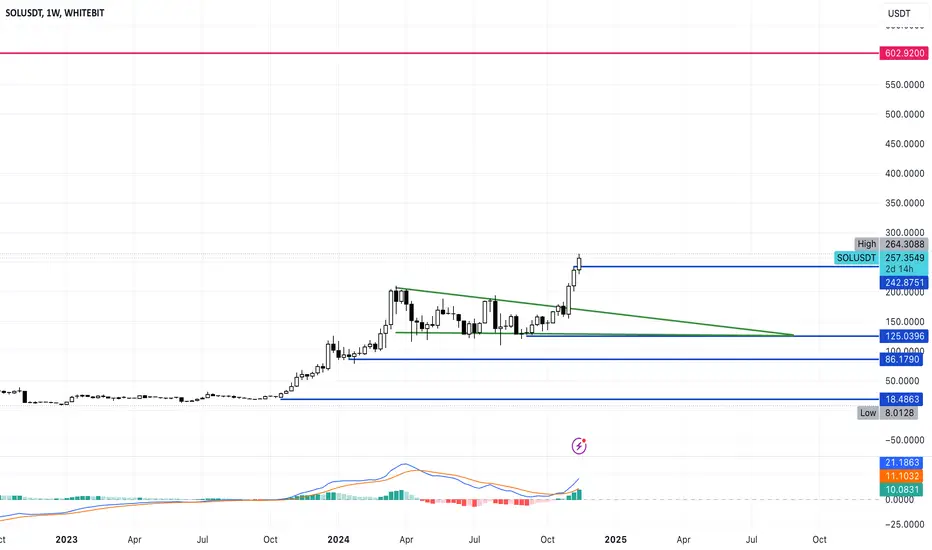
Solana hits new ATH of $264. Is $300 next?As Bitcoin surpasses the $99,000 mark, with a new all-time high of $99,314, Solana shares the momentum to hit a new ATH. With a 10% surge in the last 24 hours, the bull run in SOL price powers tailwinds for other altcoins.
In the weekly chart, the SOL price action showcases a descending triangle breakout rally, completing a cup and handle pattern. This pattern breakout with the neckline at the $249 mark has resulted in a new all-time high for Solana.
Currently, it is trading at $257, with a 24-hour high of $264. As the bullish trend continues, SOL price action is on the verge of completing the third consecutive bullish week.
As Solana is trading at uncharted levels, the underlying bullish momentum is teasing an uptrend continuation. Furthermore, with the broader market recovery at play and Bitcoin inching closer to the $100,000 mark, Solana is likely to hit the $300 mark.
What is more, MACD is also showing a strong bullish reading via positive crossover and a spike of bullish histograms.
Based on the Fibonacci levels, the upside price target for Solana is at $602.92. This price coincides with the 1.272 Fibonacci level on the logarithmic chart and makes $300 a potentially easy target.
On the flip side, a retest of the $250 breakout is possible if the buying pressure recedes.
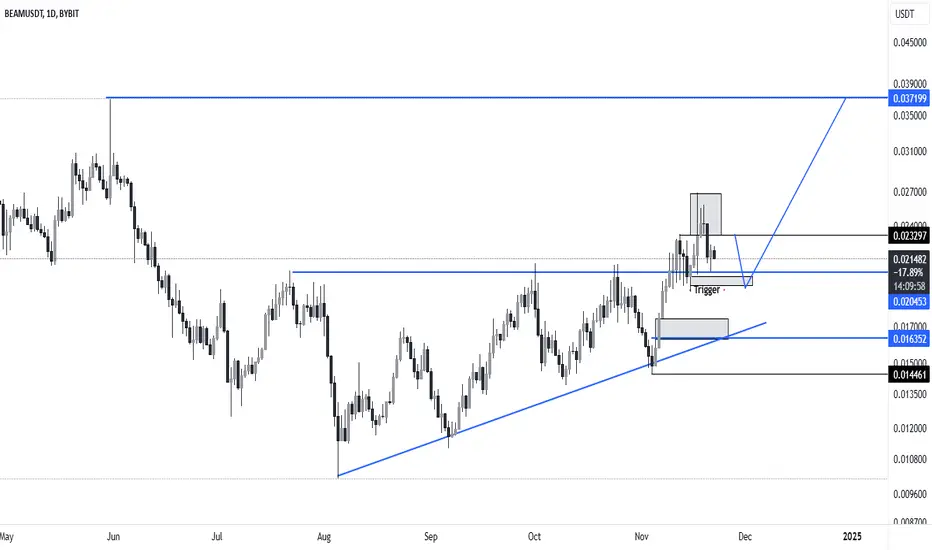
BeamTrend broken out from a consolidation and currently retesting support. Targets mentioned on the chart.
I would like it bounce back from 0.618 level that would seem like a great buy oppurutunity
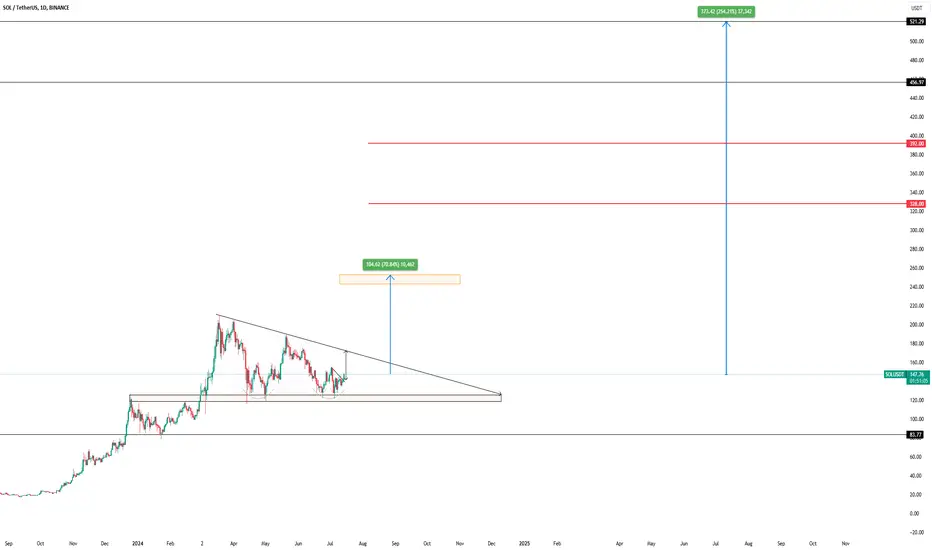
What is next for SOL?Hello everyone,
CRYPTOCAP:SOL has been one of the best-performing altcoins up to today.
According to the chart, what can we expect for CRYPTOCAP:SOL in the coming weeks?
Firstly, CRYPTOCAP:SOL is forming two patterns: a double bottom and a descending triangle, with a potential target hitting the previous all-time high (ATH) at $260.
After breaking the ATH, you can hold your CRYPTOCAP:SOL until $457-$521, which could become the new ATH this bull market. However, in a bull market, it's unpredictable, so if CRYPTOCAP:SOL trades successfully above $521, it could potentially make a historical run towards $3800-$4366.
CRYPTOCAP:SOL is one of the altcoins that you should definitely keep in your wallet.
The resistances on the way after the ATH are:
$328
$393
$457
$521 as a final target
Feel free to ask about anything.
Have a nice day.
Bullish SOLUSDTThe market is very bullish right now and that applies to SOLUSDT
I think this coin can easily to to 1000+ as ETH did back in 2017
A newer but increasingly popular coin
The whole market will move from the current BTC fever to ETH then to SOL and other coins like this.
Daily timeframe
$SOL Taps ATH at $260 !!!4 days later, and CRYPTOCAP:SOL taps its ATH at $260 🤑
Price Discovery here we come!
HIGHER 🚀

SOL/USDT 1D trade idea Solana has been one of the best performing majors so far this Bullrun, and has had one of the best reactions to the recent sell off.
The DAILY chart is an interesting one and clearly respects the range structure, currently the price has just rejected off the MIDPOINT and for me is an area of contention, there are some triggers i'd like to see and can take action on:
- Accumulation below the Midpoint before a break above putting in higher highs and higher lows when above. The target would then be range high with the 0.75 line as first TP.
- A new lower low and lower high on the LTF from now may signal a move lower, this could then find support at the 0.25 line which is also where the 1D 200EMA is and therefore good support.

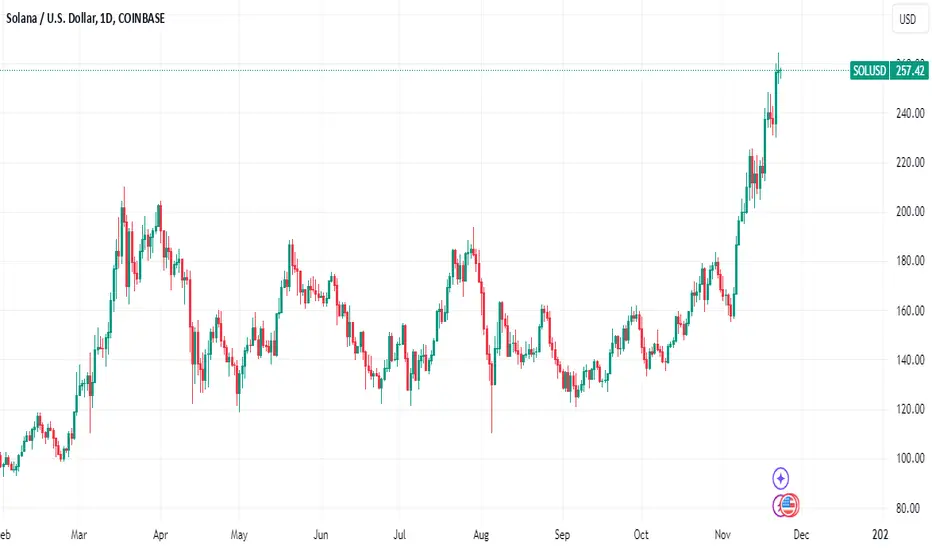
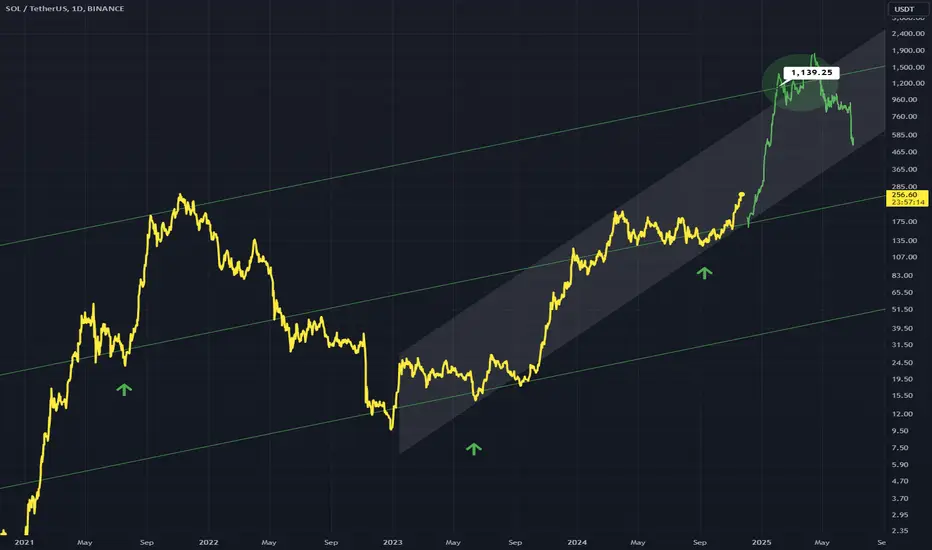
A close up of the solusd chartThe other version of this chart I posted was on the 1 month time frame so kinda zoomed out so I thought it would be fun to keep track of sol’s price action on the 1 day chart timeframe as well. I will link the 1 month version of the chart below. It’s currently steadily climbing its way to the first target. *not financial advice*

CRYPTO OWNERSHIP LEGAL IN CHINA = $NEO BULLISHA judge in a Singaporean court has ruled cryptocurrency ownership is now legal in China. What does this mean?
NEO is China's top cryptocurrency, also referred to as "Chinese Ethereum" with large stimulus recently been given to Chinese, and the fact the Crypto is now legal is China, we are about to see NEO wake up. I'm predicting an early classic cup and handle set up will come, and who knows where NEO will rise to.. $100? $250? $500? Who knows, but with China now legalizing crypto NASDAQ:NEO is about to go up to a whole different level, and I'm prepared... Are you?

BERT/USDT 1H Memecoin play with some strong numbers and community:
- FWB:69M MarketCap
- $42.5m 24h volume (61% Vol/Mcap)
- 100% of max supply (980M) in circulation. (Self-reported)
- Solana chain
Currently not yet listed on Binance or Coinbase but there are rumours that it may be listed soon which would bring a lot more potential buyers to the coin.
For memcoins technical analysis is less important but can still tell a story. The current range shows a clear resistance at 0.75 and a support at 0.25.
The diagonal resistance breakout coupled with the bullish divergence already printed indicating a bullish reversal the TA looks good currently.
Memes are risky and unpredictable so DYOR

SOLANA - Room for Further Bullish MoveSolana has broken the resistance and aiming for previous ATH. In coming days, we can expect above levels tapped.
For entries, please wait for at least two candle reversals at the specified level and apply appropriate risk management.
If you found this analysis helpful, please consider boosting and following for more updates.
Disclaimer: This content is for educational purposes only and should not be considered financial advice.