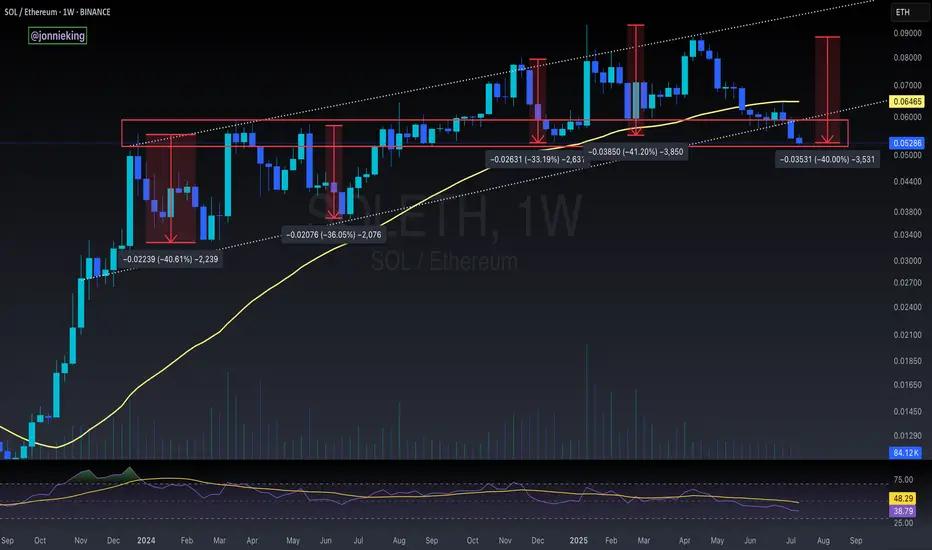
SOL / ETH at Critical Inflection PointSOL / ETH loses the 50WMA.
Has been trading below it for the past 7 weeks, something we haven't seen since 2021.
Has also broken down from the 8 month bull flag / parallel channel. Retesting the key POI I've been eyeing.
HOPIUM: We've seen great rallies after CRYPTOCAP:SOL goes down ~40% vs CRYPTOCAP:ETH , which it is at now. We SHOULD see a turnaround here soon.
And I still believe SOL will greatly outperform ETH this cycle, especially when the ETF launches and Alt Season kickstarts.
Right now we're seeing a typical market cycle BTC > ETH > Large Caps > Mid Caps > Micro Caps
Solana
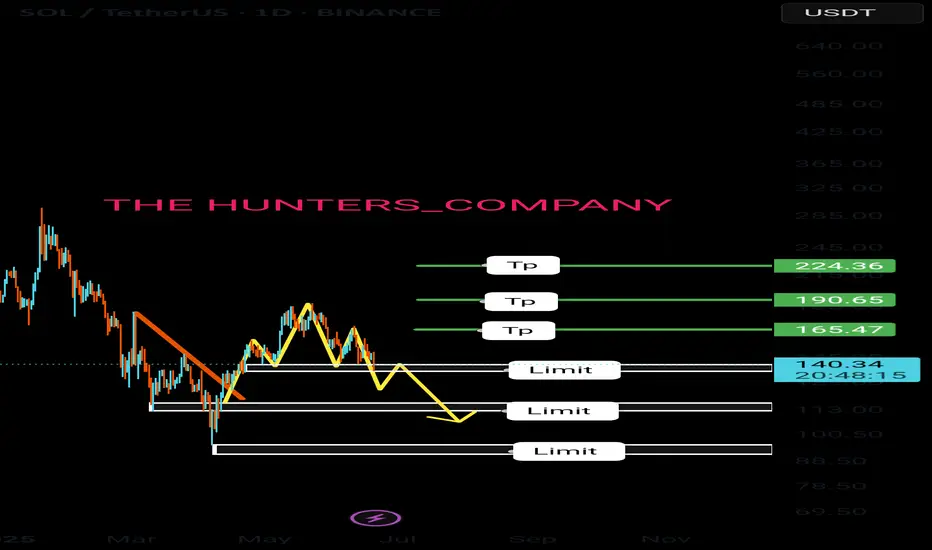
Solana:Daily free signalhello friends👋
As you can see, after the drop that we had, insider buyers showed and were able to support the price well.
But it was not enough, and as you can see, a noisy pattern has formed, which can indicate a further decrease in the price.
Now we can take advantage of this opportunity and make step-by-step purchases with risk and capital management in the support areas that we have obtained for you and move to the specified goals.
🔥Follow us for more signals🔥
*Trade safely with us*
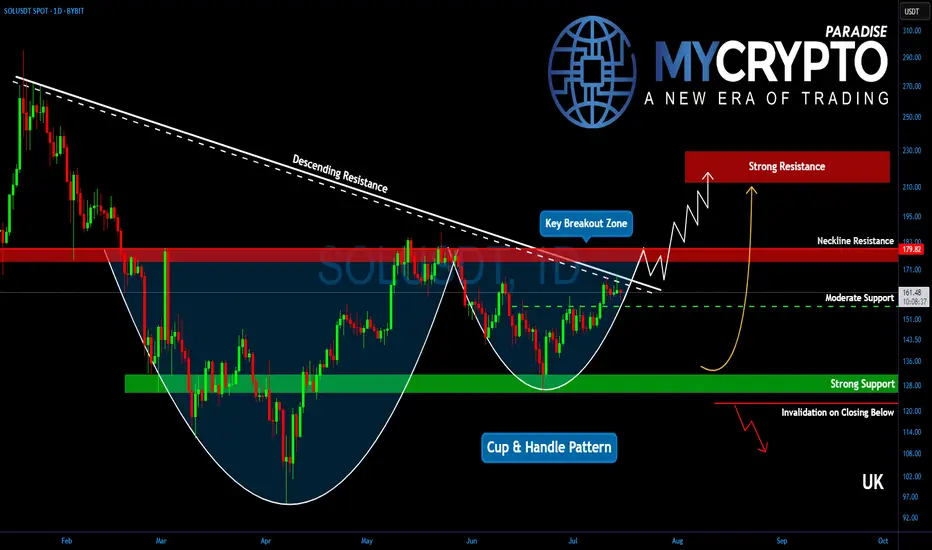
Will Solana Explode? This Important Zone Could Trigger a MoveYello, Paradisers! Is #Solana about to break free into a new bullish wave? After months of struggling under key resistance, the bulls are finally making a serious push… but only one zone stands between SOL and a potential explosion.
💎After peaking in January, Solana has remained suppressed under a descending trendline. But now, that trendline is being challenged aggressively, and the price structure is starting to form a reversal pattern that demands attention.
💎Right now, the most important level on the chart is the descending channel resistance at $167. Bulls are actively testing this zone, and if they manage to flip it into support, it could trigger a significant shift in momentum. But just above, at $180, sits an even more critical barrier, the neckline of the current reversal pattern. This entire region between $167 and $180 is the true battleground.
💎#SOLUSDT's confirmed breakout above $180 would be a major technical signal. It would likely send Solana toward the $210 to $225 zone, which marks a significant resistance area. This isn’t just psychological; it also aligns with the 61.8% Fibonacci retracement, a level where institutional players often begin offloading positions
💎As for the downside, support remains solid between $155 and $160. This region is protected by both horizontal demand and dynamic support from key moving averages, offering bulls a stable base to defend. Adding to the bullish case is a potential golden cross formation between the EMA-50 and EMA-200, a signal that, if confirmed, could inject even more confidence into Solana’s price action.
Paradisers, strive for consistency, not quick profits. Treat the market as a businessman, not as a gambler.
MyCryptoParadise
iFeel the success🌴
HolderStat┆SOLUSD above the $160 levelBINANCE:SOLUSDT has cleared key resistance at $159.78 after a series of consolidation patterns. The breakout has followed through into an ascending channel aiming at $185. Price remains structurally bullish with higher lows and strong recovery setups.

#SOL Update #4 – July 15, 2025#SOL Update #4 – July 15, 2025
Solana’s latest impulsive move failed to close significantly higher than the previous one. In fact, they closed at nearly the same level, which raises the risk of a potential double top pattern.
Looking at the current 4-hour chart, Solana seems to be nearing the end of this move. If the $157 support level breaks, it would likely indicate a transition from a bullish to a bearish structure on the 4H timeframe. The first target in such a breakdown would be around $154. If the $154 support fails to hold, the second target would be near $149.
Volume currently appears quite low, and the presence of long upper wicks adds further risk. Given the current conditions, Solana looks quite risky, and I do not recommend any trading positions—either buy or sell—at this time.

TradeCityPro | SOL Holds PRZ as Bulls Eye Range Breakout👋 Welcome to TradeCity Pro!
In this analysis, I want to review the SOL coin for you. This is one of the popular Layer1 projects, nicknamed the “Ethereum killer,” with a market cap of $85 billion, currently ranked 6 on CoinMarketCap.
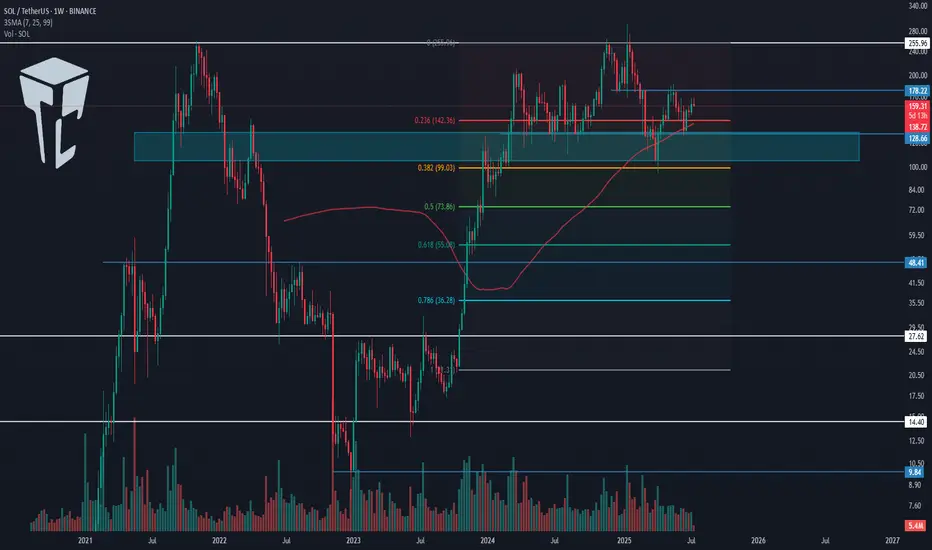
📅 Weekly timeframe
In the weekly timeframe, after the bankruptcy news related to FTX, this coin had a very sharp bearish move and even dropped to as low as 9.84, but it managed to recover afterward.
⭐ From the key top at 27.62, a very strong bullish move started, reaching up to 255.96 and retesting its previous ATH.
📊 Currently, a range box has formed between the 128.66 and 255.96 levels, where the bottom of this box is a very strong PRZ, created from the overlap of a major support zone and the area between the 0.236 and 0.382 Fibonacci levels.
🔍 Also, the price is being supported by the SMA99, which has supported the price twice so far and has prevented the box from breaking to the downside.
⚡️ If you have already bought SOL, you can set your stop-loss if the price closes below this area. A confirmed breakdown could lead to deep corrections toward lower Fibonacci levels.
🛒 For buying this coin, the first trigger is the break of 178.22, which is a bit riskier but offers a good price entry. On the other hand, if the price revisits 128.66 and gives confirmation, we can enter from there.
📈 However, the main trigger for spot entry is the breakout of the 255.96 top. Breaking this level can unlock some very ambitious targets. If that happens, I’ll definitely update the analysis and provide those targets.
📅 Daily timeframe
In this timeframe, we can see the price action in more detail. A small range box has formed between 144.11 and 164.74, and the price is currently stuck below the top of the box and reacting to it.
✨ If 164.74 breaks, we can enter a long position. The next major resistance is 183.54. A breakout above that will serve as the main confirmation for a long position targeting 255.96, which can also be used as a spot trigger.
💥 The RSI oscillator is now above the 50 zone, and if it enters the Overbuy area, it will serve as strong momentum confirmation for this position.
✅ If the price gets rejected from the top, we can also open short positions on lower timeframes. A break below 144.11 will be the main short trigger.
📝 Final Thoughts
This analysis reflects our opinions and is not financial advice.
Share your thoughts in the comments, and don’t forget to share this analysis with your friends! ❤️
Solana’s Breakout Setup is Loaded — Bullish Structure IntactSolana is pressing into key resistance after holding its higher low structure and climbing out of the golden pocket. With a breakout forming just under the descending trendline, bulls are watching for confirmation to ignite a move toward $220 — and potentially $290+.
Momentum is coiled, and the chart is clean. If price holds above $142, this could be the beginning of a multi-leg run.
#SOLUSD #SolanaBreakout #CryptoTrading #QuantTradingPro #BacktestYourEdge #TradingView #AltcoinSetup

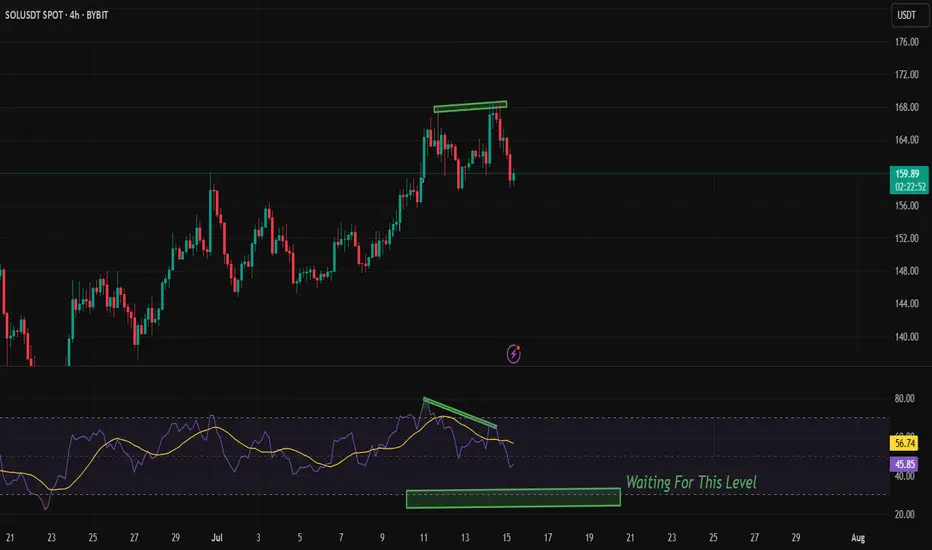
Bearish RSI Divergence on SOLUSDT (4H) – Patience Over FOMO!
🚨 Observing a clear Bearish RSI Divergence on the 4H chart for $BYBIT:SOLUSDT.
While the price made a higher high, the RSI showed a lower high, indicating weakening bullish momentum.
🟣 RSI is now trending down and currently around 46.
💡 I'm waiting for RSI to approach the 30 level (oversold zone) before considering a long entry.
🎯 No rush to buy — I prefer to wait for confirmation and a better risk-reward zone.
📅 Timeframe: 4H
📍 Plan: Waiting for RSI near 30
✅ Staying disciplined and avoiding emotional entries.
🧠 Let the setup come to you. Don’t chase the market.
SOL DOWN TO 146 ? Is this possible? Good evening trading family
Based on what we are seeing here is a typical correcting of any good bull mark needed to sustain our movement upwards. Currently we have spotted 3 levels down to the 146 marker with a these of a bullish move upwards if they hold.
Happy trading folks
Kris/ Mindbloome Exchange

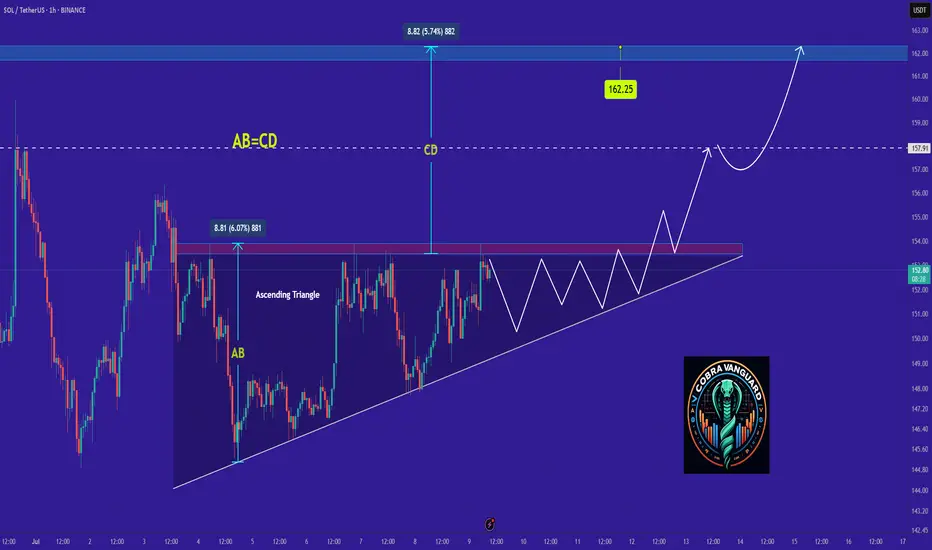
SOLANA's Situation, A Comprehensive Analysis (1h) !!!The price on the 1-hour timeframe is within an ascending triangle, which can be promising. If the price breaks this pattern with bullish candles, it could easily rise by the distance of AB=CD .
Best regards CobraVanguard.💚
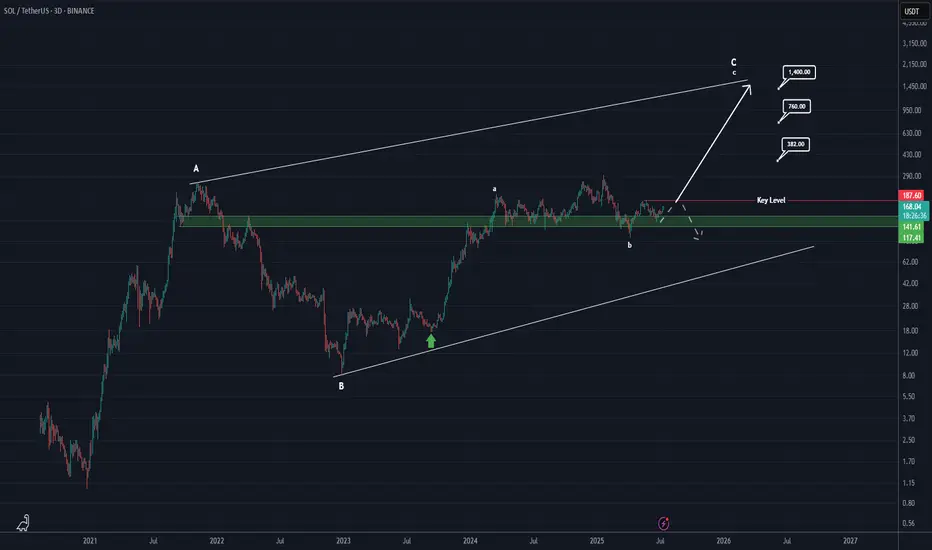
Will Solana reach $1400?After analyzing Solana’s complete data, it appears that a large diametric pattern is forming in the long term.
Currently, it seems we are in wave c of C.
If the key level of $187 is broken and price consolidates above it, we can be much more confident that we are indeed in wave c of C, confirming this scenario.
However, if the price fails to break and hold above $186 on higher timeframes like the 3D or weekly, and gets rejected downward, this scenario will be invalidated.
If confirmed, the targets for wave c of C are marked on the chart.
For risk management, please don't forget stop loss and capital management
When we reach the first target, save some profit and then change the stop to entry
Comment if you have any questions
Thank You
"Solana Heist in Progress! Will the Breakout Hold or Fake Out?"🔥🚨 "SOLANA HEIST ALERT: The Ultimate Bullish Raid Plan (Breakout or Fakeout?)" 🚨🔥
🌍👋 Greetings, Market Pirates & Profit Bandits!
(English, Spanish, Portuguese, French, German, Arabic—we speak MONEY.)
💎 STRATEGY BASED ON THIEF TRADING STYLE 💎
(High-risk, high-reward—steal the trend or get caught in consolidation!)
🎯 MISSION: SOL/USD (Solana vs. Dollar) CRYPTO HEIST
🐂 Direction: LONG (But watch for traps—cops & bears lurk nearby!)
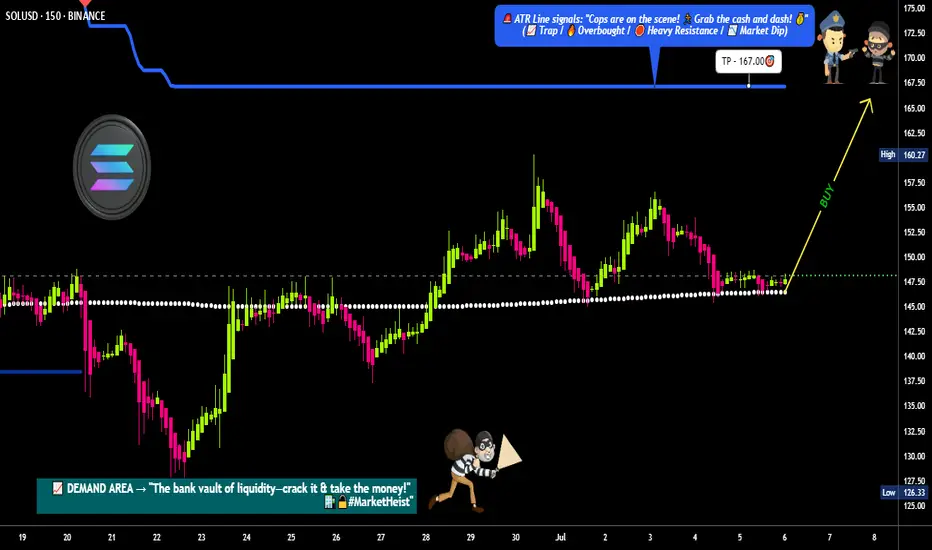
🚀 Escape Zone: ATR line (High-Risk Profit-Taking Area)
⚠️ Warning: Overbought? Reversal? Police line at resistance? TAKE PROFITS EARLY!
📈 ENTRY: "THE BREAKOUT HEIST BEGINS!"
Trigger: Wait for candle close ABOVE 148.50 (MA)
Alternative Entry: Buy stop above MA OR buy limit on pullback (15m-30m TF)
🛎️ SET AN ALERT! Don’t miss the breakout—thieves strike fast.
🛑 STOP LOSS: "DON’T GET CAUGHT!"
Thief SL: 136.00 (2H Previous structure Swing Low) (Adjust based on your risk & lot size!)
⚠️ Warning: If you ignore this, you’re gambling—your loss, not mine.
🎯 TARGET: "LOOT & BOUNCE!"
🎯 167.00 (or escape earlier if the trend weakens!)
🧨 Scalpers: Only play LONG—use trailing stops to lock in gains!
📢 NEWS & RISK WARNING
🚨 Avoid new trades during high-impact news! (Volatility kills heists.
🔒 Use trailing stops to protect profits if the market turns.
💥 BOOST THIS HEIST! (More boosts = more profit raids!)
👉 Like ✅ | Follow 🚀 | Share 🔄
💬 Comment your take—bullish or bearish trap?
🚀 Next heist coming soon… Stay tuned, bandits! 🤑
Projected Harmonic Extension Into Key Demand Zone (157–152 WatchMacro to Micro Context
SOL is currently reacting off a short-term distribution zone between 164 and 168 after an impulsive run-up from early July. While no complete harmonic has printed yet, the structure forming resembles a potential Bearish Gartley. The CD leg shown is not yet confirmed, but represents a projected path derived from the local point of value and volume geometry on the 2H chart. The area between 157 and 152 remains the primary zone of interest, given historical demand and high-volume node alignment.
Structural and Momentum Breakdown
XABCD Estimate:
XA was impulsive, AB retraced 53.2%, and BC retraced 63.8% of AB
CD projection is speculative, drawn from the confluence of the BC extension (1.757), 0.786 retrace of XA, and the local value zone around 157.5–152
Volume Profile: Substantial volume shelf aligns with projected CD completion. Above 164, volume thins out sharply, indicating inefficiency and risk of rejection
Order Blocks: 2H bullish OB from July 1–3 sits directly inside the 157–152 range, adding further structural validity to this projected leg
Momentum Signals:
RSI is stalling below mid-band (50–60), suggesting loss of buyer momentum
Price Volume Trend (PVT) shows deceleration post-surge, potentially preceding distribution
Bollinger Bands are compressing, which often leads to volatility re-expansion following trend exhaustion
Trade Plan
At this stage, the CD leg remains a hypothesis based on value structure and harmonic geometry. The trade plan focuses on preparing for potential long entries if price moves into the estimated completion zone with supportive signals.
Watch Zone for Long Setup: 157.5 to 152.5
Invalidation: Clean break below 147 suggests breakdown and invalidates harmonic idea
Take-Profit Targets on Reversal:
TP1: 161.5 to 163.0
TP2: 165.5 to 168.0
Required Confirmation:
Bullish divergence on RSI or PVT bounce
Reclaim of 2H order block zone with impulse and follow-through

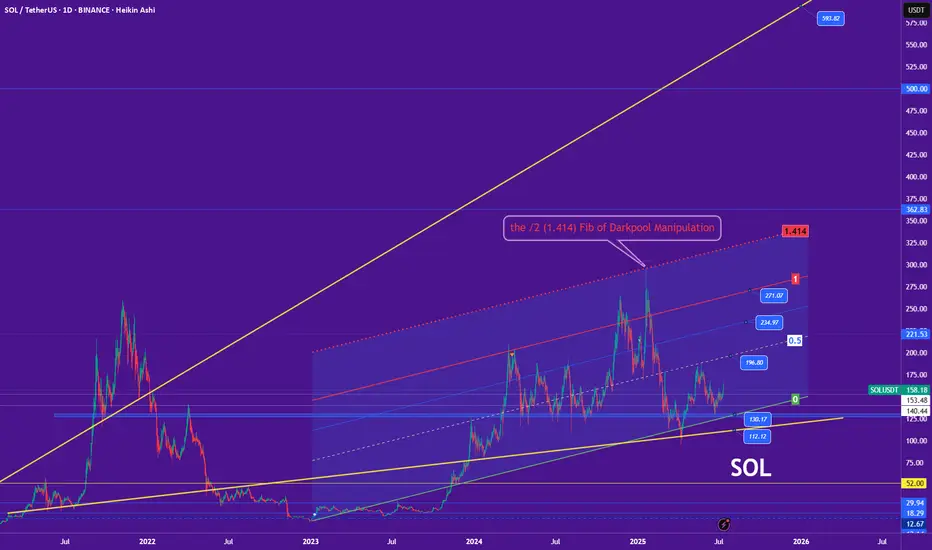
The 1.414 Fib – Smart Money’s Darkpool Fib📐💸 The 1.414 Fib – Smart Money’s Darkpool Fib 🔍🧠
Let’s talk about the 1.414 Fibonacci extension — also known as √2 — a subtle but deadly precise level that smart money uses to trap retail.
We saw this play out perfectly on Solana.
That ~$295 zone (close to 300$ but 'no cigar') ?
That was the 1.414 Fib , and it nailed the top before a brutal reversal — a textbook darkpool distribution move.
But Solana wasn’t alone.
🔁 This Isn't Just About SOL
The 1.414 (√2) level has repeated across the crypto market , quietly acting as a marker for institutional exit zones:
📉 It showed up on multiple altcoins in December 2024, just before the entire altcoin rejection
🟠 It’s even been visible recently on Bitcoin itself — yes, even the king of crypto respects this level
So no — this isn’t random. This level has a story to tell.
🤖 Why 1.414 Matters
Most retail traders fixate on the golden ratio: 1.618.
But the 1.414 (√2) is just as important — and arguably more manipulative.
It allows institutions to:
- Front-run major Fibs
- Exit quietly
- Trap late bulls
It’s less obvious, less crowded, and often more effective.
That’s why I call it the "Darkpool Fib."
💔 Why I’m Divorcing Altcoins — But Not Yet
Solana’s chart — and its story — are symbolic of a deeper shift in me as a trader.
I’ve made the decision: at the end of this cycle , I’ll be divorcing altcoins.
Not out of hate — but out of clarity. I won’t “believe” in them anymore. I’ll just trade them.
But let’s be clear:
That moment isn’t now.
Right now, I’m still bullish. I still see opportunity. I’m here to ride the structure — while it’s still giving, or at least going to give something back.
📍Take Solana...
🔹 It was built on Rust, a language praised for speed and performance — perfect for high-throughput, data-heavy blockchain architecture
🔹 It could have been the chain that led us into the future
🔹 Instead, it’s become a memecoin playground , with repeated outages and centralized concerns
I don’t hate it. I just don’t believe in it the way I used to.
Narratives die. Structure doesn’t.
So yes — I’m trading SOL. I respect its levels. But I’ve let go of the idea that it will “change the game.”
I’ll trade the rally. I won’t marry the story.
📊 The Technical Setup
[📍 Support Zone: $153.48 $140.44
Below that, deeper support at $130.17 and $112.12
📍 Current Price: ~$158
📍 Upside Targets:
Minor: $196.80
Mid-channel: $221.53
Structural resistance: $234.97
Upper red trendline: $271.07
Final Extension: ~$325–$362
Potential: 271$, 362$, 490$(close but no cigar of the 500$ mark), 593$ technically is the ultimate resistance.
If Solana reclaims its momentum, this setup gives plenty of upside. But let’s be surgical. We are traders first.
⚠️ Final Thought
We’re in the phase of the cycle where hope is expensive.
Structure is free — if you choose to follow it.
Buy over support
Exit near resistance
Trade the level — not the label
One Love,
The FXPROFESSOR 💙
Disclosure: I am happy to be part of the Trade Nation's Influencer program and receive a monthly fee for using their TradingView charts in my analysis. Awesome broker, where the trader really comes first! 🌟🤝📈
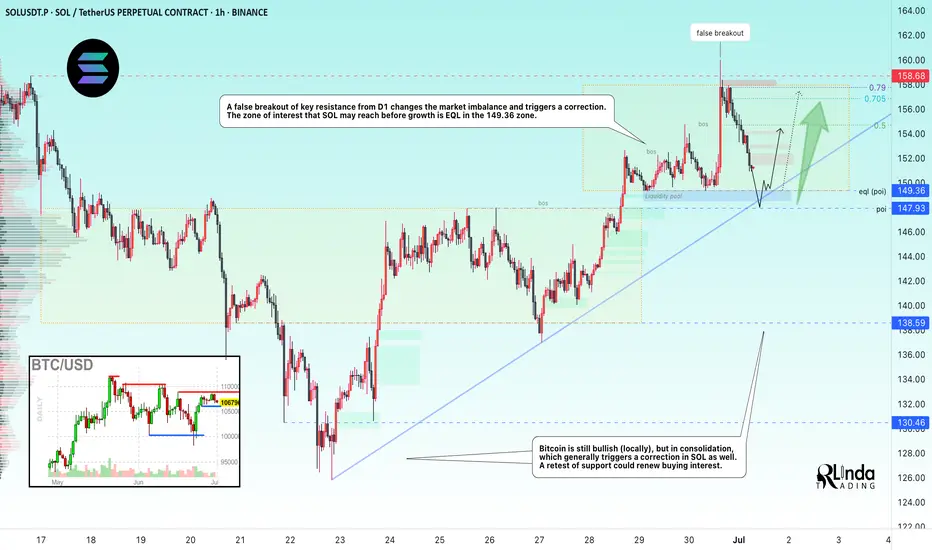
SOLUSDT → Countertrend correction and hunt for liquidityBINANCE:SOLUSDT looks quite promising on the bullish side. The price is testing one of the key resistance levels within the local trend rally. A correction is forming. Is it beneficial for us?
On the higher timeframe, we see a change in character, a breakout of the trend resistance, and the formation of an upward trend support line. Bitcoin is still bullish (locally) at this time, but it is consolidating, which generally provokes a correction in SOL as well. Focus on the 150-149 area. If the bulls are able to keep the price above this zone after the retest, followed by the formation of momentum, this can be considered a positive medium-term sign.
Locally, the price within the trading range of 149.36 - 158 is heading towards the area of interest and liquidity (eql) at 149.36. The current sell-off is most likely triggered by a large player seeking a more favorable entry into the market.
Resistance levels: 154.75, 156.8
Support levels: 149.36, 147.93
In the current situation, it makes the most sense to consider an intraday trading strategy. A countertrend correction and a retest of support could attract buyers...
Best regards, R. Linda!
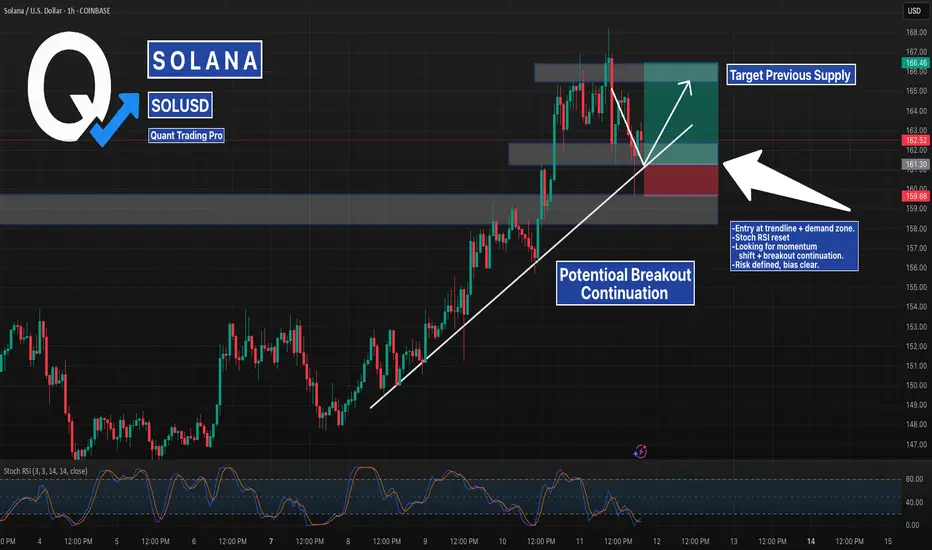
Solana Bounce Setup – Trendline + Demand Zone ConfluenceSOL is testing a confluence zone between rising trendline support and a key demand block around $161–$162. This zone has acted as a springboard for the last leg up and now overlaps with a full Stoch RSI reset on the 1H timeframe.
If price holds this structure, a continuation toward the previous supply zone at ~$166 is in play. Breakdown below $159.68 would invalidate the setup.
📉 SL: Below structural low
📈 TP: Prior high / liquidity zone
📊 Watching candle structure for entry confirmation
#SOLUSD #Solana #PriceAction #TrendlineSupport #CryptoSetup #QuantTradingPro #TradingView
Boomers buying Ethereum not SolanaRatio has broken a head and shoulders
Stablecoin supercycle
Tom Lee
SBET
ETH treasury #fomo

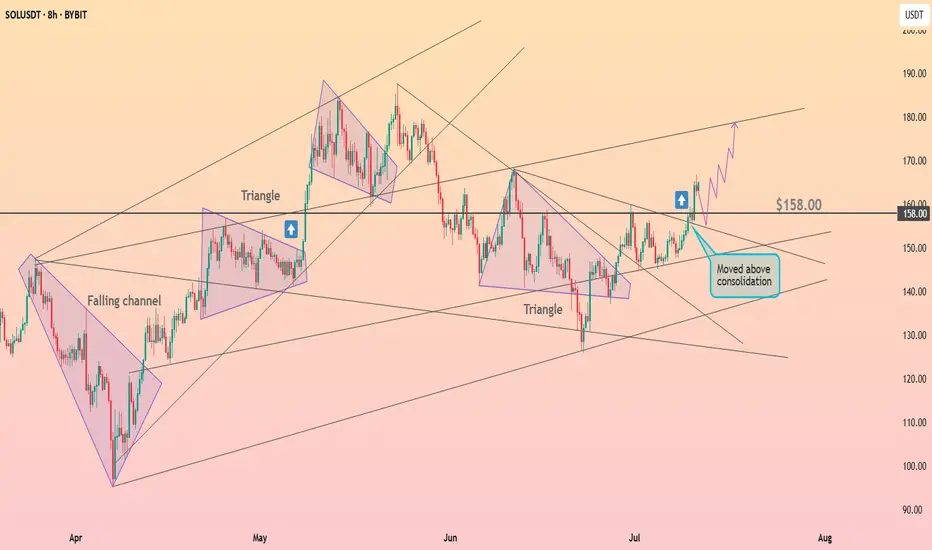
HolderStat┆SOLUSD above the $158 levelBYBIT:SOLUSDT broke through the $158 consolidation resistance following a strong triangle breakout. This confirmation shift puts the $180 resistance level within reach. The market structure continues to print higher lows, suggesting an ongoing bullish trend.
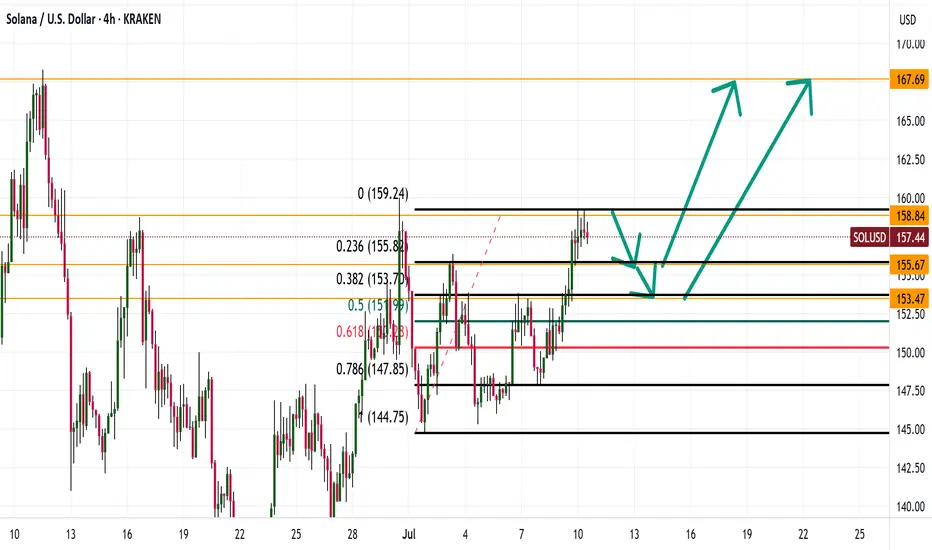
SOL TO 167?Good morning folks
so it looks like we are correcting down possibly down to 153 then seeing a drive up to 167. What are your thoughts on the market for Solana
Looks like things are heating up for Solana
Kris/Mindbloome Exchange
Trade Smarter Live Better
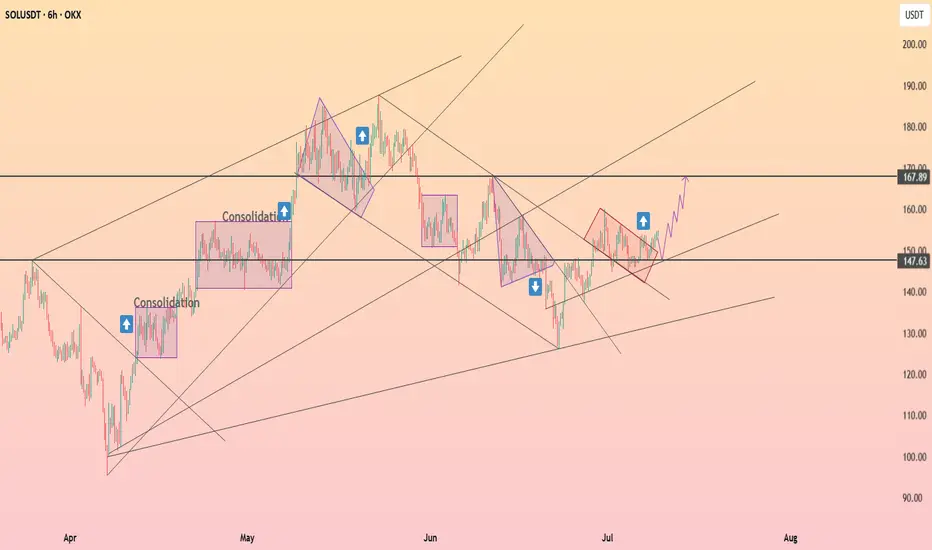
HolderStat┆SOLUSD held the support lineOKX:SOLUSDT is consolidating above 147.63 inside a rising channel. Bullish continuation is likely, with 167.89 acting as the next key resistance. Historical patterns suggest a breakout is forming.
BTC / ETH / SOL / XRP / HYPE: Potential Trend StructuresIn this video, I share my current daily and weekly analysis on the trend structures of BTC, ETH, SOL, XRP, and HYPE, highlighting key support and resistance zones to watch in the coming sessions.
Charts featured in the video:
BTC
ETH
SOL
XRP
HYPE
Thank you for your attention and I wish you successful trading decisions!
If you’d like to hear my take on any other coin you’re tracking feel free to ask in the comments (just don’t forget to boost the idea first 😉).

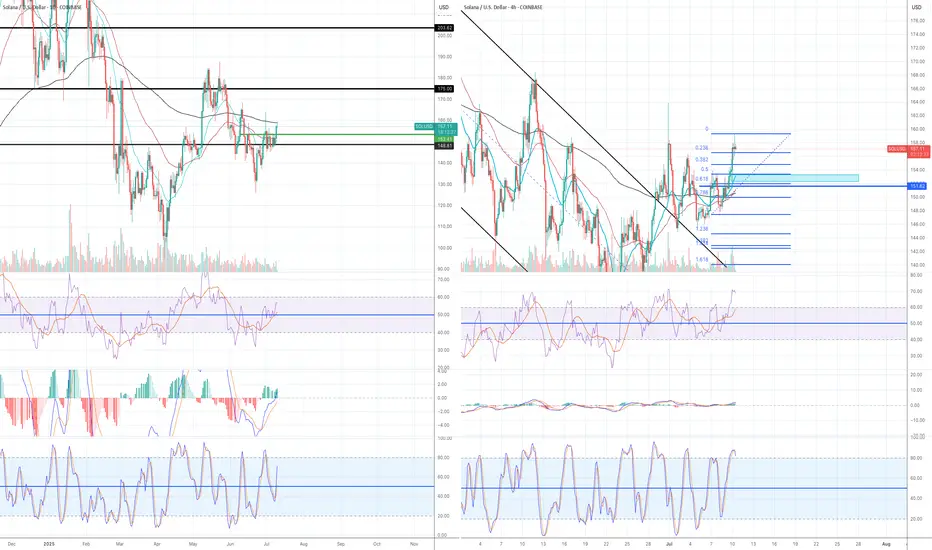
LONG - I am going to add more position when this happensI currently have a small size of long position but I am planning to add more (please see my previous article for my first trade set up), but I am waiting for a certain set up to come up:
Daily:
1) all momentum indicators are entering the bull zone, so there is a plenty of room to move to the upside.
2) The candle has crossed and closed above both EMA 21 and 55, but EMA 200 is currently working as a resistance.
3) EMAs have not crossed and lined up for the bull trend - 21> 55> 200
4H:
1) EMA55 has finally crossed above EMA200!! But when they cross, the price very often has a decent pull back before taking off.
2) Stochastic and RSI are already in the overbought territory which tells me the pull back is likely to happen.
The chart is looking really good for the bull but I am going to wait for the price to retrace to Fib0.5-0.618 zone (see blue rectangular box in 4h chart).
If the price rebounces from that zone and momentum indicators reset to move to the upside, I am prepared to go big on long.
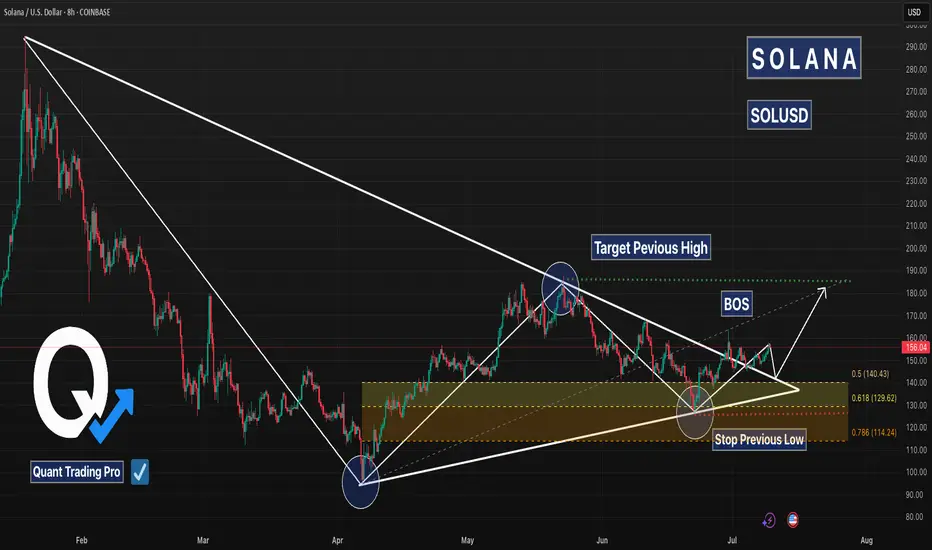
SOL Triangle Breakout + Fib Confluence – Aiming for $190+Solana (SOLUSD) just broke out of a multi-month triangle on the 8H chart, signaling a potential reversal and continuation toward previous highs.
Key Highlights:
🔹 Break of Structure (BOS): Price broke through descending resistance, flipping momentum in the bulls’ favor.
🔹 Fibonacci Confluence: Bounce came cleanly from the 0.5–0.618 zone ($129–$140), adding high-probability support.
🔹 Triangle Apex Break: Consolidation is over — the arrow is launched.
🔹 Targeting Previous Highs: $185–$190 range is in sight, with historical resistance marked.
🔹 Risk Defined: Stop idea near the previous low and triangle base (~$115).
⚠️ Watch for confirmation candle closes and volume follow-through — the move is just beginning.