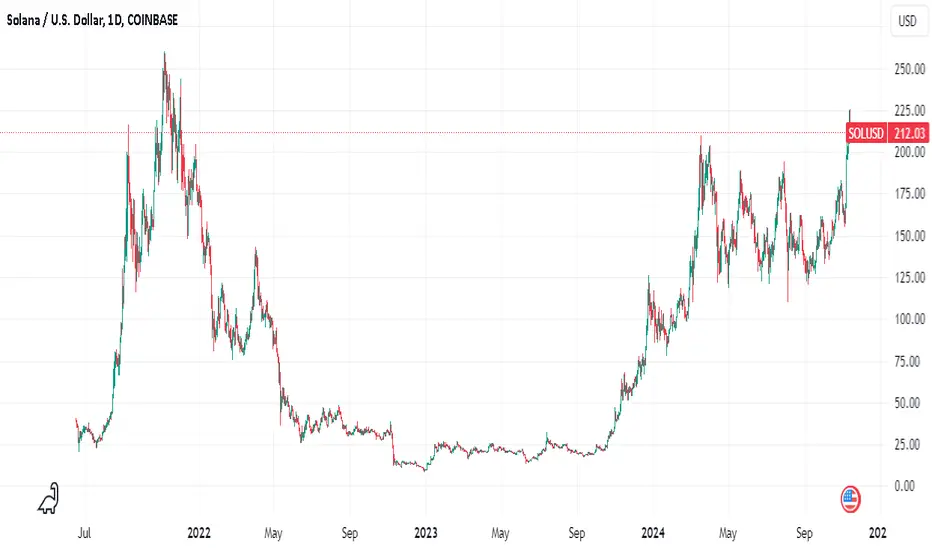
Solana, the best and the worse casesToward November 2023 #Solana exploded from ~$20 all the way to ~$210 in March 2024
Using simple Fib #retracement we should have come back to about $115 ... and we did, on August 2024
So we are now in a bullish descending triangle.
Best case :
Green line, we keep going up over the next 2 or 3 weeks and break out past $170 in the middle of next month.
There is a strong area of #resistance around $165 so breaking past that would be quite #bullish.
Likely case :
Blue line, we keep going up over the next 2 weeks and we bounce back at the area of resistance, ~$165 and we go back down to the support around $130 and we then go back up to eventually breakout sometimes next year.
Worse case :
Red line, again, we keep going up over the next 2 weeks and we bounce back at the area of resistance, ~$165 and we go back down ... but we break past $130 and we go back down to $120, (0.5 fib retracement).
Plan
Enter: Now
SL: $129
Target: anything past $500 (remember this is weekly chart, not 5 minutes)
Look out for trend reversal around $162 ... and close your trade if we break trend as it would be the likely case.
Note that FTX will be refunding some/all of the holders toward the beginning of October, but they will be refunded in US Dollar, so they are very likely to use their money to buy back Crypto, (they were traders afterall and they are well aware of the upcoming bull market).
Solana

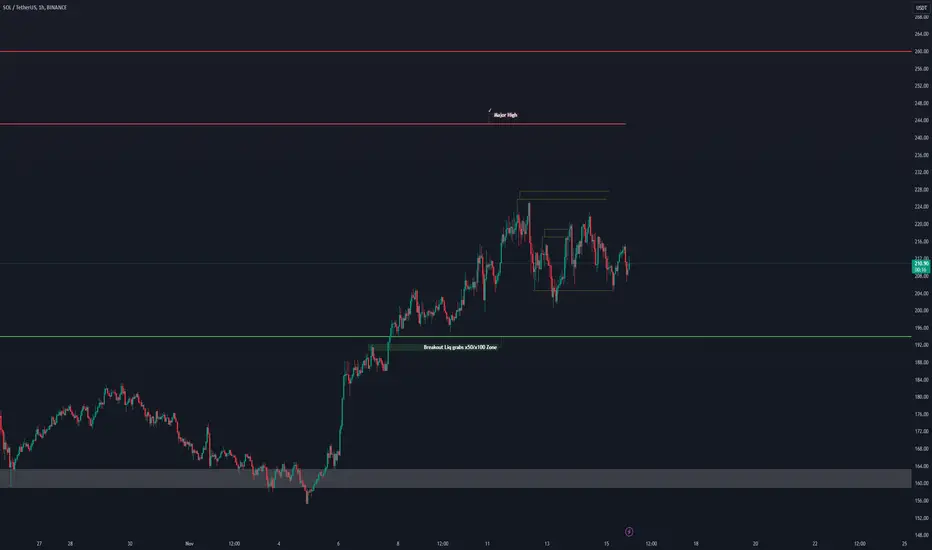
Solana bullish to all time highSolana is going to be very bullish when it leaves the 217-224 area which is a very resistive area. After leaving this area, it will head to all time high facing resistances in the fibonacci levels shown on the chart, which will be a good indicators for scalpers.

Solana Meme Coins tonight! Tyson vs Paul! MAKE MONEYHey fellow crypto enthusiasts,
Tonight is gearing up to be an event that everyone on social media is talking about: Mike Tyson vs. Jake Paul. Love them or hate them, this fight is capturing global attention, and I believe it's a massive opportunity in tonight's meme coin narrative.
Why is this a big deal for meme coins?
In the world of crypto, especially with meme coins, timing and relevance are everything. Major events like this fight create a surge in online activity and discussions, which can be leveraged to launch tokens that capitalize on the hype.
Here's what I'm anticipating:
I expect a plethora of new coins to be launched around this narrative. The key to spotting the next moonshot, in my opinion, lies in finding the one that's both the fastest to market and the most "accurate" in capturing the moment.
What do I mean by "accurate"?
Imagine this scenario:
The moment Mike knocks out Jake (or the other way around), someone clips that exact moment and shares it across social media.
They've already set up a token website and, with the clip in hand, they quickly update it to reflect the event.
They launch a token aptly named something like "Sleepy Jake" or "Sleepy Mike".
By connecting the socials and launching on platforms like pump.fun, they tap into the immediate buzz.
This token could gain massive traction because it encapsulates a viral moment. People love to be part of something trending, and a coin that represents that exact instance has a higher chance of going viral.
What about other tokens?
Undoubtedly, there will be numerous other tokens launched during and after the fight. Some might see significant volume purely due to the general hype. However, the ones that might truly take off are those that:
Capture the exact moment: Timing their launch to coincide with pivotal moments in the fight.
Engage with the community: Active promotion on social media platforms to create a buzz.
Offer something unique: Whether it's a clever name, a catchy logo, or a funny meme, uniqueness can set a token apart.
What am I doing tonight?
I'll be on the lookout for tokens that:
Launch immediately after a significant event in the fight.
Have a strong social media presence.
Show signs of organic growth and community engagement.
What are your plays tonight?
Are you planning to dive into this potential wave of new tokens? Do you have strategies for identifying promising projects amid the flurry of launches?
ADA Surges Amid Rumors of Hoskinson-Trump PartnershipIn his latest YouTube live stream, Charles Hoskinson, the founder of Cardano, announced plans to establish an office dedicated to engaging with government authorities, strengthening Cardano’s strategic position in the global regulatory landscape. This initiative underscores Cardano's commitment to aligning with market trends and regulatory requirements, positioning the ecosystem for greater institutional adoption.
Hoskinson revealed that his team is in contact with key political and regulatory figures, indicating that Cardano is strategically poised to benefit from regulatory advancements and new opportunities in the global cryptocurrency market. This move aims to ensure that the blockchain remains not only competitive but also a leader in compliance and innovation.
With this enhanced focus on regulation and the network's ongoing technological advancements, such as the growth of its DeFi ecosystem and increasing interoperability, ADA has a realistic potential to reach $8 in the near future. Analysts highlight that, supported by Cardano’s solid fundamentals and strong community backing, the project is well-positioned for substantial growth, especially in a more defined regulatory environment.
This new phase cements Cardano as one of the top contenders in the crypto market, offering significant opportunities for investors looking to capitalize on its upward trajectory. BINANCE:SOLUSDT COINBASE:BTCUSD BINANCE:BTCUSD

Solana’s uptrend strengthens, but investors’ moves raise doubtsSolana (SOL) price has seen a remarkable 40% surge in recent weeks, climbing to $210. Despite this bullish uptrend, SOL is encountering challenges at the $221 resistance level, which could signal a potential reversal.
Investor activity on the Solana network suggests the momentum might face hurdles in sustaining further gains.
Transaction activity on the Solana network has increased significantly during the recent price rally. The network recently hit a yearly high in transaction count, highlighting growing interest among participants. However, this increase falls short of expectations, given the current hype surrounding Solana ETFs and broader market bullishness.
This moderate network activity raises concerns about the sustainability of the rally. If Solana fails to attract more significant user engagement, its price momentum might falter, especially as broader market cues begin to stabilize.
Solana’s macro momentum remains strong, supported by technical indicators. The Average Directional Index (ADX) is at 32, well above the 25.0 threshold, confirming a strong uptrend.
Solana is currently trading at $210, holding steady above its support level of $201. Despite the recent rally, the “Ethereum killer” is struggling to break past the $221 resistance level, which remains a significant barrier to reaching $245.
The mixed sentiment indicates that SOL may consolidate between $201 and $221 until a clearer directional trend emerges. This range-bound movement could dominate the short-term outlook unless broader market conditions shift dramatically.
However, if investors opt for profit-taking, Solana could see a decline below the $201 support level. Such a drawdown would invalidate the current bullish-neutral outlook, potentially sending SOL to $186, marking a significant setback for the altcoin’s rally.

SOL ideaLooks like Solana is retesting the $200 area, let's see if bounces up, or it punches through it.
What is your opinion?

SOLANA should continue rally It broke to new high as expected in idea published month ago. Now it favors pullback in ((iv)) and expect small pullback before it should continue rally in ((v)) to finish 3. It expect few more highs to finish the sequence started from August-2024 low.

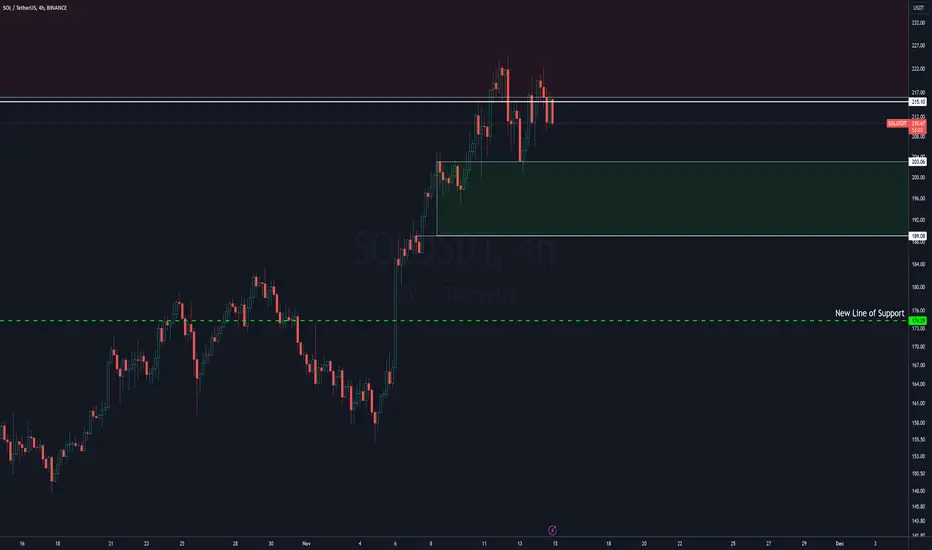
Solana (SOL) - Crucial Key LevelsExpect a short term pullpack for Solana due to Bitcoin dominance in the market. SOl will hold major support around: $174. In addition, the price action will range between= $189 - $203 will likely see a consildation.
However, if a weekly candle closes above: $215 by Monday 12AM; Solana could create momentum to push a correction to the upside. Allow the price to head for a target of "$247" EST.
Long term Solana still remains bullish and positive, SOL has also had a daily candle close above a major previous Resistance level dating back since 2021 bull run cycle.
‼️DISCLAIMER PLEASE READ CAREFULLY‼️
*(THIS NOT FINANCIAL ADVICE, ALWAYS DO YOUR OWN RESEARCH! I AM NOT RESPONSIBLE FOR ANY LOSS OF EARNINGS FROM ANY INVESTMENTS THAT YOU MAY MAKE BASED OFF ANY OF MY IDEAS. ONLY INVEST WHAT YOU CAN RISK TO AFFORD TO LOSE IF YOU MAKE THE DECISION TO DO SO. DO NOT INVEST, UNLESS YOU'RE PREPARED TO LOSE MONEY, IF NOT ALL.)
(CRYPTOCURRENCY CAN BE HIGH-RISK INVESTMENTS DUE TO THE VOLATILLITY OF IT'S NATURE, AND YOU SHOULD NOT EXPECT TO BE PROTECTED IF SOMETHING GOES IN THE WRONG DIRECTION. SEEK PROFESSIONAL ADVICE FROM A CERTIFIED FINANCIAL ADVISOR.)
Solana Breaks Revenue RecordsIn the latest crypto market moves, Solana ( CRYPTOCAP:SOL ) has shown impressive performance, setting a new record in daily revenue and solidifying its position as a major contender in the blockchain ecosystem. Its daily revenue hit a remarkable $3.8 million, with users paying over $7.6 million in transaction fees, bringing the platform’s all-time fees to a substantial $521.54 million. This achievement not only demonstrates Solana’s scalability and rising adoption but also reinforces its appeal to both developers and users as an efficient, high-performance network. As Ethereum, a long-standing blockchain leader, recorded $16.45 million in earnings, Solana's recent growth brings it closer to Ethereum's dominance.
Fundamental Analysis
Fundamentally, Solana’s growth trajectory is fueled by its rapid transaction speeds and cost-effective structure, which has made it one of the most attractive platforms for decentralized applications (dApps), gaming, and decentralized finance (DeFi) protocols. Unlike Ethereum, which faces congestion and high gas fees during peak usage, Solana can handle up to 65,000 transactions per second, all at minimal costs. This efficiency is a primary reason why transaction fees on Solana have skyrocketed to $7.6 million per day, reflecting growing adoption and user reliance on its network.
The consistent revenue generated by Solana underscores the platform's viability as a sustainable blockchain model. Its growth could also be attributed to various improvements and upgrades, including increased security and enhanced interoperability with other blockchains. As the platform matures, it’s not surprising that Solana's overall market outlook has garnered a positive sentiment from the community and investors alike.
Technical Analysis
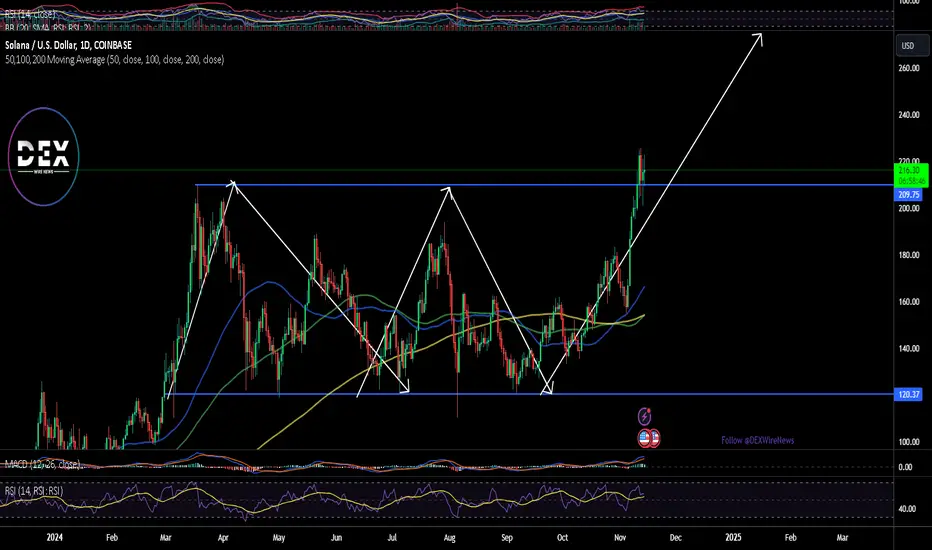
From a technical perspective, Solana’s recent performance has been noteworthy. At the time of writing, CRYPTOCAP:SOL is trading up by 0.67%, holding firmly above the psychological $200 level, a threshold that has strengthened its market position. The Relative Strength Index (RSI) currently stands at 70, signaling an overbought condition, yet this does not deter CRYPTOCAP:SOL ’s upward momentum. Since breaking out of an enclosed rectangular pattern—a sign of consolidation—Solana has maintained a solid support base at $200, suggesting investor confidence and reinforcing bullish sentiment.
The chart shows a strong uptrend, and given the sustained momentum, Solana is positioned to potentially reach the $500 mark in the medium term. While this target may appear ambitious, Solana’s continued revenue growth, high adoption rate, and technical resilience provide it with a robust foundation. Key indicators, including moving averages, support levels, and volume, show favorable signals, with minimal resistance levels anticipated until the $250 mark.
Conclusion
With a record-breaking revenue stream and a resilient technical setup, Solana is establishing itself as a leading force in the blockchain sector. Its ability to outpace Ethereum in certain performance aspects underscores the increasing demand for scalable and efficient blockchain solutions. For investors, Solana’s combination of strong fundamentals and technical promise make it an attractive buy, with $500 as a plausible price target in the near future.
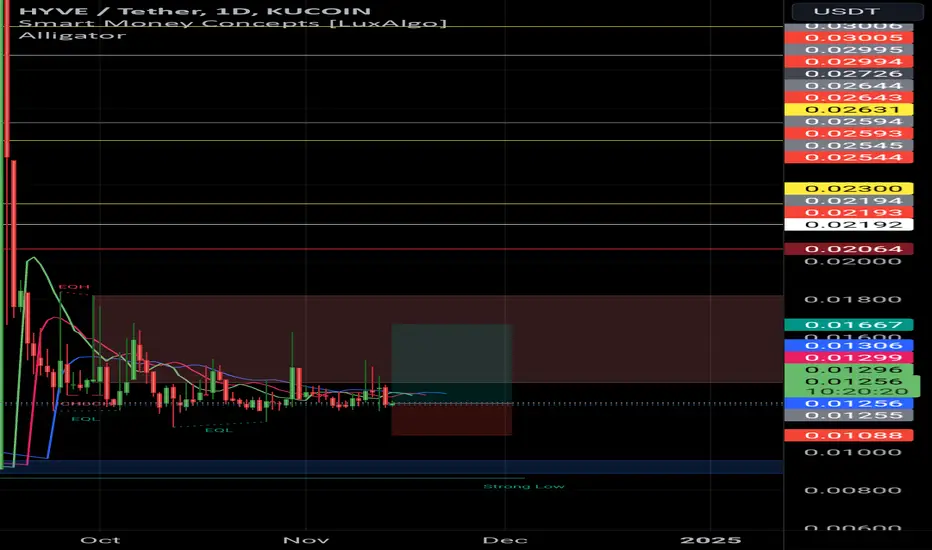
HyveHyve usdt analysis
Time frame daily
Risk rewards ratio >2.5
First target 0.016
Final target 0.55 👈👈👈
Be patient
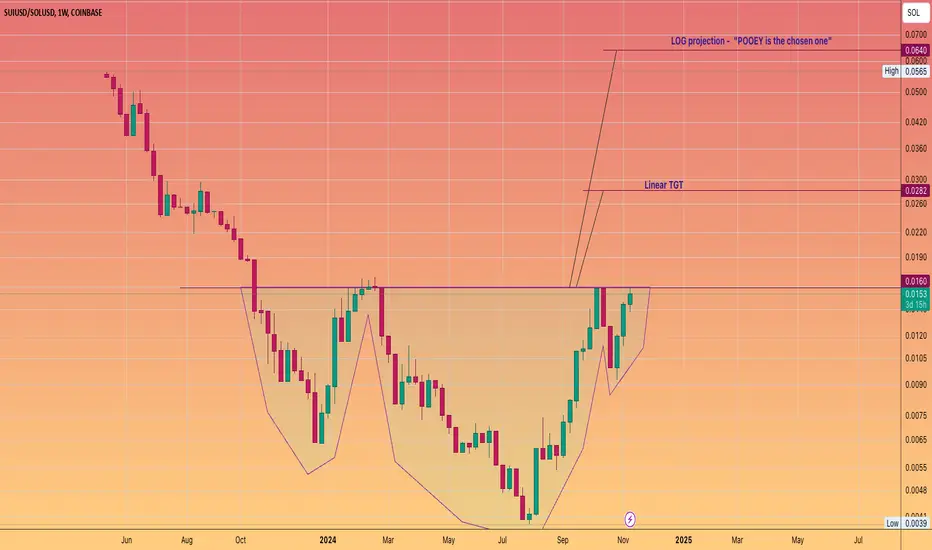
Is SUI the chosen Blockchain of the Banana ZoneThere is a well-defined inverse head and shoulders pattern forming on the CRYPTOCAP:SUI to CRYPTOCAP:SOL USD ratio chart.
The neckline sits at 0.16, a level we recently touched and then pulled back from, marking it as a significant barrier to overcome.
Our linear target is set at 0.0282, indicating a notable potential increase of +83% on the ratio.
Looking further ahead, the logarithmic projection reaches up to 0.064.
At that stage, we can imagine our friend Raoul Pal celebrating in triumph.
Solana (SOL) - Bullish Breakout!!!Solana has created a bullish flag pattern on the chart. This bullish flag pattern indicates that a breakout is imminent. My analysis identifies a key price target of the first at $308.
The chart shown indicates a bullish flag pattern, which is a technical signal suggesting that an uptrend will continue after a period of consolidation. The flagpole represents a prior rapid price increase, while in the meantime a slight pullback is expected leading us in the horizontal consolidation phase.
During this phase a brief pause with multiple attempts to break the ATH major resistance before the next upward movement creating a new All-Time High.
🟢Support= $174
🔴Major Key Resistance= $259
🌟Target= $308🎯
‼️DISCLAIMER PLEASE READ CAREFULLY‼️
*(THIS NOT FINANCIAL ADVICE, ALWAYS DO YOUR OWN RESEARCH! I AM NOT RESPONSIBLE FOR ANY LOSS OF EARNINGS FROM ANY INVESTMENTS THAT YOU MAY MAKE BASED OFF ANY OF MY IDEAS. ONLY INVEST WHAT YOU CAN RISK TO AFFORD TO LOSE IF YOU MAKE THE DECISION TO DO SO. DO NOT INVEST, UNLESS YOU'RE PREPARED TO LOSE MONEY, IF NOT ALL.)
(CRYPTOCURRENCY CAN BE HIGH-RISK INVESTMENTS DUE TO THE VOLATILLITY OF IT'S NATURE, AND YOU SHOULD NOT EXPECT TO BE PROTECTED IF SOMETHING GOES IN THE WRONG DIRECTION. SEEK PROFESSIONAL ADVICE FROM A CERTIFIED FINANCIAL ADVISOR.)

WIF daily 100% gains buy/hold V-shape recovery setup for bulls🔸Hello guys, today let's review daily price chart for WIF . Noteworthy V-shape recovery in progress, with a decent sequence of higher lows, so overall chart looks good for further gains. limited downside currently.
🔸Strong gains previously in September/Octber, right now re-accumulation
in progress so expecting more gains in this market in November 2024.
🔸Recommended strategy bulls: bullish structure and compression in progress. Accumulate near market price in the highlighted zone. Price target for the bulls is 4.50 USD, so it's a 100% BUY/HOLD trade setup. good luck traders.
🎁Please hit the like button and
🎁Leave a comment to support our team!
RISK DISCLAIMER:
Trading Futures , Forex, CFDs and Stocks involves a risk of loss.
Please consider carefully if such trading is appropriate for you.
Past performance is not indicative of future results.
Always limit your leverage and use tight stop loss.

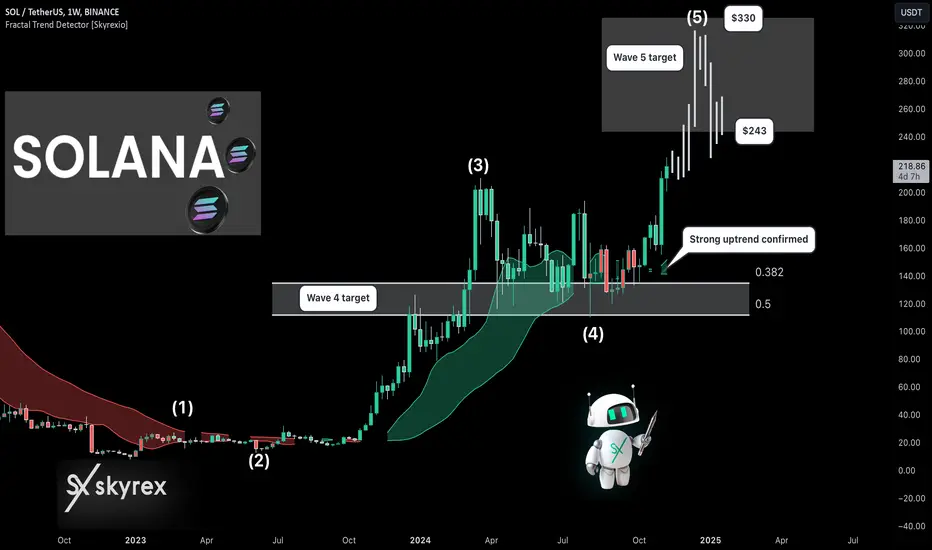
Solana SOL - Game Is Almost OverHello, Skyrexians!
Today it's time for BINANCE:SOLUSDT - the best and the most hated asset in the crypto market in 2024. The reason of the huge rally, while other altcoins are dumping is the lack of holders. Anyway, every growth will be finished at any moment and now it looks like Solana is about to show us the final pump before the new bear market.
Let's take a look at the weekly time frame. Bull market has been started in 2023 with the wave 1. After that price formed flat correction in wave 2 and there impulsive wave 3 reached $200. You can see our new indicator Fractal Trend Detector showing when the massive wave 3 has been started. Green candles means the uptrend. When you see the green dynamic support zone under the price, it means that strong bull market is in progress. Wave 3 has been supported by this zone.
After that price showed corrective wave C which reached exactly 0.5 Fibonacci retracement, like Bitcoin did. Now the price is in wave 5. Candles are green and the green zone has been printed already under the last candle. It means that this uptrend is not local, this is the impulsive wave 5. This wave has the wide target zone between $243 and $330. Inside this zone we have to be careful and wait for the divergence with Awesome Oscillator and bearish reversal bar to not miss the reversal.
Best regards,
Skyrexio Team
___________________________________________________________
Please, boost this article and subscribe our page if you like analysis!
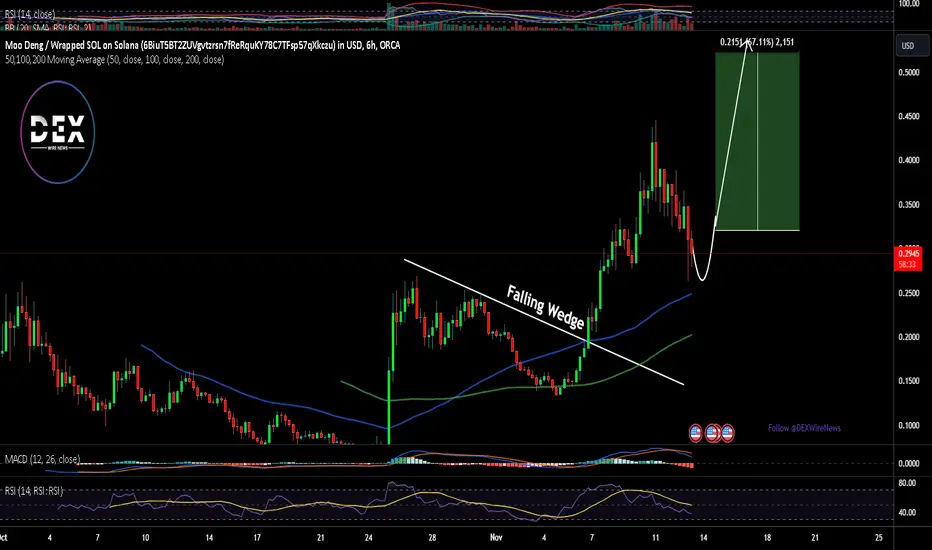
Can Moo Deng ($MOODENG) Hit $1?Meet Moo Deng, the pygmy hippo that took the internet by storm. Residing at Thailand’s Khao Kheow Open Zoo, Moo Deng gained global fame for her chubby charm and energetic playfulness, becoming a viral sensation in 2024. Her legacy has now extended to the Solana blockchain, where she lives on as a cryptocurrency icon under the ticker MOODENG, providing fans and investors alike with a unique way to engage with her story.
Where to Buy Moo Deng (MOODENG)
For those interested in joining the Moo Deng community, MOODENG tokens are available on several centralized exchanges, including LBank, which leads trading activity with a 24-hour trading volume of over $21 million. Additional trading options are available on Bitget and Gate.io, offering users flexibility and accessibility.
Technical Analysis
Moo Deng’s price has seen notable volatility and opportunity, characteristic of many meme-inspired tokens. Currently, MOODENG is trading around $0.3128, a 17% decline from recent highs, positioning it within a bearish reversal channel. This technical setup suggests a potential dip towards $0.18, a critical support level and former resistance point from November 18. This support level could serve as a key buy zone for investors looking to capitalize on a price reversal.
Furthermore, $MOODENG’s price has recently completed a falling wedge pattern, a formation often signaling an eventual price recovery. Despite the near-term bearish sentiment, the token is trading along key moving averages, indicating resilience amidst market fluctuations.
Why Moo Deng Holds Market Promise
While meme tokens are known for rapid price fluctuations, $MOODENG’s performance over the past week highlights its market potential. Recording a 101.8% price increase in the last 7 days, it has outperformed the global cryptocurrency market, which rose 14.6%, and even surpassed the performance of similar meme tokens up 73.4%. The robust trading volume, which reached $135 million in the last 24 hours, underscores strong investor interest in $MOODENG, with a live market cap of approximately $309 million ranking it #225 on CoinMarketCap.
Beyond trading volumes, Moo Deng’s fundamental appeal ties into the broader market environment. As the crypto world anticipates Elon Musk’s "DOGE agenda" and potential political influences like Donald Trump’s public support for digital assets, meme coins are regaining attention. Additionally, the upcoming Consumer Price Index (CPI) data release adds another layer of potential market movement, as inflation data could drive overall market momentum.
The Path Ahead for $MOODENG
Despite short-term headwinds, Moo Deng’s potential for reaching $1 remains feasible given market sentiment and the popularity of the meme token segment. For investors tracking both the technical patterns and broader market fundamentals, $MOODENG presents a compelling case, particularly if it respects the critical support level at $0.18. As crypto interest accelerates, Moo Deng may continue her rise, both as a beloved internet figure and a promising digital asset.
Is a SOL Solana Pullback and Buy Opportunity on the Horizon?👀👉 SOL has recently demonstrated strong bullish momentum, but could it be reaching an overextended zone? This chart highlights a potential pullback at a key support level, which may offer an ideal entry opportunity. I’m watching this area closely for a possible buy setup that meets the essential criteria covered in the video. In this analysis, we’ll explore key price action signals and discuss strategies for positioning in the next potential move. Disclaimer: This analysis is for informational purposes only and is not financial advice. 📊

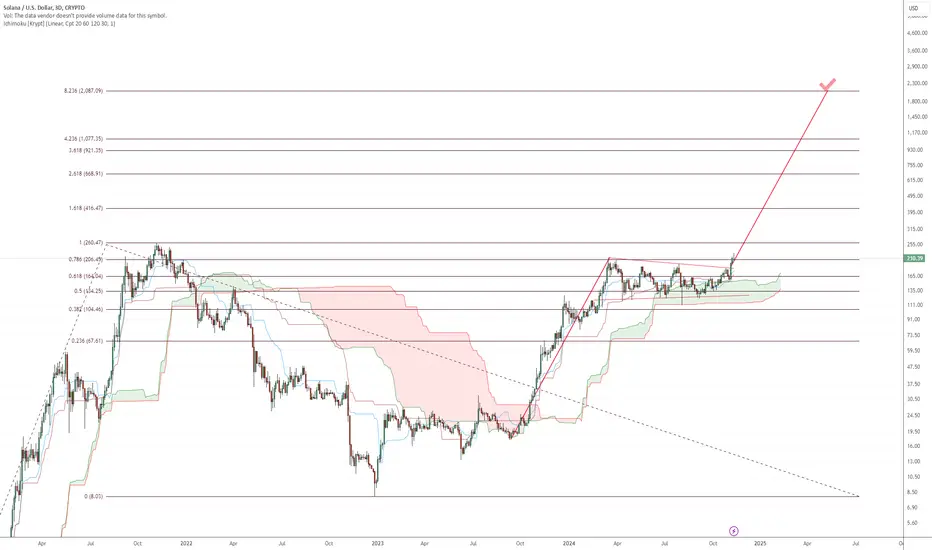
SOLUSD up 1000% by July 2025?!Using Fib Retracement tool and a basic flag chart pattern measured move they both predict a possible move from current price of $210 to somewhere in the neighborhood of $2000. Long consolidation followed by a breakout with BTC smashing new highs could lead the Alts on a wild ride in 2025!
Is Solana the New Bitcoin? Exploring its Stellar Rise Is Solana the New Bitcoin? Exploring its Stellar Rise in the Post-Election Rally
Solana (SOL), a high-performance blockchain platform, has been making waves in the cryptocurrency market, surging past the $200 mark and outpacing even Bitcoin's recent gains. This significant price appreciation comes amidst a broader post-election market rally, fueled by optimism about the regulatory landscape and increasing institutional adoption.
The Solana Surge: A Closer Look
Solana's price has skyrocketed over the past week, gaining an impressive 36%. This rapid ascent has caught the attention of both retail and institutional investors, as the platform's unique features and growing ecosystem continue to attract interest.
Key Factors Driving Solana's Rally:
1. Post-Election Market Optimism: The recent U.S. elections have injected a sense of optimism into the cryptocurrency market. Investors are hopeful for a more favorable regulatory environment, which could lead to increased institutional adoption and mainstream acceptance of cryptocurrencies.
2. Anticipation of Spot Solana ETFs: The potential approval of spot Solana ETFs could significantly boost the demand for SOL tokens. As more institutional investors gain exposure to Solana through ETFs, the token's price could experience further upward pressure.
3. Strong Network Performance and Ecosystem Growth: Solana's high-performance blockchain and rapidly growing ecosystem of decentralized applications (dApps) have attracted developers and users alike. The platform's ability to handle a high volume of transactions at low cost has made it a popular choice for various use cases, from DeFi to NFTs.
4. Institutional Adoption: Several institutional investors have shown interest in Solana, recognizing its potential to disrupt traditional financial systems. As more institutions allocate capital to Solana-based projects, the demand for SOL tokens is likely to increase.
The Potential for Further Upside: A $600 Target
A recent survey conducted by MV Global suggests that Solana's price could reach $600 during the current bull cycle. This optimistic forecast is based on several factors, including:
• Strong Fundamentals: Solana's robust technology, scalability, and growing ecosystem provide a solid foundation for long-term growth.
• Institutional Interest: As more institutional investors discover the benefits of Solana, the demand for SOL tokens is expected to rise.
• Favorable Regulatory Environment: A supportive regulatory framework could unlock significant institutional capital and accelerate the adoption of cryptocurrencies, including Solana.
• Market Sentiment: Positive market sentiment, fueled by technological advancements and economic recovery, could further propel Solana's price upwards.
Conclusion
Solana's recent surge to over $200 is a testament to its growing popularity and strong fundamentals. The platform's high-performance blockchain, thriving ecosystem, and increasing institutional adoption have positioned it as a major player in the cryptocurrency market. As the industry continues to mature and regulatory clarity emerges, Solana has the potential to deliver significant returns to investors.
However, it's important to note that the cryptocurrency market is highly volatile, and prices can fluctuate rapidly. Investors should conduct thorough research and consider consulting with financial advisors before making investment decisions.
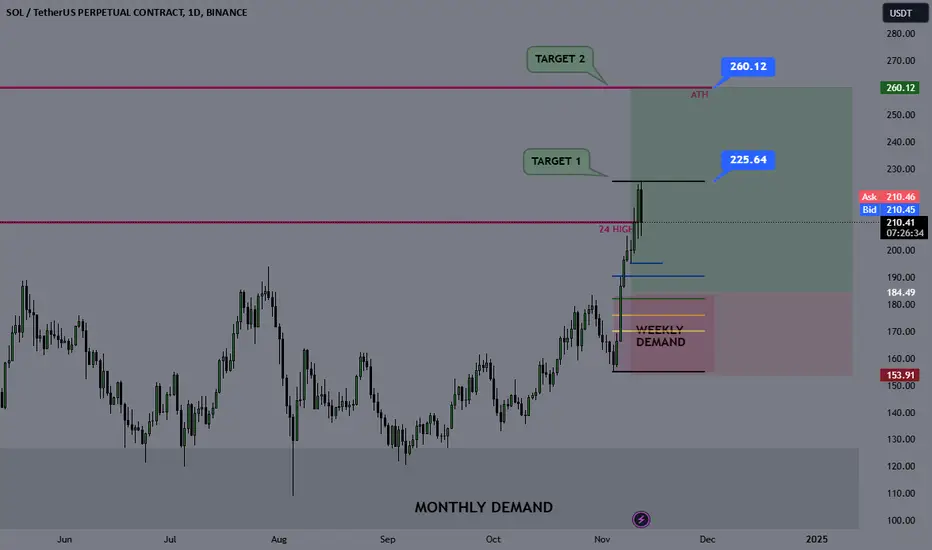
Solana Targeting All-Time Highs – SOLANA SWING LONGSolana has hit all the targets I shared here weeks ago!
I hope you took some profits. We've reached the third and final target—the March 2024 high. Now, it looks like we're retracing back into the weekly demand zone. I expect a potential bounce from the top of this zone, which aligns with the Fibonacci retracement. From there, we could see price movement toward new all-time highs.
I’ll be watching for lower-time-frame confirmations to enter the trade. Price could wick all the way into the weekly demand and fail to close below, especially if Bitcoin drops impulsively. So, look for confirmations first.
Stop Loss: 153
Target 1: 225
Target 2: 260
Sol - best long after pullback or rnageSol - best long after pullback or range
Take long if price reach 180 - 190 area

(SOL) solana "4th" Solana's market capital has surpassed BNB and is now the 4th largest cryptocurrency in the world.

ACT: The AI Prophecy — Poised to Reach $4 Soon on BinanceAct I: The AI Prophecy (ACT) is on a rising trajectory and could reach $4 at any moment, driven by a growing market interest and Binance’s robust trading environment. This is the time to consider ACT as a strategic addition to your investment portfolio.
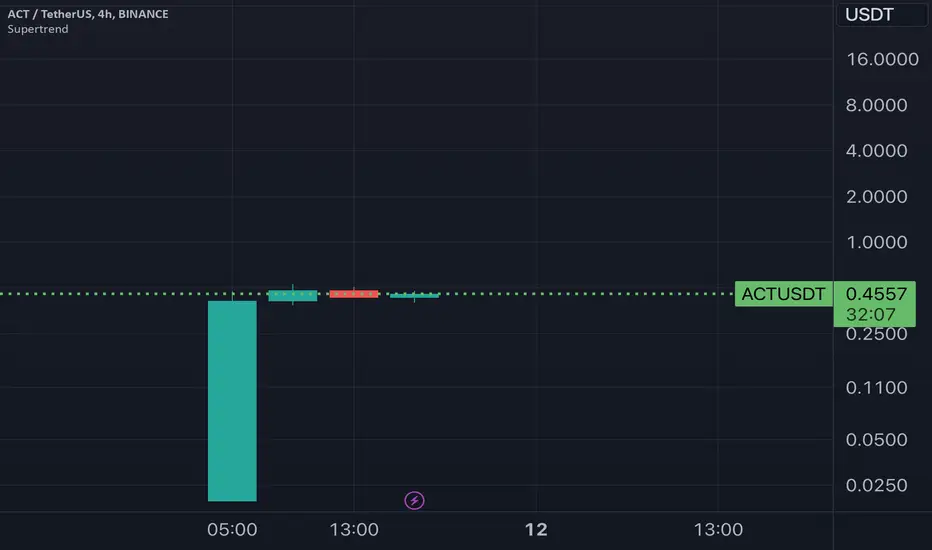
Start of trading: When the candle is a bearish candle
(Title) Start of trading: When the candle on the 1D chart is a bearish candle
--------------------------------------------
Hello, traders.
If you "Follow", you can always get new information quickly.
Please click "Boost" as well.
Have a nice day today.
-------------------------------------
(SOLUSDT 1M chart)
The point to watch is whether the ATH can be renewed.
-
(1W chart)
To do that, the key is whether the uptrend can be maintained above 202.45.
If it falls below 202.45, you need to check whether it can be supported around 147.74-168.41.
-
(1D chart)
It has not yet updated the ATH, but it is located in a section where there is no support or resistance point to respond to.
Therefore, it is not easy to trade in this section.
Therefore, when the candle of the 1D chart is a downward candle, you have no choice but to check the support on the 1h chart and trade.
-
(1h chart)
The names of indicators that should be considered important on the time frame chart below the 1D chart are displayed.
When the candle of the 1D chart is a downward candle, you can trade depending on whether there is support near BW(100) and BW(0) on the 1h chart (you can use the chart you usually see and trade).
When trading spot, it is recommended to buy when the BW(100) and BW(0) indicators break upward, if possible.
-----------------------------------------------
As the price rises, you start to feel anxious.
If you feel like you are the only one making little profit and you start to feel like you have to buy now, it means that the coin market is approaching its peak.
What do you think?
When the spot market is rising, the number of transactions decreases.
Otherwise, if the number of transactions is increasing, I think it is likely that you are in a state of FOMO.
Therefore, you need to make an effort to find peace again.
-
Have a good time.
Thank you.
--------------------------------------------------
- Big picture
It is expected that a full-scale uptrend will begin when it rises above 29K.
It is expected to touch 81K-95K in the next bull market.
#BTCUSD 12M
1st: 44234.54
2nd: 61383.23
3rd: 89126.41
101875.70-106275.10 (overshooting)
4th: 134018.28
151166.97-157451.83 (overshooting)
5th: 178910.15
These are points where resistance is likely to occur in the future.
We need to check if these points can be broken upward.
We need to check the movement when this section is touched because I think a new trend can be created in the overshooting section.
#BTCUSD 1M
If the major uptrend continues until 2025, it is expected to start forming a pull back pattern after rising to around 57014.33.
1st: 43833.05
2nd: 32992.55
-----------------
