$420 Solana Within 2 Months —TargetsSolana is on a path to a hit a price target of $420 mid-term, within 1-3 months. This is the continuation of the uptrend that started in early April with the end of the previous correction and a more than a year long strong low.
This is not for the faint of heart. Solana is preparing for something massive, even scary but positive. $600+ is also possible but we are going step by step and $420 is the first step.
Immediately when prices start to rise Solana is likely to find resistance around $220 and $253.
The last high, January 2025, would be the minimum on this bullish wave. This would be price tag of $296.
The end of the retrace happened 22-June. This means that the market is already bullish for an entire week. Bitcoin is about to produce the best possible weekly close. As Bitcoin is ultra-bullish above $106,000/$107,000, the altcoins can continue to recover and will aim higher trying to catch up. Of course, no altcoin can catch up to Bitcoin but invariably the entire market will grow.
The wait is over, we are bullish now. Timing is great.
Bullish momentum will grow for weeks and then a major force will permeate the market, something not seen in many years. I hope you are prepared.
Namaste.
Solana

$SOL Bullish Engulfing On WeeklyCRYPTOCAP:SOL closes the week with a Bullish Engulfing candle.
50WMA at $170 next target to smash.
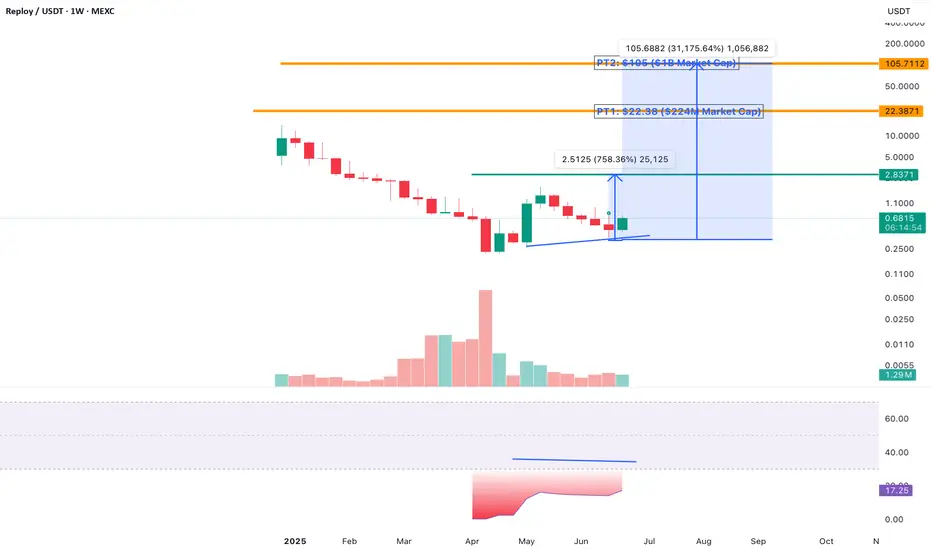
Buying Reploy AI (RAI) Today Is Like Buying Bitcoin at $345Buying Reploy AI (RAI) Today Is Like Buying Bitcoin at $345—Or Even $3.45
Imagine going back in time to 2016 and buying Bitcoin at $345. Most people didn’t believe in it. They thought it was too risky, too early, or just plain irrelevant. Today, Bitcoin is trading in the six figures. The opportunity was historic.
Now, there’s another chance brewing—and it’s quietly sitting in front of us.
That opportunity is Reploy AI ($RAI).
🚀 What is Reploy AI?
Reploy AI is a micro-cap artificial intelligence (AI) project focused on decentralizing the compute layer that powers AI training and inference. It’s building a distributed AI network that connects GPU resources with developers and businesses in need of scalable AI infrastructure. Think of it as the decentralized AWS + OpenAI — built from the ground up for speed, accessibility, and equity.
It’s early. But the fundamentals, vision, and market positioning are explosive.
💰 Let’s Talk Numbers: The Bitcoin Comparison
Right now, Reploy AI ($RAI) trades at a tiny market cap—roughly $3 million at the time of writing.
If $RAI hits a $1 billion market cap, that’s a 31,000% return.
Yes, 31,000% — not a typo. That’s a 310x gain.
That would be like buying Bitcoin at $345, before it ran to over $100,000.
If $RAI grows into a $10 billion AI ecosystem, it would be like snagging Bitcoin at just $3.45.
Let that sink in.
🌐 Why This Could Actually Happen
AI Is the Next Internet
The world is undergoing an AI revolution. But centralized giants (like OpenAI and Google) dominate access. Reploy offers a decentralized, censorship-resistant alternative — and the market desperately needs it.
Micro Cap = Maximum Asymmetry
Unlike hyped-up billion-dollar AI tokens, Reploy is still undiscovered. Small caps like this can explode with just one partnership, listing, or viral catalyst.
Strong Tokenomics & Ecosystem Design
RAI has a deflationary supply structure, utility-driven demand, and real infrastructure use cases tied to decentralized compute, developer tooling, and enterprise deployment.
It’s Not Just Hype. It’s Being Built.
Reploy isn’t vaporware. The team is shipping code. The platform is live. And the network of compute contributors is growing.
⚠️ Of Course, This Is Risky
Yes, it’s still early. Yes, micro-cap tokens carry real risk. But so did Bitcoin when it was $345. So did Ethereum when it was $7.
The difference is this: most people only see opportunity when it’s already gone.
This isn’t financial advice. But if you’ve ever wished for a second shot at catching a generational trend early—this might be it.
🧠 Final Thought
In crypto, the biggest returns come from spotting the future before it’s obvious.
Buying $RAI at today’s price could be your version of buying CRYPTOCAP:BTC at $345—or even $3.45. The only question is: will you see it in time?
📈 DYOR. Stay sharp. Think long-term. And don’t miss what might be the next breakout in AI + crypto.
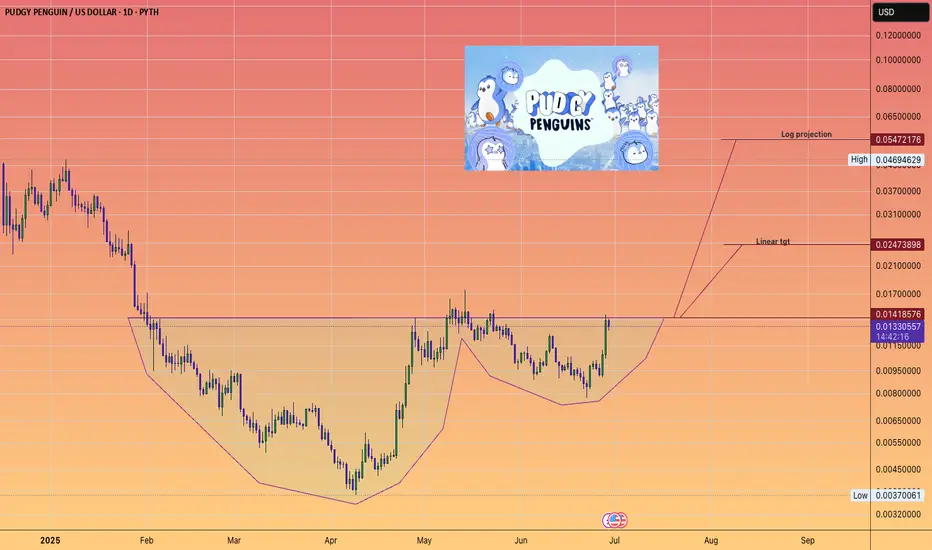
Can Penguins Fly?Pudgy Penguins #Pengu is up nicely already 3.6X from it's april low.
And is sitting nicely outside the top 100 CMC list and is the 8th biggest Memecoin by marketcap.
It appears it is on the cusp of a cup and handle breakout and projects to a very high flying 5 cent log projection.
(#Crypto's are highly speculative and can go down -99%)
NothingThe SOL will increase $150 and reach to the top of the wedge in the coming weeks .
Best regards CobraVanguard.💚

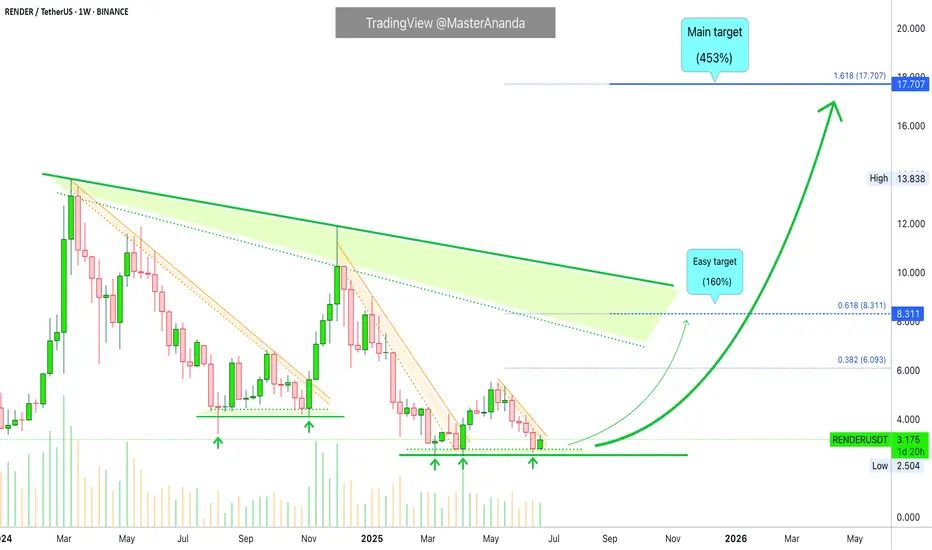
Render Token Buy Zone: New ATH $17.7, $27 & $46, 2025-26Render Token (RENDERUSDT) is moving within a strong buy zone. Any price below the 5-August 2024 low is a great entry when you aim for the 2025/26 bull market wave. That is, any entry below $3.41 is a very strong, low risk and high potential for reward buy. This is a solid pair.
Remember in 2024 when I told you it was going down, down, down, down? It has been going down for more than a year and three months. There is good news though, Render Token will go down no more.
The chart shows lower highs and lower lows. The last four months have the same base, no new lows. The lows in late 2024 are also not that far away.
Late 2025 & early 2026 targets (New all-time high)
The lower highs are part of a classic correction pattern, with the current chart structure opening up an easy 160% target. This is very easy.
The main target can reach $17.7 (PP: 453%) with higher prices being almost certain. The last target can be around $27 or $46, for these, we will have to wait and see.
When to sell
If the initial move has much force, buyers support and bullish momentum, we can aim for the higher targets. If the initial action is weak and there isn't enough market-buyers support, then we aim lower; it all depends on how the bull market develops but overall the potential is very strong. For Render, for Bitcoin and the rest of the altcoins.
Thanks for the support.
Namaste.
HolderStat┆SOLUSD breakoutBINANCE:SOLUSDT on the 6h chart has shifted from a falling to a growing channel structure. Support around $135 held, and now the price is eyeing $160–$170. Previous breakouts from similar structures have triggered steep gains.

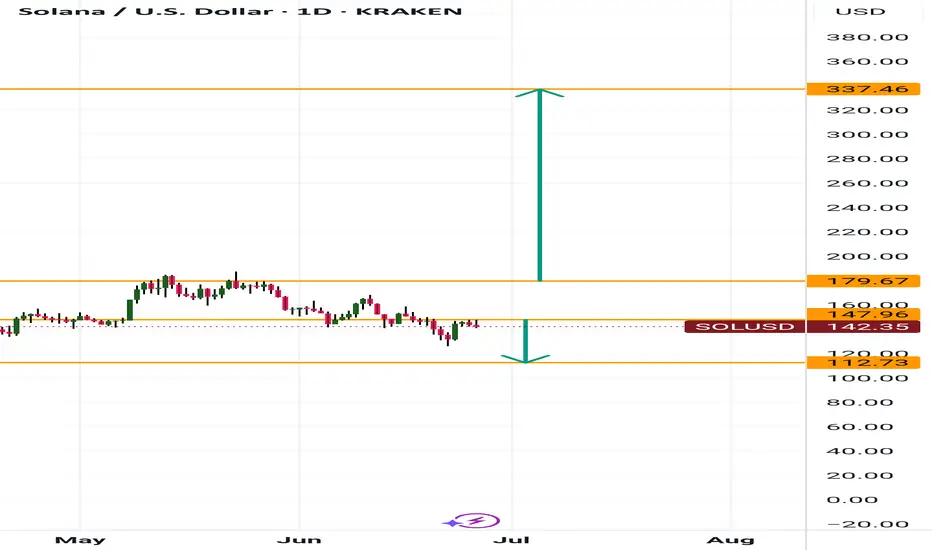
Solana Heading to 112 or 330+Hey fam
So for Solana if we hold under 148 then a drive down to 112 makes sense. However if we drive above 148 then we can possibly hit weekly targets of 330
Make sure you adjust accordingly in a smaller time frame to ensure your in the right move
Happy tradings folks
Kris Mindbloome Exchange
Trade Smarter Live Better
Under 148 we go to 112 if we break 148 we can see a drive up to 338
HolderStat┆SOLUSD above the supportBINANCE:SOLUSDT reclaimed the $140 level after a wedge breakout and is now forming a stair-step recovery structure. The price is targeting the mid $150s with higher lows supporting the bullish thesis. Previous consolidations and wedge formations suggest buyers are regaining control. Continued strength above $140 reinforces the move.

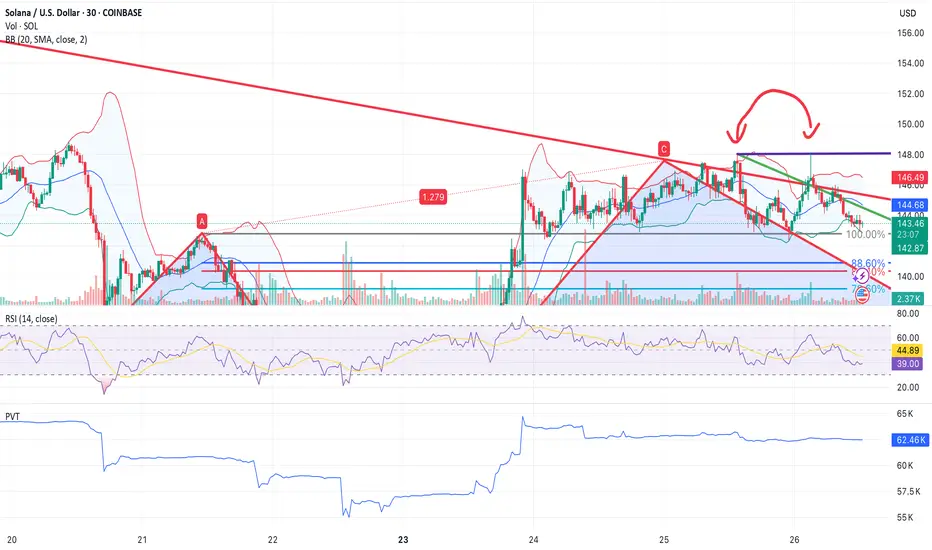
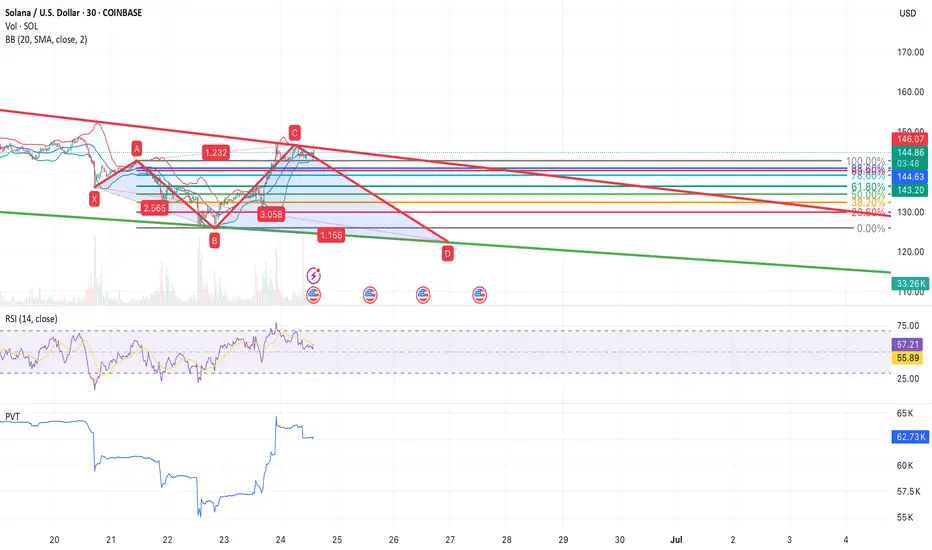
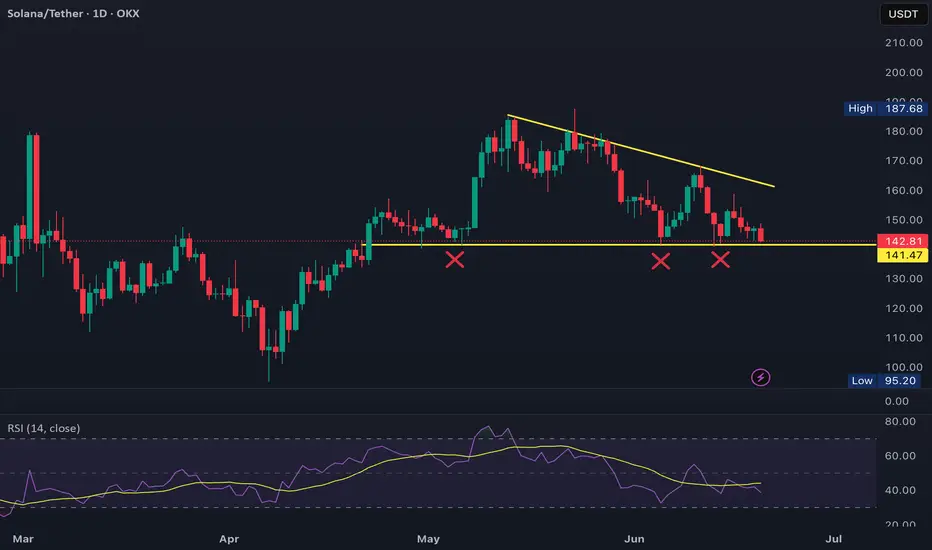
SOL/USDT - Visible double top formationAfter hitting the projected reversal zone near 144–145, SOL/USDT has now formed a clean double top, reinforcing the bearish thesis initially outlined by the harmonic pattern. The second peak failed to break the macro descending trendline, and the price is now trading back below the 100% Fibonacci retracement of the XA leg.
This double top adds structural confirmation to the harmonic C-point rejection:
Volume remained lower on the second peak
RSI on the 30m chart printed a lower high while price matched previous highs — a textbook bearish divergence
PVT continues to flatten despite price volatility, suggesting a lack of bullish conviction
Price is now slipping below 143, and bearish momentum is building.
SOl on Resistance level. If this area is broken and retested I will buy otherwise will wait to buy the low around 126$
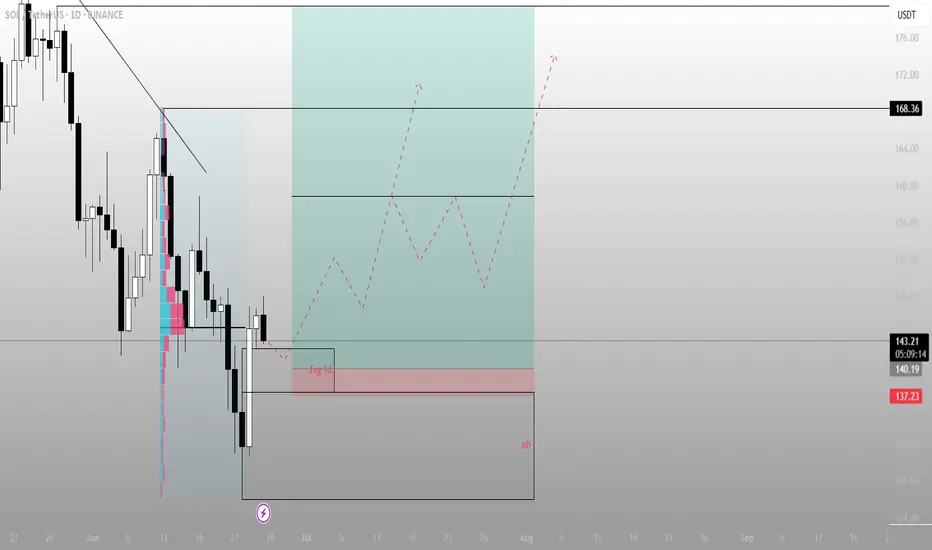
Most see rejection. I see a launchpadWhat looks like a failed breakout is actually SOL setting up for a higher timeframe reversal, right at a refined zone of inefficiency and Smart Money interest. The narrative isn’t over — it’s just beginning.
Technical Breakdown:
Current Price: ~$143.30
Context:
Price tagged the Fair Value Gap (FVG) on the daily and showed reaction — a sign of algorithmic awareness
Volume profile suggests thin liquidity above, ripe for expansion if momentum kicks in
Key Levels:
FVG (1D) zone: just under current price (~140.19)
Order Block (OB): ultimate demand zone near 137.23 — strong structural support
Downtrend Line: recently broken, retest in motion
Major Upside Target: 168.36 — a clean liquidity magnet
Strategic Thesis:
Price dipped into FVG but held above the OB — a classic Smart Money accumulation setup
The dashed projection shows potential higher lows forming, giving fuel for a push through prior highs
FVG + OB form the discount zone, where risk/reward is maximized before the next impulse move
Execution Plan:
Entry zone: $140.00–137.50
→ Expect small shakeouts before confirmation
Invalidation: Daily close below $136 kills the bullish case
Target:
Primary: $168.36
Stretch Goal: $172–176 if momentum is sustained into August
SOL/USDT – Bearish Harmonic Completion Near 144–145The 2H chart shows an extended X‑A‑B‑C‑D harmonic structure (an extended Bat/ABCD). Leg XA was the initial down-leg (from the recent swing high down to A), AB was a corrective pullback, and BC retraces sharply into the 88.6–100% zone of XA (around $144–$145). In a classic Bat/ABCD, the CD leg often completes near an 88.6% retracement of XA, so this C zone is a potential reversal point (PRZ). Importantly, C also sits on the chart’s long-term red descending trendline – a confluence of fib and trendline. A break below this level would “validate the bearish harmonic pattern,” with the downtrend line amplifying selling pressure. The projected D-point is ~$122.63 (late June/early July), which coincides with the lower green channel support on the chart.
Harmonic pattern (2H SOL/USDT): XA and AB moves set up a deep BC up into the 88.6–100% fib zone (around $144–145) at C. This confluence of fib levels and the macro descending trendline makes C a strong Potential Reversal Zone (PRZ). The CD leg targets ~122.63, aligning with lower channel support (green). Across timeframes the momentum is waning into point C. RSI is rolling over – price made a lower high while RSI failed to confirm (a classic bearish divergence). Meanwhile, the PVT (Price Volume Trend) line has flattened even as price crept higher, indicating the rally is not supported by volume.
Volume patterns also signal distribution: rallies into C have occurred on declining volume, a textbook sign that buying interest is drying up. Wyckoff distribution theory notes that as a top forms, “rallies during this stage often show lower volume” and ensuing drops on higher volume. In short, weakening RSI, a flat PVT, and thinning volume all confirm the selling pressure around $144–$145, consistent with a bearish reversal at C. Momentum and volume (15m SOL/USDT): RSI has peaked lower while price nears $145, and PVT has flattened (highlighted). Rallies into C come on lower volume, matching Wyckoff distribution cues. These divergences suggest the upward move into C is exhausted.
Trade Plan & Risk Management
Entry: Short initiated at $145.00 (near the PRZ around C).
Stop Loss: $146.20 (just above the red trendline and invalidation of point C).
Take Profit Targets:
TP1 : $129.00 (minor fib support, ~61.8% retrace of the last swing).
TP2: $122.63 (harmonic D projection and channel support).
TP3: $120.00 (extension to lower channel boundary).
Confirmation: Watch for a break of the short-term support at ~$139.50 for added conviction before letting profits run.
Note: A short position was opened at $145. This outline is for informational purposes – it is not financial advice. Trade with proper risk management.
Each target corresponds to technical levels (fib retracements and channel support). The first target aligns with a ~61.8% retracement (common fib TP level), and the final targets sit on the longer-term channel floor. If price breaks under $139.50, it would further confirm the bearish thesis.
$SOL Local Bottom FormingCRYPTOCAP:SOL closed the day back within the POI.
RSI oversold.
Should see a retest ~$136 to confirm the local bottom.
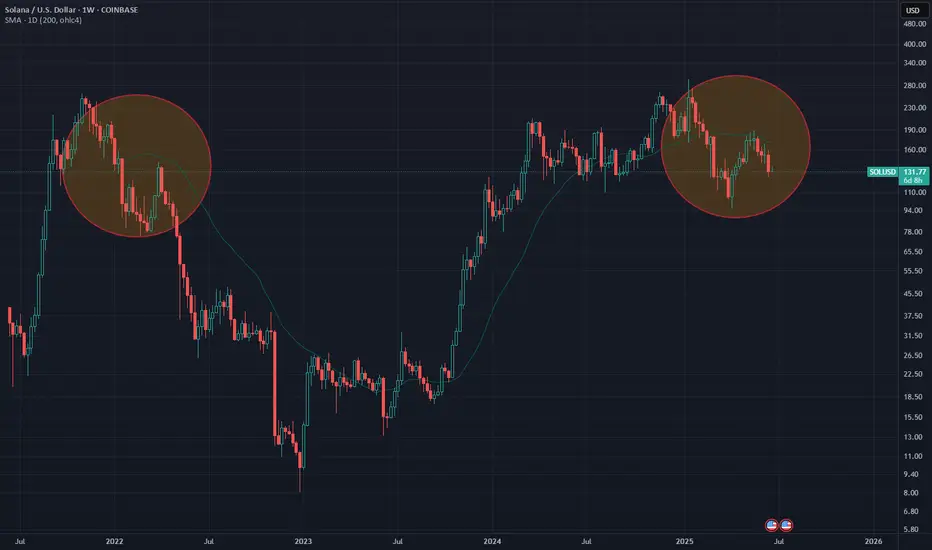
Solana looks scary. I don't like this rejection from the 1D 200MA.
Looking at the the weekly chart, it is very easy to see the similarity to 2022.
Maybe we should brace for impact?
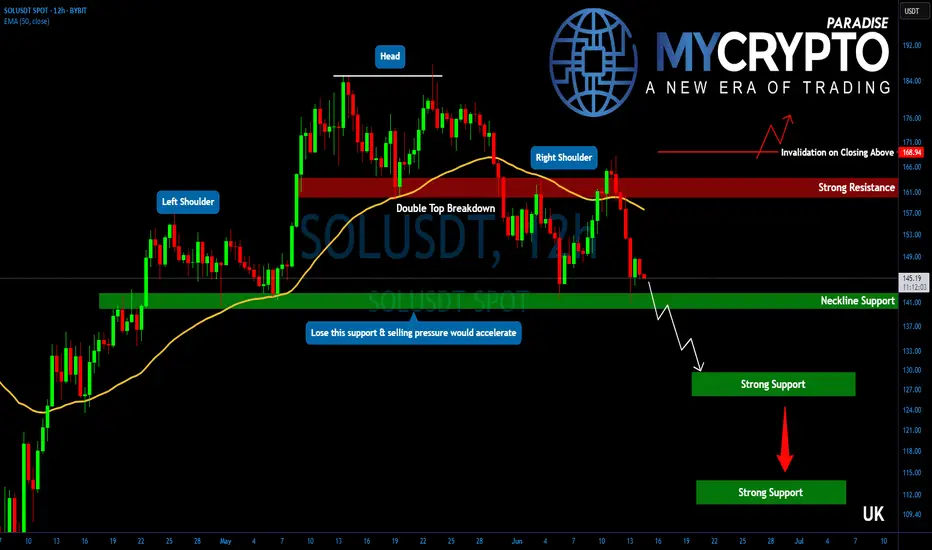
Solana Breakdown Incoming? These Are Key Levels To WatchYello, Paradisers! Are you ready for the next major flush? After failing to gain momentum since the May double top breakdown, #SOL is now showing even more bearish signs, and the market might be about to punish late bulls one more time.
💎Following the confirmed double top in May, SOL has struggled to reclaim any upside momentum. Now, on the 12-hour chart, a classic head and shoulders formation is emerging, a pattern that often precedes larger trend reversals when the neckline breaks.
💎#SOLUSDT is hanging onto critical support between $142 and $140. This zone is the neckline, and it’s the last stand for bulls. If bears break it, we get a clear breakdown confirmation, with a clean path down toward $130–$127, which marks the first major demand area.
💎That initial support likely won’t hold for long. If pressure continues, SOL is expected to drop further toward the $115–$110 region. This is not just a technical support, it’s also the target area of the H&S formation, making it a magnet zone for price.
💎Adding to the bearish developments, a death cross has now been confirmed on the 12-hour chart. The EMA-50 has crossed below the EMA-200, reinforcing short-term downside pressure. Even if a relief bounce occurs, the $155 region, where the EMA-50 sits, will likely act as fresh resistance and attract renewed selling.
Paradisers, strive for consistency, not quick profits. Treat the market as a businessman, not as a gambler.
MyCryptoParadise
iFeel the success🌴
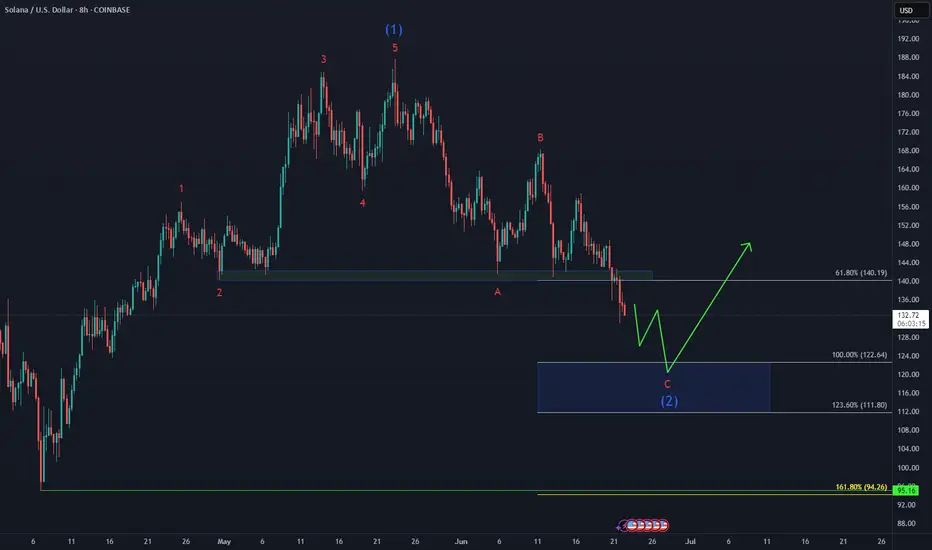
Solana Next Buying Zone on WatchCRYPTO:SOLUSD is correcting the 5 waves advance from April low within a 3 waves ZigZag structure and as price slipped to a new marginal low beneath last week’s support, signaling potential weakness toward equal legs area$122 - $111 before buyers look to step in again.
Keeping an eye on reactions in this zone—could set up for a bullish reversal once demand kicks in!
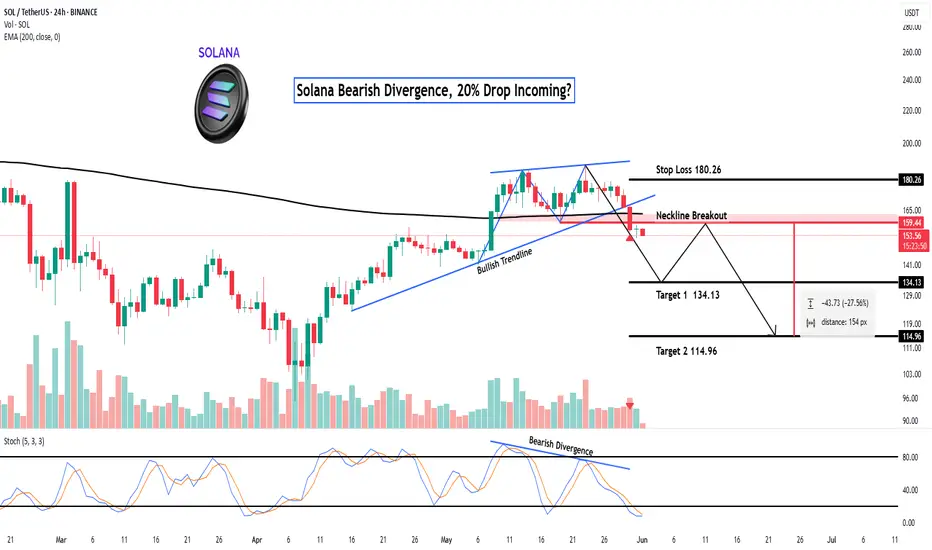
Solana Bearish Divergence, 20% Drop Incoming?Hey Realistic Traders!
Bearish Signal Flashing on BINANCE:SOLUSDT , What Signals Are Showing?
Let’s Break It Down..
On the daily timeframe, Solana has formed a double top pattern, followed by a neckline breakout, which is a classic sign of a potential shift from a bullish to a bearish trend.
This breakout was confirmed by a break of the bullish trendline, accompanied by rising selling volume, which reinforces the bearish momentum. Adding to this, a bearish divergence has appeared on the stochastic oscillator. Bearish divergence occurs when price makes higher highs while the oscillator forms lower highs, signaling weakening buying pressure and increasing the likelihood of a reversal.
Given these technical signals, the price is likely to continue moving lower toward the first target at 134.13, with a possible extension to the second target at 114.96.
This bearish outlook remains valid as long as the price stays below the key stop-loss level at 180.26.
Support the channel by engaging with the content, using the rocket button, and sharing your opinions in the comments below.
Disclaimer: "Please note that this analysis is solely for educational purposes and should not be considered a recommendation to take a long or short position on Solana.
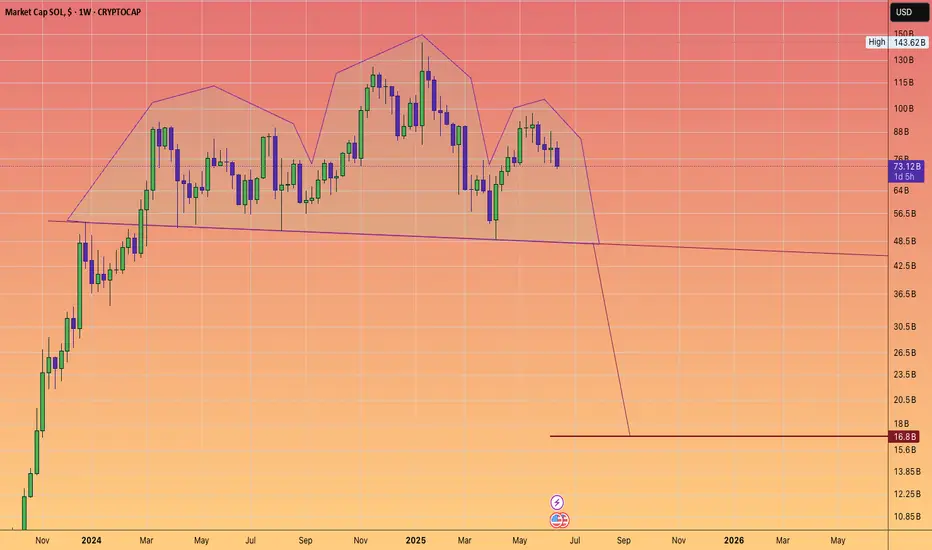
SOLANA MARKETCAP LOOKS COOKEDIs that a Head and Shoulder's top?
Is #crypto about to endure a Iron dome penetration event?
Sol at Risk: Key Support Break Could Trigger Drop to $97Sol is on the verge of breaking a critical support level. If this level fails, we could see a drop towards the $130–$125 range.
However, based on the full pattern length, Sol has the potential to fall as low as $97 — aligning with a possible double bottom formation.
Daily EMA 55 needs to move above EMA 200!!
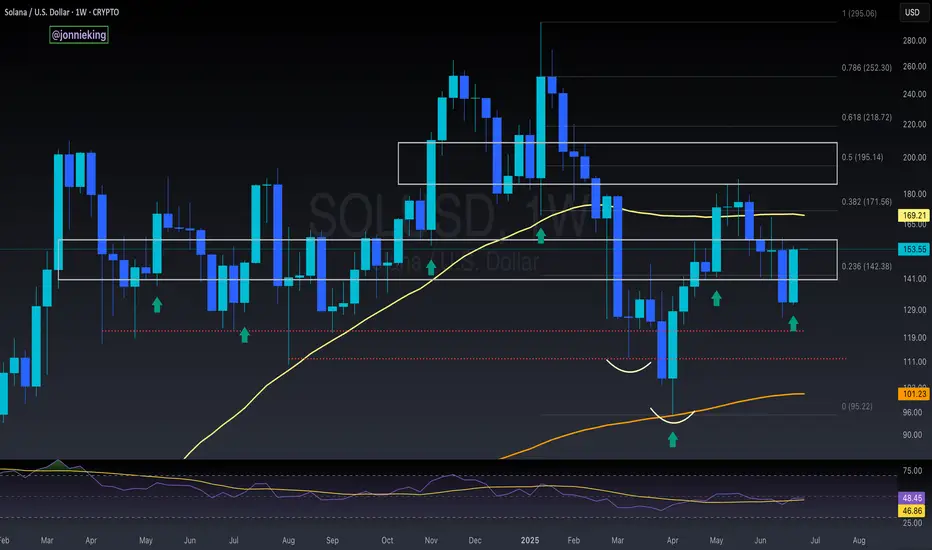
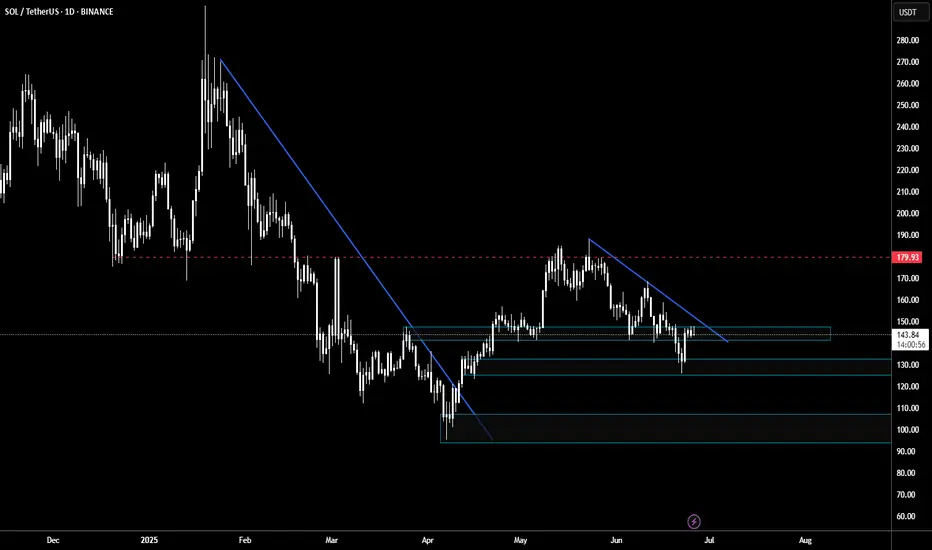
My general bias for Solana is bullish. However, the current setup is very similar to the setup in Feb-Apr 2022 before Solana started a macro bear trend. (see blue rectangular box)
I am still waiting for a long trade opportunity. I am not looking for a short trade. I just need to sit tight and see how the price is going to unfold in the next few months in the daily chart.
The 2022 setup (see blue rectangular box in the chart):
1) EMA55 crossed below EMA 200 on 16th Feb 2022. (red vertical line in the chart)
2)The price found the temporary floor around $80 and sharply moved above both EMA55 and
200. (see light blue rectangular box)
3) It was the dead cat bounce. It was the beginning of the macro down trend.
4)The price spent months and months under $40 in 22 and 23, however, the price eventually
broke above both EMA 55 and 200 and when EMA55 crossed above EMA 200 in Oct
2023 (red vertical line in the chart), the macro bull trend started.
The current setup (see orange rectangular box in the chart):
1) EMA 55 crossed below EMA 200 on the 4th March 2025.
2) The price moved down to $95 area and sharply moved above both EMA 55 and EMA200. However, it failed to stay above them.
3) The price has been oscillating between $140 and $18. The price is still below EMA55 and EMA200. (see orange rectangular block)
In order to start a strong bull trend,
1) the price needs to close and stay above EMA 55 and EMA200.
2) EMA 55 needs to cross and stay above EMA 200. EMA55>EMA200
3) MACD and RSI need to enter the bull zone.
EMA55 and EMA200 do not cross easily (I mean decisively cross). It only happened three times since 2022, however, when they cross, the price moves very aggressively in one direction.
I think Solana is bullish fundamentally. I am not suggesting it is going to start the macro bear cycle. I am pointing out the price is still not showing a clear direction. From a technical analysis point of view, it might take some time before the trend forms. For now, it is only testing my patience!

SOL - Reaching 200??? Can it be that accurate?? LOLSooooo can you see how accurate it is the way i drew and the way it is going ? Its going to go the way I said, observe and take your stancesss!

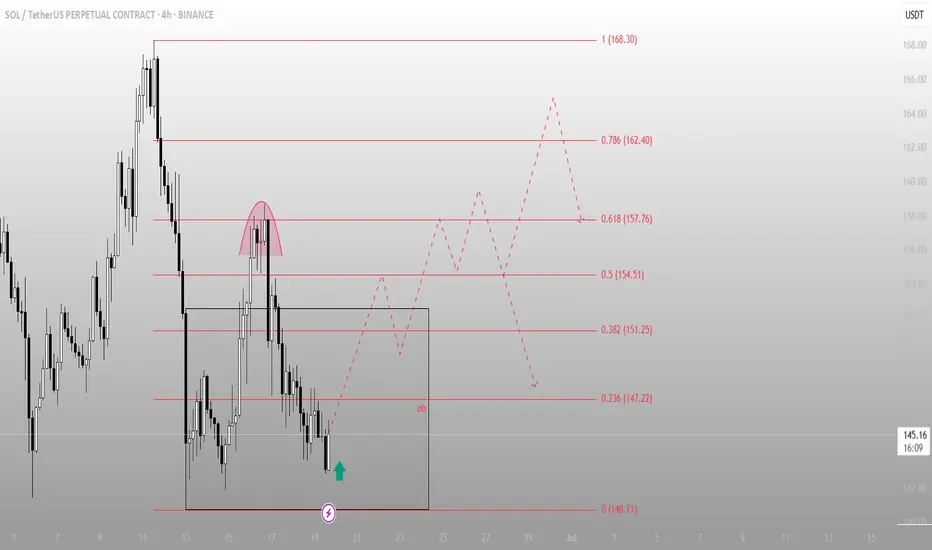
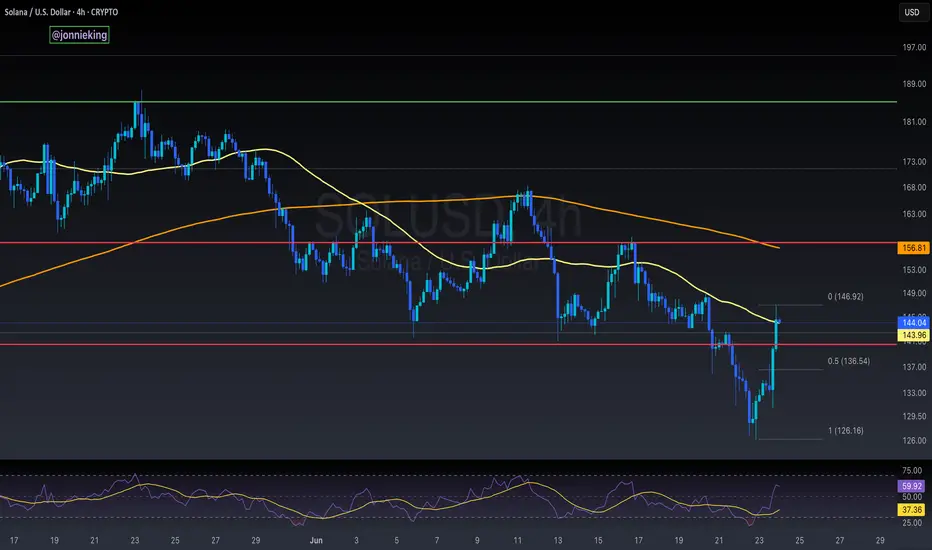
SOL – Sweep & Spring Play at Local DemandWe’ve got a clean rounded top → breakdown → demand sweep setup.
Current price action suggests a potential reversal is brewing.
🔍 What’s happening on this chart?
Rounded top marks a local distribution — aggressive short entries
Price broke lower, swept the demand zone (gray box), and now shows rejection wick + bullish reaction
Fibonacci levels mapped out the structure
0.5 = 154.51
0.618 = 157.76 = key resistance liquidity zone
🎯 Trade idea:
Entry: inside demand zone (OB marked on chart)
Target 1: 151.25
Target 2: 157.76 (0.618)
Full fill: 162.40 – 168.30 (complete inefficiency sweep)
🧠 Mindset:
This setup is classic spring + reclaim. If price consolidates and flips 147.2, upside becomes favorable.
If you like clean trade setups with logic and clear invalidation, check the account bio for more updates and live breakdowns.