HolderStat┆SOLUSD accumulation before growthOKX:SOLUSDT respects the $140 axis and tests the roof of its falling channel. Holding that shelf lets bulls aim for 160-170 and keeps the broader up-channel alive; a dip under 135 would postpone the rally but not derail the long-term trend ⚡️
Solana

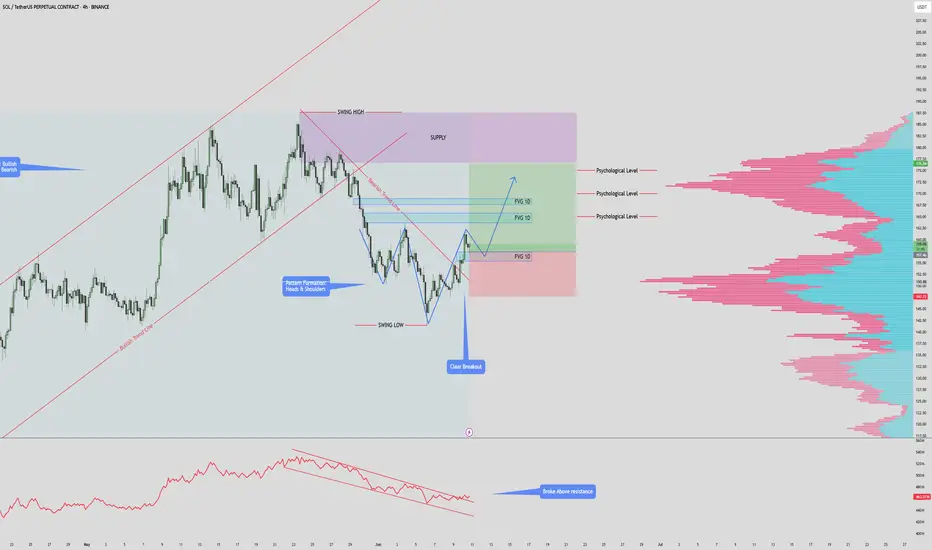
$SOLANA $180 PUMP INCOMINSOL/USDT – 4H Chart Summary
Market Structure:
HTF: Bullish trend remains intact.
LTF: Previously bearish, now showing early signs of a bullish reversal.
Pattern Formation:
Potential Inverse Head & Shoulders forming.
Neckline at $157 — must hold for pattern to complete.
Break above previous high will invalidate Inverse Head & Shoulders.
Trendline & Breakout:
Price has broken above the descending bearish trendline.
Indicates a momentum shift from bearish to bullish.
Fair Value Gaps (FVG):
1D FVG below current price – potential retest & long entry zone.
2x 1D FVG above price – act as targets or supply areas.
Psychological Levels & Volume:
Key levels at $165, $170, $175.
Volume profile shows high liquidity at each of these levels – strong TP zones.
OBV Indicator:
OBV has broken above resistance – supports bullish continuation.
Trade Scenarios:
Bullish Setup:
Long on retest of lower FVG zone ($142–$145).
Target TPs: $165 → $170 → $175 (align with psychological & high-volume areas).
Invalidation:
Break below FVG support or failure to hold above $142.
Short on SOL Here is a short idea on SOLUSDT perpetual contract on Binance.
I also include my overall analysis. I hope you find this useful.
Thank you!
- R2F Trading

SOL/USDT Rejected at Key Fib Zone – Bulls’ Last Stand at SupportRecap and Bias
The short-term bullish “orange” bounce scenario from the previous analysis failed to materialize. Solana’s price was rejected near 150, printing a lower high, and has since dropped back into the mid 140s. This confirms that the recent rally was a dead-cat bounce rather than a trend reversal.
The updated bias is cautiously bearish. This stems from rejection at resistance, weakening momentum, and a deteriorating volume profile. Unless price reclaims the 148 to 150 zone with strength, the bears remain in control. Only a decisive breakout above that level would shift the short-term outlook back to bullish.
Macro Context
Global risk sentiment remains fragile. The sudden escalation between Israel and Iran in early June, including reports of missile strikes, sparked a flight to safety. Solana’s rally quickly reversed, with price dropping over 15 percent since June 11.
Other geopolitical flashpoints also continue to weigh on investor confidence. The protracted war in Ukraine and ongoing disruptions in Red Sea trade routes have fueled broader market caution. This is contributing to periodic risk-off moves and spikes in volatility across both traditional and crypto markets.
On the economic side, uncertainty around US monetary policy is adding to pressure. Although May inflation cooled slightly, investors remain cautious ahead of upcoming Fed decisions. Crypto assets have traded weakly into these events, reflecting a wait-and-see approach.
Taken together, this geopolitical and macroeconomic backdrop is driving elevated short-term volatility and a higher risk premium in the crypto space. In this context, market participants are increasingly hesitant to take large directional bets without a clear catalyst.
One such catalyst may be the potential approval of a Solana ETF. Optimism has grown, with prediction markets now placing the likelihood of approval near 76 percent by late July. If approved, this could be a game-changing event that re-rates SOL’s medium-term valuation and breaks it out of its current downtrend.
Until then, traders should remain cautious and assume headline risk is elevated.
Multi-Timeframe Technical Outlook
Daily and 4H Trend
The high timeframe structure shows a clear downtrend. Lower highs and lower lows are intact. A double top formation from May broke down cleanly. Most recently, Solana was rejected at a key Fibonacci confluence zone around 149 to 151, which included the 0.618 retracement, the 20-day SMA, and a well-defined supply zone.
After that rejection, SOL has traded along the lower Bollinger Band with increasing volatility. The 20 SMA is now acting as dynamic resistance. All major trendlines have broken.
2H, 1H, and 30m Perspective
Shorter-term charts show SOL attempting to base near 143 to 145 support. Several oversold RSI conditions have triggered bounces, but these have lacked momentum. Harmonic pattern recognition shows that a bearish Deep Crab completed near 152, which marked the local top.
Currently, price remains pinned below descending trendlines and the 1H 20 EMA. Bullish momentum has yet to reappear in any meaningful way.
Key Technical Factors
Resistance: 149 to 151
This zone holds multiple levels of confluence. It includes the 50 to 61.8 percent retracement of the last swing, a 1.272 Fib extension, the 20-day SMA, and prior supply. The rejection at 151.7 was sharp and decisive. Unless price reclaims this zone, it remains a ceiling.
Support: 142 to 145
This is the last meaningful support zone holding price up. It is the neckline of a 12H Head and Shoulders pattern and the base of a previous multi-week range. It also coincides with the lower bound of a prior rising channel. The 50-day MA and 0.236 Fib retracement are also near this zone. If this area breaks, sellers will likely target 130 to 135 next.
Momentum: RSI 14 with MA Overlay
Daily RSI rolled over from above 70 with bearish divergence as price topped. RSI is now below its MA across all timeframes, reflecting negative momentum. On the 4H chart, RSI dipped below 30 and remains weak despite minor relief bounces. Lower timeframes show early divergence but no confirmed reversal signals.
Trend Structure
Price continues to make lower highs and lower lows. The 200-day MA was lost weeks ago. The 50-day is now flattening near 140. A death cross recently printed on the 12H chart, confirming bearish short-term pressure.
Volume and PVT
Volume favors the bears. PVT is in decline, showing more volume on down days than up days. The rally to 150 occurred on weak volume, while selloffs continue to show increasing size. This signals distribution, not accumulation.
Harmonic Patterns
A bearish Deep Crab pattern completed at the recent high. No bullish harmonics are confirmed yet. Traders should monitor the 130 to 125 zone for potential bullish completion patterns like a Gartley or Bat. If those form with oversold signals, they could mark the bottom.
Green Scenario: Bullish Breakout Path
Bias
Only valid on confirmed breakout
Trigger
Break and hold above 150. Ideally, an hourly close above 150 or daily close above 152 confirms the move.
Confirmation
Rising volume, RSI reclaiming 50, and a PVT uptick. A retest of 148 to 150 from above would reinforce the breakout.
Targets
First target is 155, which aligns with the 12H 50 EMA.
Second target is 162 to 165.
Extended targets include 170 to 180 and eventually the 200 psychological level if ETF news hits.
Stop Loss
Below 147 or back inside the 143 zone would invalidate the breakout and suggest a failed move.
Logic
If bulls reclaim 150 with strength, this would invalidate the lower-high structure. Shorts would begin covering and momentum could quickly shift. Breakout entries should focus on confirmation and volume expansion.
Red Scenario: Bearish Breakdown Continuation
Bias
Default scenario
Trigger
Clean break below 142. Daily close under 140 confirms the H and S neckline break.
Confirmation
Failing retests of 142, rising sell volume, and RSI staying suppressed. Price action showing impulsive red candles validates the move.
Targets
First target is 130 to 135.
Second target is 115 to 120.
Final measured move would project into the 100 to 110 zone if trend acceleration continues.
Stop Loss
Any reclaim of 145 to 148 would likely invalidate the breakdown and trap late sellers.
Logic
If this support fails, shorts will press. Bounces will likely be sold into. Traders can enter on the break or the first failed retest of 142. Consider scaling out near 135 and trail stops from there.
Strategy Summary
Current Bias
Leaning bearish unless bulls reclaim 150
Key Levels
148 to 150 is breakout zone
142 to 140 is breakdown zone
Trading Strategy
Range traders can play 144 to 150 but must be nimble
Breakout traders should wait for confirmation above 150
Breakdown traders can short under 140 with stops over 145
Risk Management
Volatility is elevated. Trade smaller size. Use tight stops and trail them. Wait for confirmation, not anticipation. Watch ETF news closely. If delayed, expect continued weakness.

HolderStat┆SOLUSD successfully retested the supportBYBIT:SOLUSDT is springing off the 148 mid-channel rail inside a descending-flag bust, shifting retrace into rally restart. Protecting the trend-line keeps bulls in control; clearing 158 opens 172-180 pursuit 🌞
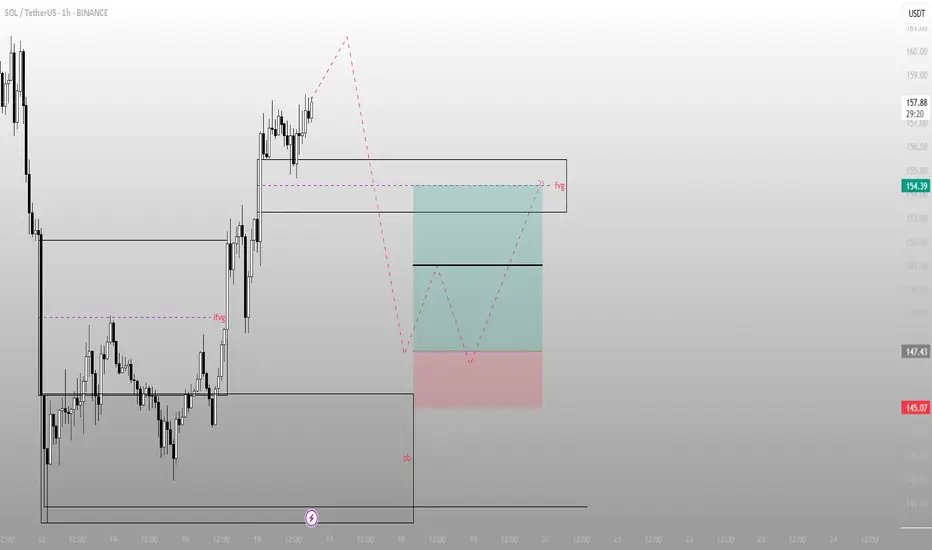
Impulse without purpose? Not in Smart Money termsSOL didn’t just break structure — it filled inefficiency and positioned above. Now price is sitting in the upper FVG, where decisions are made — not guesses.
What just happened:
Price rallied from the OB below and left an IFVG in its wake
Current price is hovering at the edge of a higher FVG, right where liquidity rests from trapped shorts
The move is complete — now it’s about what price does next in this zone of intent
From here, two paths:
Sweep into FVG, reject, and rotate back down toward the 154–147.4 range
React bullishly from mid-FVG, reclaim structure → break to new internal high and keep running
The OB down at 145 is still valid if price unwinds — that’s where Smart Money bids.
Execution view:
Rejection from 158–159 = short bias down to 147–145
Clean invalidation above FVG high
If price consolidates at 154 and reclaims → setup flips bullish
The setup isn’t about what price did — it’s about what it’s preparing for.
You want more trades like this — precision zones, mapped logic — check the profile description.
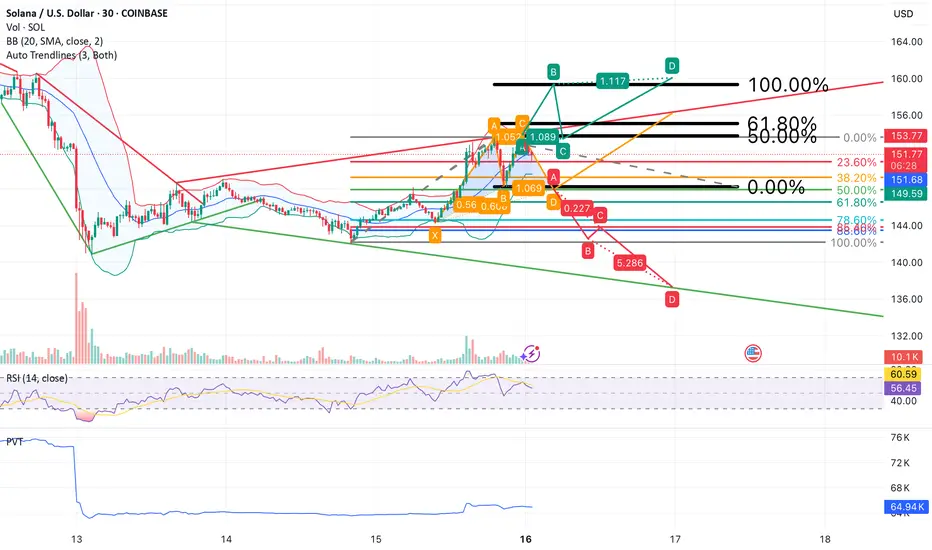
SOL/USDT at Key Inflection Point – Breakout or Rejection?Solana (SOL) is trading at a pivotal zone where price structure, harmonic patterns, and key technical indicators converge. This setup outlines three potential scenarios, guided by fib levels, auto trendlines, and momentum indicators.
Orange Scenario (Moderate Bullish):
Price has recently bounced off the 0.618 Fibonacci retracement (~$149.50), suggesting short-term bullish momentum. However, the orange path indicates a likely move toward resistance around $153–$154.50, where previous structure and upper Bollinger Bands align. Without strong confirmation (e.g., volume spike or RSI breakout), this area may reject further upward movement and trigger a reversal.
Green Scenario (Confirmed Bullish Breakout):
A decisive break and close above $154.50, supported by increasing volume and RSI holding above 60, would signal a breakout continuation. In this case, price may target $158 to $160, completing the bullish harmonic projection and extending the current trend structure.
Red Scenario (Bearish Breakdown):
Failure to hold the $148–$149 zone would validate the bearish harmonic pattern. If confirmed, this breakdown opens room toward lower support zones at $142.50 and $136, especially if PVT weakens further and RSI dips below 50. Downside pressure would likely be amplified by the prevailing downward trendline.
Indicators Used:
Bollinger Bands (BB 20, 2)
Relative Strength Index (RSI 14) with moving average overlay
Price Volume Trend (PVT)
Auto-generated trendlines
Harmonic Patterns (ABCD and XABCD)
Fibonacci retracement and extension levels
Bias:
Neutral at the moment. Awaiting confirmation via price reaction at key support and resistance levels.
Strategy Outline:
Bullish if price breaks and holds above $154.50 (targets: $158–$160)
Bearish if price breaks below $148 (targets: $142.50 / $136)
Short-term scalping opportunity within $149–$153.75 zone pending further clarity
*This analysis is for informational and educational purposes only and does not constitute financial or investment advice. Trading cryptocurrencies involves significant risk and may not be suitable for all investors. Always conduct your own research and consult with a licensed financial advisor before making trading decisions. The author is not responsible for any losses incurred from reliance on this analysis.*
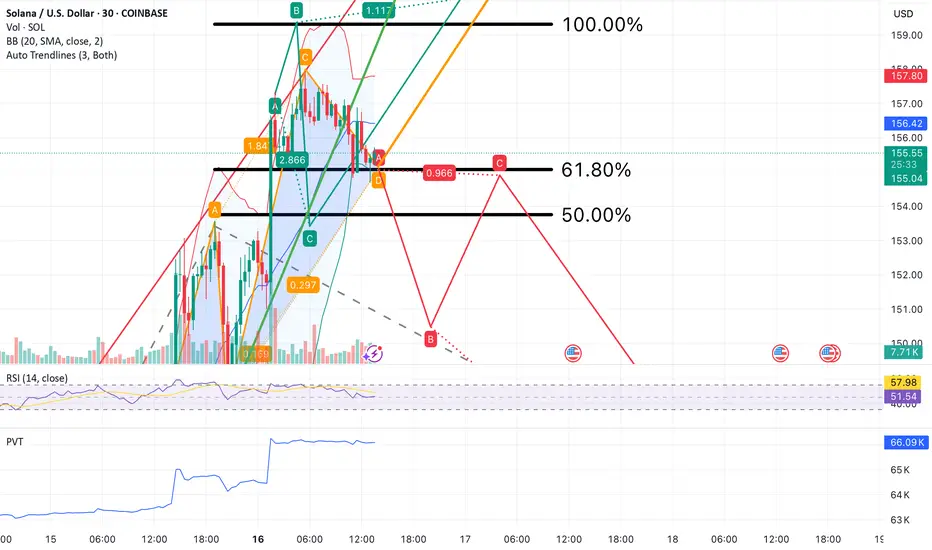
SOL/USDT at Key Inflection Point – Breakout or Rejection? Part 2Solana (SOL) is trading at a pivotal zone where price structure, harmonic patterns, and key technical indicators converge. This setup outlines three potential scenarios, guided by Fibonacci levels, auto trendlines, and momentum indicators.
Green Scenario (Confirmed Bullish Continuation)
A sustained hold above $155, especially if followed by a breakout through $156.50 with rising volume, would confirm the green path. This scenario reflects short-term bullish momentum strengthening, as RSI remains near 60 and PVT continues to climb. If confirmed, price may extend toward $160, with secondary targets in the $165–$172 range, aligning with the upper ascending trendline and harmonic extension.
Orange Scenario (Sideways-to-Bullish Consolidation)
This scenario becomes increasingly likely if SOL remains range-bound between $153.50 and $157.80. This consolidation zone overlays the 50–61.8% Fibonacci levels, Bollinger Band basis, and several key trendline intersections. With RSI holding in the 55–65 range and PVT stable, this setup would favor re-accumulation before another breakout attempt. Price action above $155 continues to support this scenario as the base case.
Red Scenario (Bearish Breakdown)
A breakdown below $153.50, especially if followed by a breach of $150 on high sell volume, would invalidate the bullish thesis. This scenario opens downside risk toward $147.35 and potentially $144.00–$140.00. RSI would likely drop below 50, and a flattening or declining PVT would confirm distribution. This path aligns with the broader red trendline and would indicate a rejection of the recent bullish breakout.
Indicators Used:
Bollinger Bands (BB 20, 2)
Relative Strength Index (RSI 14) with moving average overlay
Price Volume Trend (PVT)
Auto-generated trendlines
Harmonic Patterns (ABCD and XABCD)
Fibonacci Retracement and extension levels
Bias:
Short-term bullish if price holds above $155. Market structure, RSI, and PVT favor upward continuation or consolidation. A break below $153.50 would shift the bias toward neutral or bearish.
Strategy Outline:
Bullish if price breaks and holds above $156.50
Targets: $160 / $165 / $172
Bearish if price breaks below $150.00
Targets: $147.35 / $144.00 / $140.00
Scalping opportunity in the $153.50–$157.80 zone while awaiting directional confirmation
**This analysis is for informational and educational purposes only and does not constitute financial or investment advice. Trading cryptocurrencies involves significant risk and may not be suitable for all investors. Always conduct your own research and consult with a licensed financial advisor before making trading decisions. The author is not responsible for any losses incurred from reliance on this analysis.**
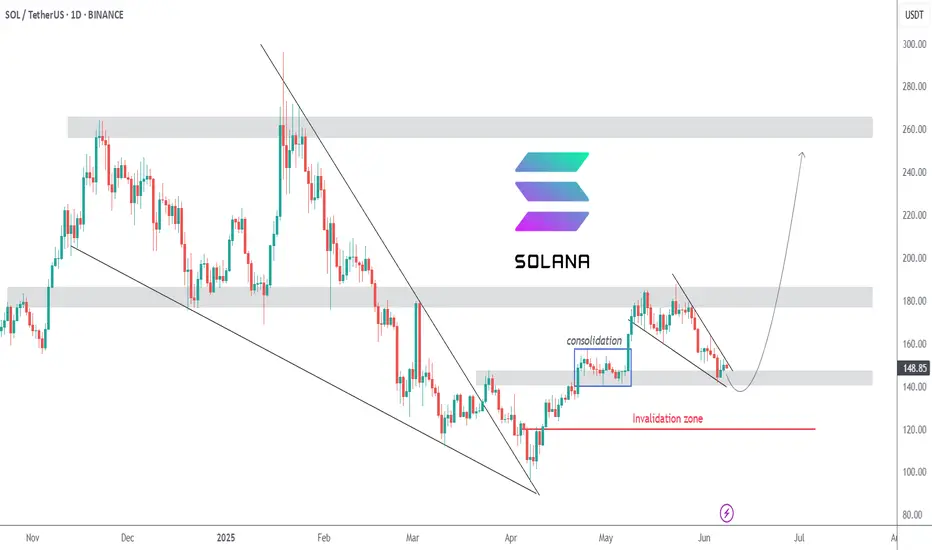
SOLUSDT | The Final Liquidity Hunt | $250 is the Next StopSOLUSDT is currently in an uptrend after recently breaking out of its extended downtrend to $95 which took out millions of long positions. Now, we are seeing yet another extended downtrend on the lower time frame, but the overall direction is still up.
Last week, price action printed two very bullish pinbars at the $155 level which could have been considered support, where price was consolidating around late April. High leverage traders entered here and eventually got liquidated last Friday.
Following the liquidity hunt, price reversed quickly, but not strong enough to reclaim the $155 zone. Many of those who were liquidated likely re-entered on this fast move, thinking that the liquidity hunt is over and price cannot move lower.
I am anticipating one FINAL move down to $140 before the uptrend resumes. This will be the move that takes out the dumb money and where smart money will take their positions. The alternative is that the liquidity hunt never happens, and price breaks out of the falling wedge to resume its uptrend.
What about macro and micro factors?
⚖️ Ripple vs SEC Case
On 8th May, both parties agreed to settle, which ignited a massive market-wide rally. Unfortunately, their filings were rejected due to a procedural issue. The next deadline for refiling is on 16th June. Once accepted, we can expect another massive rally.
🤝 US-China Trade Talks
This week, US and China will meet at the negotiation table again. On 12th May, US & China reached a deal in Geneva and sent markets on another rally. IF (big if) they come to another deal this time, we can expect another rally.
✂️ Fed Rate Cut Expectations
The Fed talked about cutting interest rates in late 2025. They are currently in a "wait and see" stance however, due to uncertainties. Eventually we will see a rate cut, and I believe this would be a "buy the rumor, sell the news" event. Markets will price in the anticipated rate cut before it happens later this year.
Our first price target is $250.
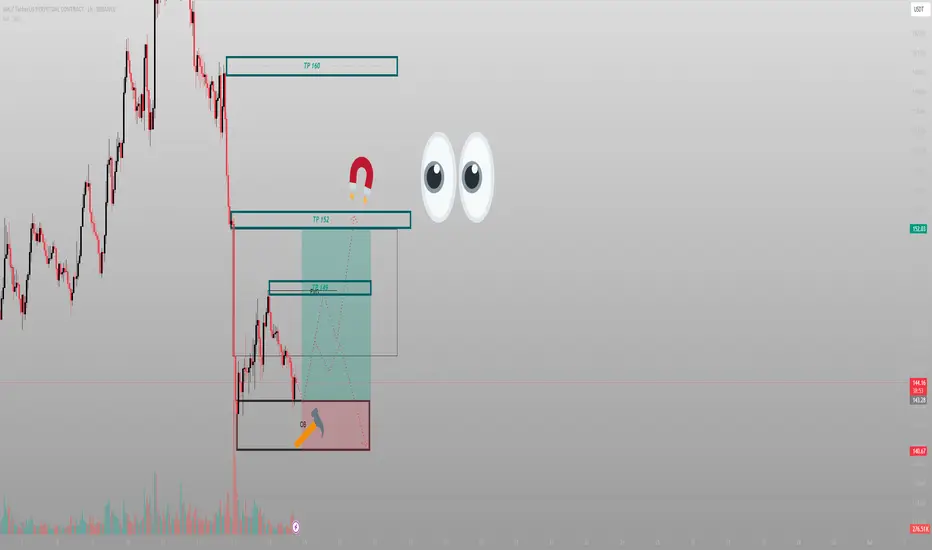
They saw a crash. I saw where the next rally beginsThis isn’t chaos. It’s sequence. SOL sold off into a well-defined 1H OB, paired with a high-volume low. Price didn’t break. It anchored.
The setup:
After an aggressive dump, price settled into an Order Block between 140–143. This isn’t weakness. It’s rebalancing. Right above? A perfect FVG at 149 and inefficiency zones that align with liquidity draws at 152 and 160.
Volume is telling — it spiked into the OB, not on exit. That’s how Smart Money positions.
Expectation:
Accumulation near the OB → quick reversal → reclaim 145
From there, watch price reprice through:
TP1: 149 (FVG reclaim)
TP2: 152 (full inefficiency fill)
TP3: 160 (external liquidity sweep)
Any deeper dip below 140 becomes a deviation — not a breakdown — unless structure is violated with follow-through.
Execution:
Entry: 141–143 zone
SL: Below 139.8
TP1: 149
TP2: 152
Final: 160
This is engineered — not emotional.
Final thought:
“You don’t need to predict the bottom. You just need to know where price is built to return.”
Solana Weekly TF, Good NewsI've gone deeper into Solana's chart and I have good news... You are looking at the weekly timeframe.
I looked at EMA34 and MA200 for some of the major Crypto projects, Bitcoin, Dogecoin, XRP, Cardano and Ethereum. You can find these in my profile @MasterAnanda.
Some were clearly bullish as the action was happening above both moving averages, others were mixed and one was bearish.
Solana is trading below EMA34 weekly but safely above MA200.
MA200 weekly sits at $100 for SOLUSDT.
There is another level of relevance, EMA89. On this chart shown as a blue line and this is the good news. EMA89 is working as support, it worked last week and this week it still holds. This same level matches perfectly the 0.5 Fib. retracement support relative to the move from 7-April to 19-May.
This is all to say that we are looking at a strong support zone, which means that it is likely to hold. If it breaks, it should be brief followed by a recovery right away.
Namaste.
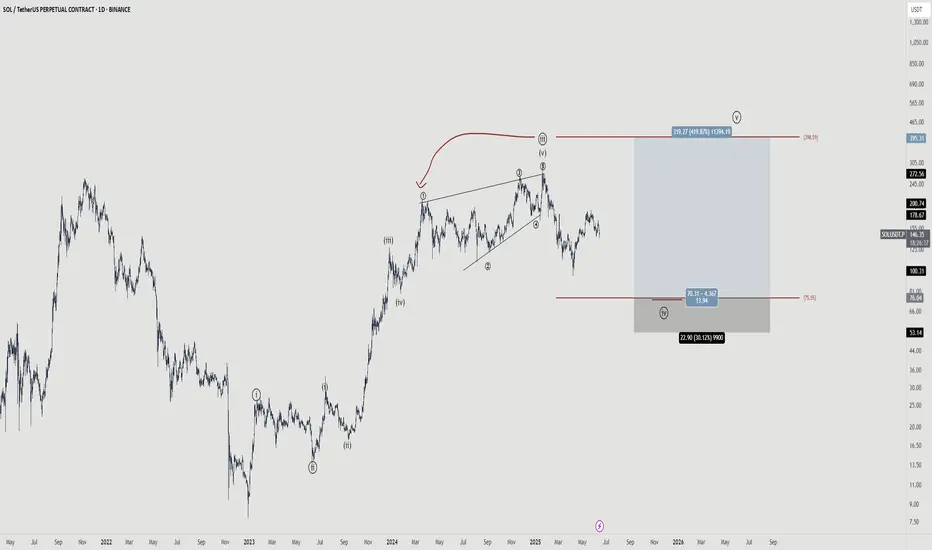
Solana - Your chance to be a millionaireThere is a 50/50 chance that we have topped...
The wave structure is very indicative of a completed impulse. However, i'm betting that we are just in a complex wave 4 and if this is the case, we should see a wave 5 taking out the high.
The risk to reward is pretty nice and playing spot will pay off.
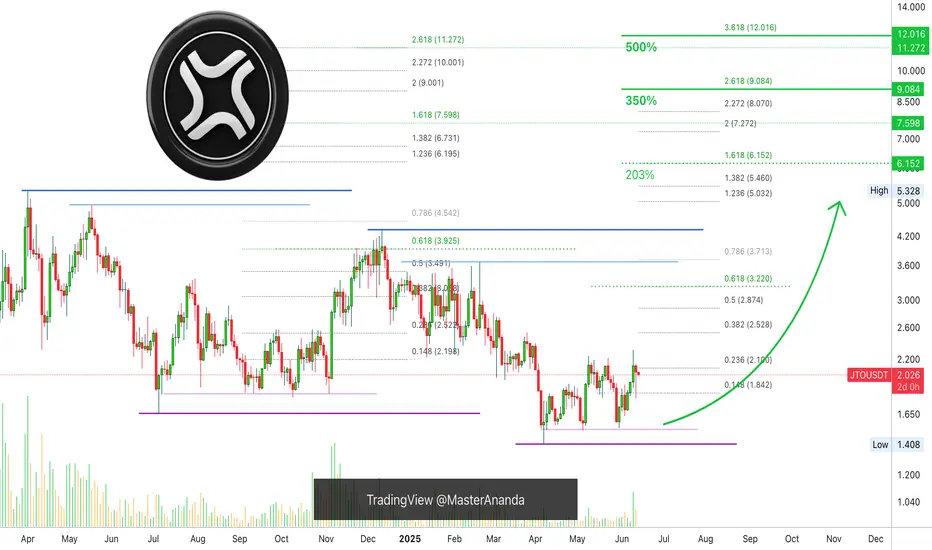
JITO Long-Term Accumulation Phase, Whales, Exchanges & 500% PPThe same market conditions prevail on this chart as with many other altcoins. The low is in. The low has been in for months, since 7-April 2025.
The advance has been happening very slowly and this is good. There will be a point where everything is up "out of the blue." No blue here, no surprise. When you see everything goes up 300% or 500% in a matter of weeks, remember that first the market was sideways for months.
This sideways period is the consolidation-accumulation phase and this phase is when the bulls amass strength. Whales are loading. It takes a while because liquidity is not strong on these pairs so it takes months and months for the whales to be able to inject hundreds of millions into the market. If all the money was injected in a matter of days or weeks, it would be chaos, that's why it takes time for a bullish wave to develop.
This phase can last anywhere between 3-6 months. Some pairs already moved ahead and produced some growth. This growth is corrected, it is just like saying, "Hey calm down, not so fast..." And the exchanges put selling pressure on the market to reduce prices so the whales have more time to accumulate. Retail is always anxious, whales are always patient.
Accumulation can only go for so long. It is like a pressure cooker. Pressure builds up and boom! There needs to be a release, the release here is experienced as a very strong wave of growth.
To be honest, the story is irrelevant, only one thing is relevant if you are here for profits, to make money, to trade; Buy when prices are low and hold. Wait patiently for prices to grow. Sell when prices are high.
Only one thing matters, entry prices and timing.
If you get the right price and the right timing, you will do great. We are witnessing a long-term accumulation phase. It is reaching its end.
Cryptocurrency will grow.
The Altcoins will grow.
Bitcoin is already too strong.
Patience is key.
Thanks a lot for your continued support.
Namaste.
HolderStat┆SOLUSD exit from the formationBINANCE:SOLUSDT
→ Bounce off 150 trend-line fuels channel grind
↳ Reclaim 163–165 then pierce 180 cup-rim
⇢ Targets 190–195 upper rail, even 205+
⤴ Slip < 157 reroutes to 150 demand, < 148 turns bearish
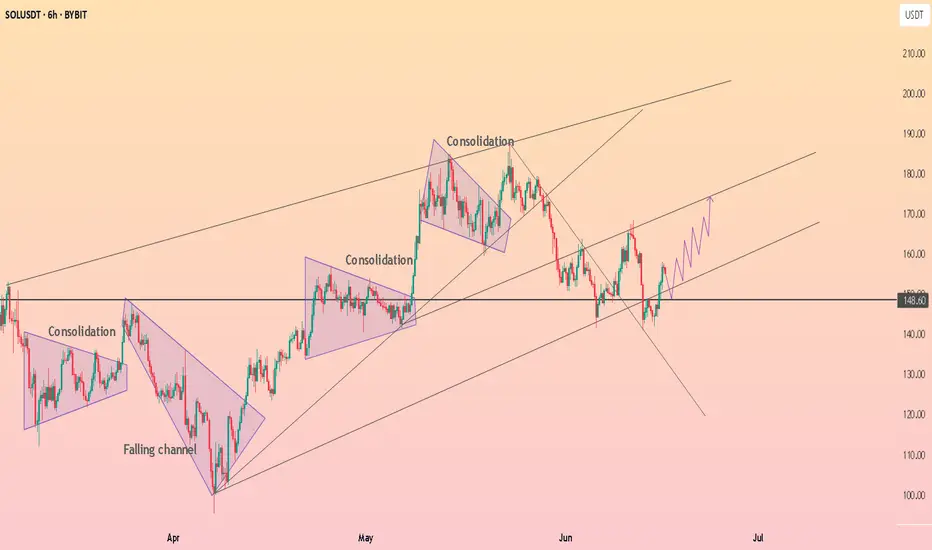
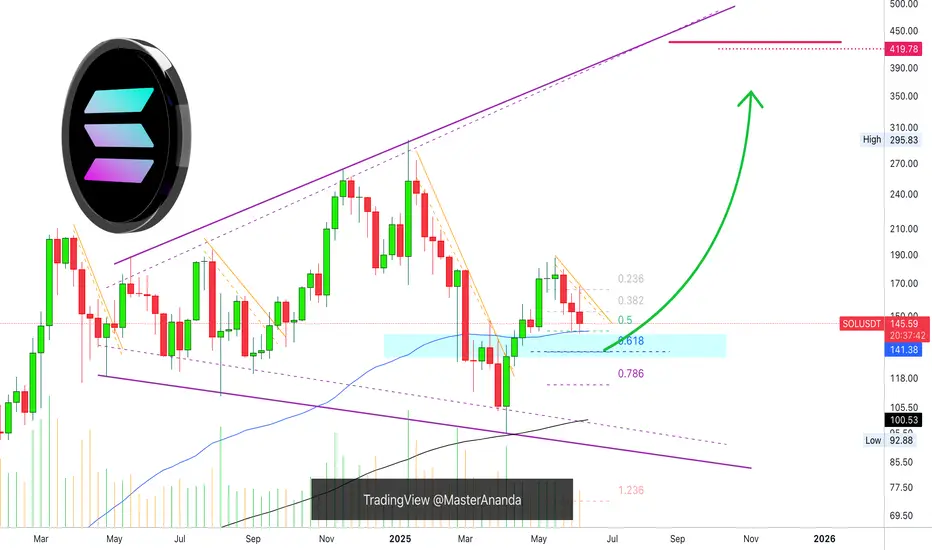
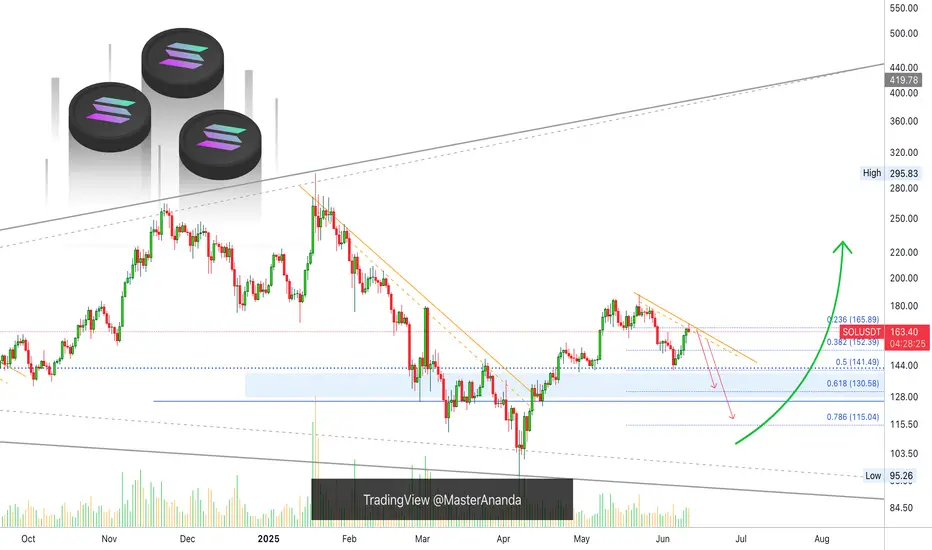
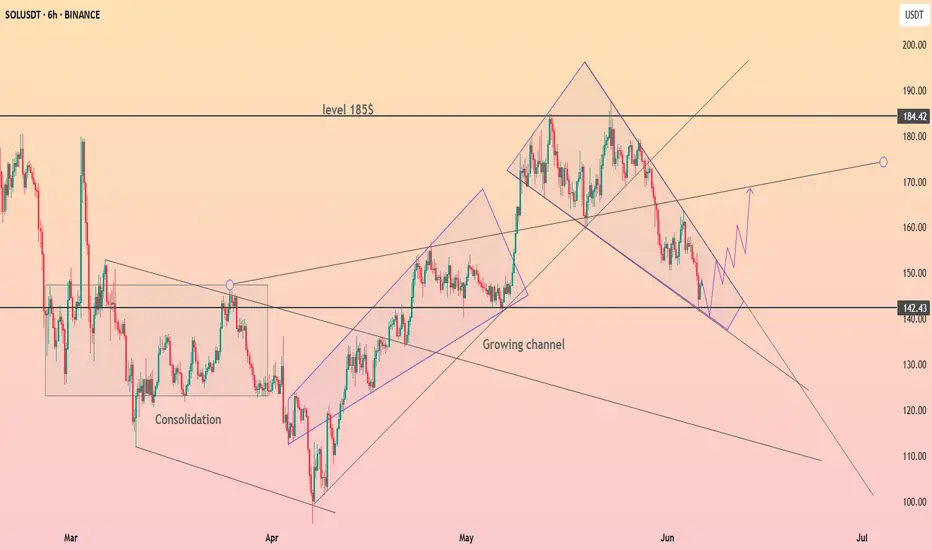
$SOL - Ready for a STRONG Comeback to $300!Throughout 2024 Solana has been moving within the Massive Ascending Channel . It does these days too.
Recently, back in March 2025, there was a fake breakdown of the channel's ascending support. It ended up with a strong pullback above the line. Moreover, the descending trend line that was initially formed in February 2024 was also broken upwards.
Signs of strong bullish volumes.
At the moment the price is consolidating above the EMA500 of 1D chart (EMA70 of 1W) , just as it did back in November 2023 before the famous x7 rally from $30 to $210.
Breakout of the 0.382 lvl by Fibo will mark the beginning of a new rally upwards. Target for this upward movement on CRYPTOCAP:SOL is $320 , must be reached in 2025.

Solana's Retrace Isn't Over, Lower HighSolana's retrace is not over, some weakness is showing up on the chart. Here we have a strong lower high on the daily timeframe coupled with very low trading volume. Low trading volume at this point signals that buyers are just not present. When no new buyers are present, the market will continue in the same trend. The trend is the drop that started 19-Jan, confirmed 23-May with a lower high. Today, a local lower high points to even lower prices.
Once the retrace is over, we can expect a new wave of growth; for now, we have to step back and watch (SHORT) until a new support level forms. When support is in, we can again buy (go LONG).
Sell at resistance, buy at support.
Adapt live to market conditions.
Thanks a lot for your continued support.
Choose wisely. Be smart.
Namaste.
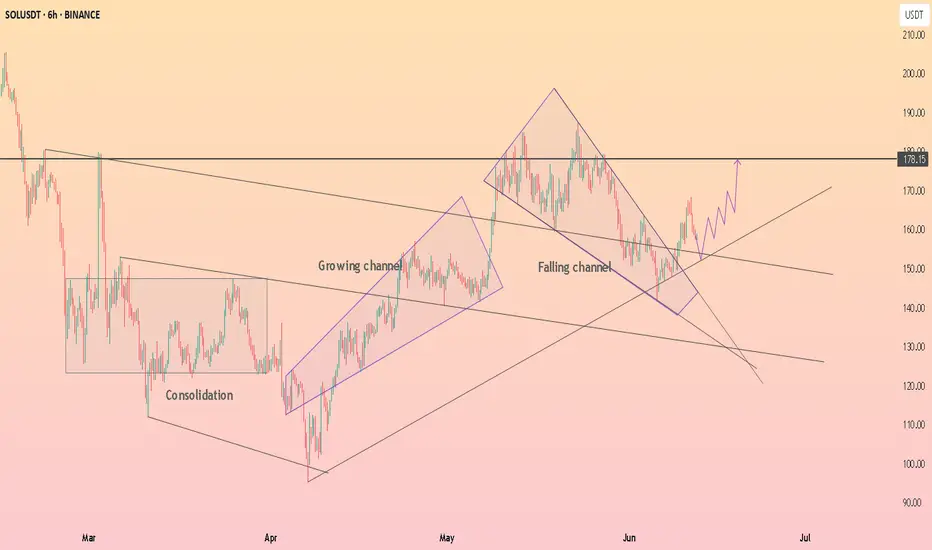
HolderStat┆SOLUSD reached resistance lineCRYPTOCAP:SOL just flipped the 157 pivot into support after escaping a falling channel and retesting the up-trend. Holding here fuels a run toward the 170 trend-cap and 180 supply shelf; failure invites 150 again. Growing channel, consolidation clusters, breakout watch.

Already ready to go longMy bias for Solana is super bullish. I invest in Solana and I think it is still a good price to buy and hold, but I am planning to trade with leverage.
Currently, Daily EMA200 is dead flat and running across the candles.
MACD moving to the upside but still in bear territory.
There is a bullish momentum building up, however, there is a large sell order block sitting above the current price area, and the price can oscillate around EMA200. The similar situation is marked in the blue rectangular box in the chart.
I will open a long position when:
1) EMA 21 >EMA55> EMA200
2) MACD lines cross and move in the bull territory.
3) a daily candle closes above EMA21. (see red vertical line)
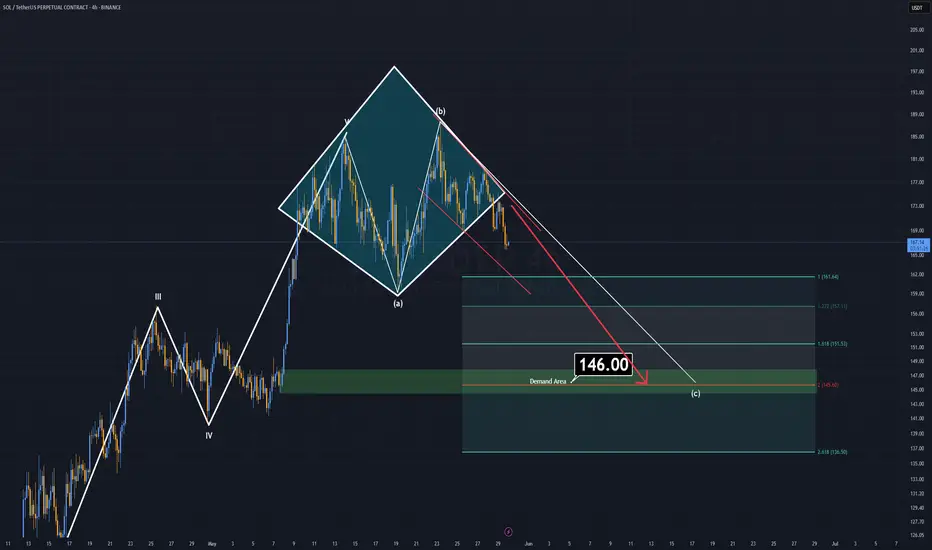
Red Lights for SOLANASolana has recently completed its 5-wave impulsive rise, and now a correction phase appears to be underway. Notably, a diamond top formation has formed and already broken to the downside, further supporting the short-term bearish outlook.
As long as SOL trades below the $180 resistance, this corrective scenario remains valid.
I currently do not expect a drop below the $146 support zone, making this a structured micro pullback within a larger bullish macro trend.
This setup offers opportunities for both short-term short and long entries, depending on how the price reacts near key levels. While the macro structure and fundamentals remain highly bullish for Solana, this correction could provide an ideal re-entry point before the next major leg up.
— Thanks for reading.
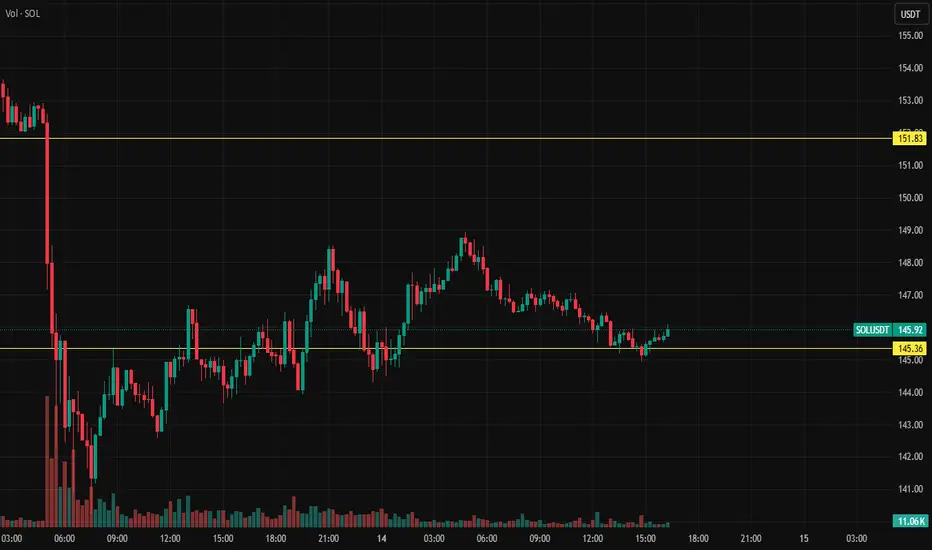
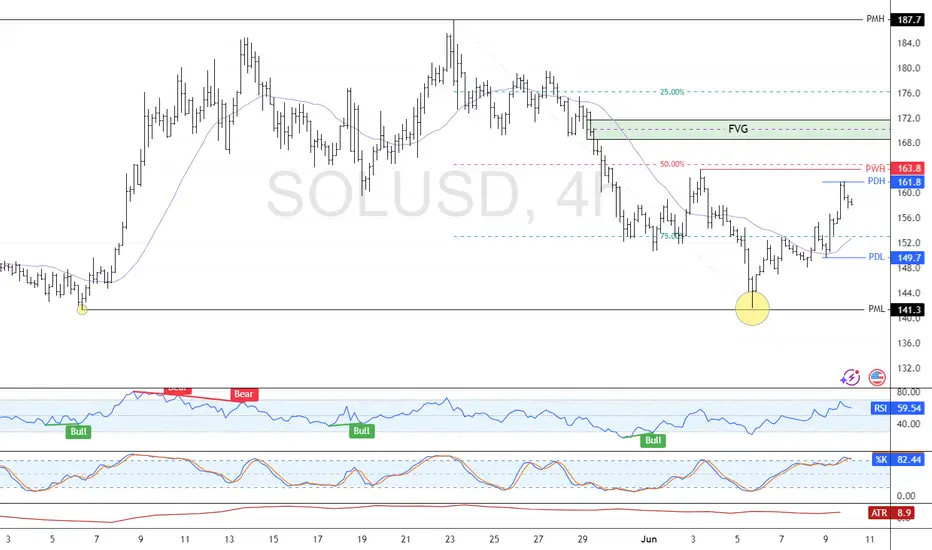
Solana: Bearish Outlook Between $163.8 and $170.FenzoFx—Solana formed a double bottom at $141.3, making this level a target. We are bearish on Solana between the $163.8 and $170.0 resistance.
The target is $149.7, followed by $141.3.
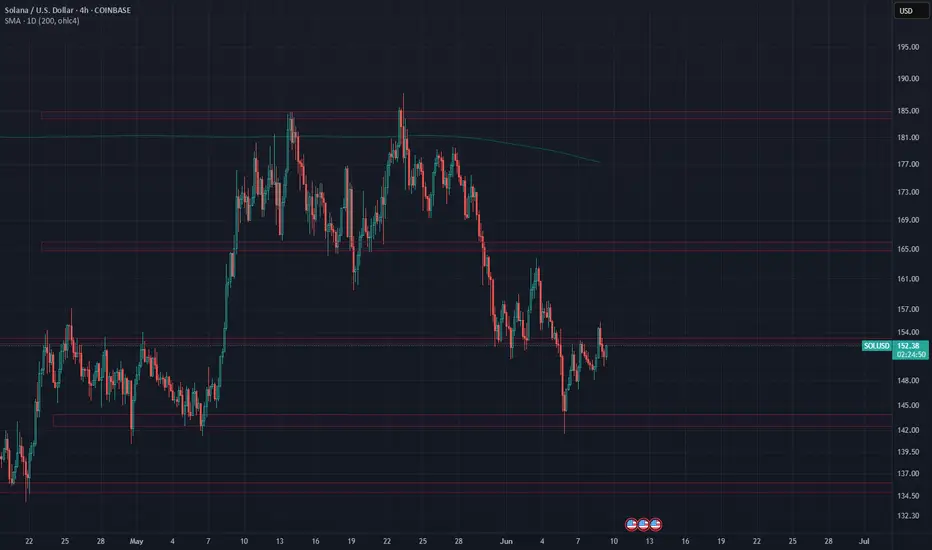
HolderStat┆SOLUSD rebound from 142CRYPTOCAP:SOL just kissed 142 support at the base of its growing channel. Solana price slips from a descending wedge, and holding above trend could propel bids toward 155, then the 170-184 supply band; lose the line and 125 beckons.
Is there hope for Solana?After a retest of support around $142, SOL is testing previous support as resistance around $152.
A strong break and retest of the $153 area could signal price reclaiming support and heading towards $166.
Failing to do so could lead to a retest and confirmation of $140 as support. Of course, losing support would signal further weakness towards $136 before a reversal potentially taking place.
As mentioned before, price is still trading below 1D 200MA, which could either be signaling weakness or the potential for more upside.
Considering the downward direction of the 1D 200MA could also be a bearish signal, however, this also usually happens before a reversal.