Solana nears an important resistanceSolana nears an important resistance, but here’s why bulls can prevail
Trading volume wavered; negative sentiment increased
The $22.4 level was pivotal to bullish hopes of a rally to $23.7 and beyond, but the bears stood their ground and have not weakened yet.
The H4 market structure was bearish after the higher low at $22.9, formed on 29 April and broken on 1 May. Since then, SOL bulls were unable to break the recent lower high.
If Solana can see a 4-hour trading session close above $22.49, it would indicate a shift in market structure to bullish once again.
The bearish bias on H4 was outweighed by the bullish market structure on the daily timeframe. Yet, in order to initiate a rally, the bulls must consume all the sell orders placed at the $22.4 resistance zone.
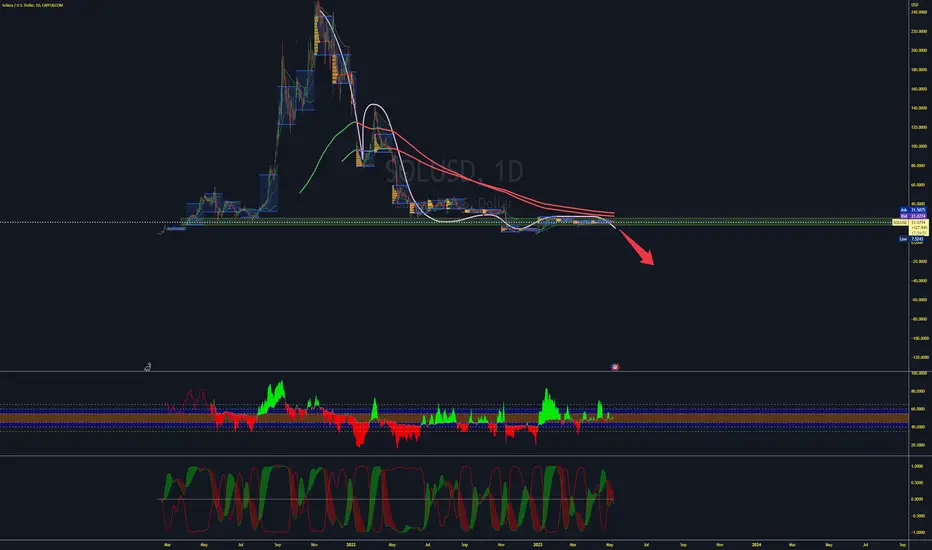
The Visible Range Volume Profile tool showed that the Point of Control (red) was at $22.18, which demarcated the level where the highest amount of trading in the past five weeks has taken place. Therefore, the bears will likely put up a stiff fight.
The OBV was flat in May, and the MACD formed a bullish crossover beneath the zero line. When combined, they showed that momentum was weakly bearish, but neither bulls nor bears were dominant.
Hence, traders can wait for a breakout past $22.4 and a subsequent retest before buying SOL, targeting the Value Area High at $23.7 to take profits.
Solana faced another price rejection at the FVG zone of $23.2 – $24.0. The pair could retest the zone again.
Solana suffered over 5% losses in the past seven days. It saw rejection at $23.99 on 30 April and traded at $22.16 at press time. On the daily front, the “Ethereum killer” was only up by about 0.12% in the past 24 hours.
Despite its daily and weekly dismal performance, SOL could offer an exciting opportunity for swing traders if a pullback retest occurs at the immediate support level. At press time, Bitcoin struggled to cross FWB:29K and could trigger SOL to retest this key support.
The sharp drop on 19 April left an FVG (fair value gap) between $23.19 and $24.01. Price action filled the zone on 19 and 30 April, leading to a sell-off. The drop retested $21.27 support, followed by a rebound that faced rejection at the same FVG zone.
A pullback retest at the $21.27 support and confirmed uptrend could offer a new buying opportunity, targeting the immediate obstacle at the FVG. The stop loss will be $20.36, just below the support.
A close below the support zone near $21.27 will invalidate the above bullish thesis. The support has proven steady since the second half of April and will indicate a weakening structure if it cracks. Such a downswing could see SOL retest at $19.92 or March lows of $17.30.
The RSI fluctuated near the median level – indicating the buying and selling were equal in the same period. Similarly, the CMF (Chaikin Money Flow) hovered near the zero mark – evidence of fluctuation between outflows and inflows of money into SOL’s market.
According to Santiment, SOL saw significant fluctuations in trading volume since the end of April. At press time, the volume declined further, limiting prospects of a strong recovery. As such, SOL could retest the support if more price slump hits it.
The negative sentiment also deepened at the time of writing as funding rates flipped to negative. It shows investors’ confidence in the asset was dented, and demand in the derivates market faltered. However, a bullish BTC could quickly change SOL’s fortune.