SOLUSDT on Fire! Bullish Wedge Fuels INSANE Upside Potential!BINANCE:SOLUSDT has been exhibiting strong bullish momentum, currently trading within a broadening wedge pattern. This technical structure often signals increased volatility and the potential for decisive moves in either direction. In the present scenario, the breakout above the psychological $200 resistance level suggests that bulls are firmly in control, fueling hopes of further upside.
The continuation of momentum hints at the market preparing for another leg up. The immediate price target lies at $300, where traders may expect some profit-taking and resistance. However, should momentum sustain and buying pressure persist, BINANCE:SOLUSDT has the potential to surge toward the $700 region, aligning with the pattern’s projected price expansion.
As always, managing risk is key. Use a well-placed stop loss below the support level to protect your capital. Breakouts can be explosive, but discipline and proper risk management make all the difference.
BINANCE:SOLUSDT Currently trading at $201
Buy level : Above $200
Stop loss : Below $150
Target 1: $250
Target 2: $300
Target 3: $500
Target 4: $700
Max leverage 2x
Always keep stop loss
Follow Our Tradingview Account for More Technical Analysis Updates, | Like, Share and Comment Your thoughts
SOLUSD

HolderStat┆SOLUSD retest of the $200 levelOKX:SOLUSDT has cleared $175 and continues pushing higher. $185 is the next key level. Support sits near $169 in case of a pullback.
SOL is preparing for new ATHSOL / USDT
Solana didn't make a move since long time but i think its time will come very soon
Currently SOL is trying to breakout the most important key level in chart
Breaking out here => very high chance of making a new ATH
For those who interested in SOL …its the time

DeGRAM | SOLUSD seeks to the $220 level📊 Technical Analysis
● After reclaiming the mid-June swing cap 185 (now support) price accelerated along a steep parabolic fan; the move completed a 1:1 extension of the early-July flag yet leaves room to the channel crest near 220.
● Structure shows successive closes above the March–July internal resistance line; momentum pull-backs are respecting the fan base at 190, indicating healthy trend continuation toward the next fib / rail confluence at 219-222.
💡 Fundamental Analysis
● FXStreet notes Solana’s daily active addresses just hit a 12-month high, while CoinShares reports a fourth straight week of SOL-focused ETP inflows—evidence of strengthening network use and institutional demand.
✨ Summary
Buy 190-195; hold above 185 eyes 205 ▶ 220. Long thesis void on a 16 h close below 175.
-------------------
Share your opinion in the comments and support the idea with a like. Thanks for your support!

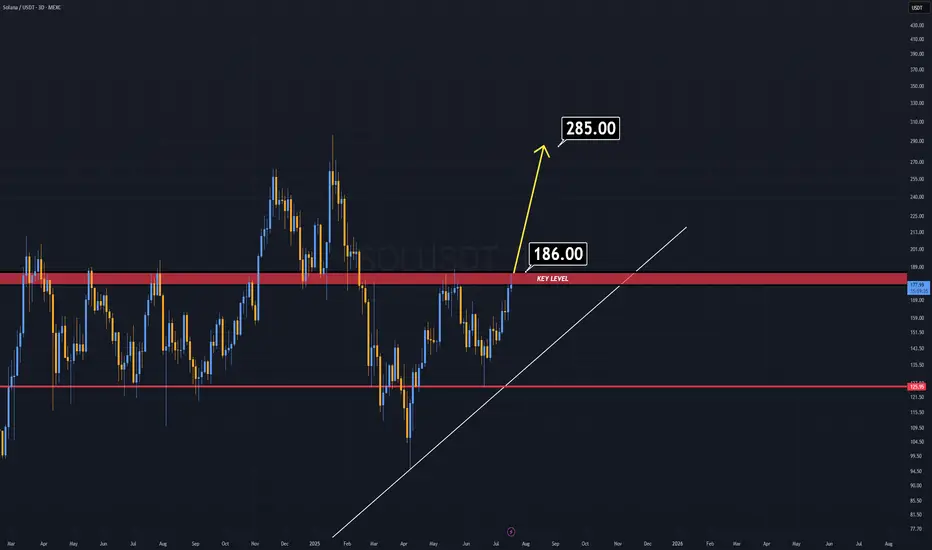
SOL Analysis (3D)There is no need to explain why if you are in this market for a while.
A weekly candle close above $186 will ignite a rally on SOL.
The important key word in here is "weekly" , not "daily" .
Good Luck.
SOLANA DRIVING UP TO 294 Good evening everyone
It looks like SOL made a nice W pattern and now breaking its weekly high is driving up to 294
Enjoy happy trading this bull run
Kris/ Mindbloome Exchange
Trader Smarter Live Better

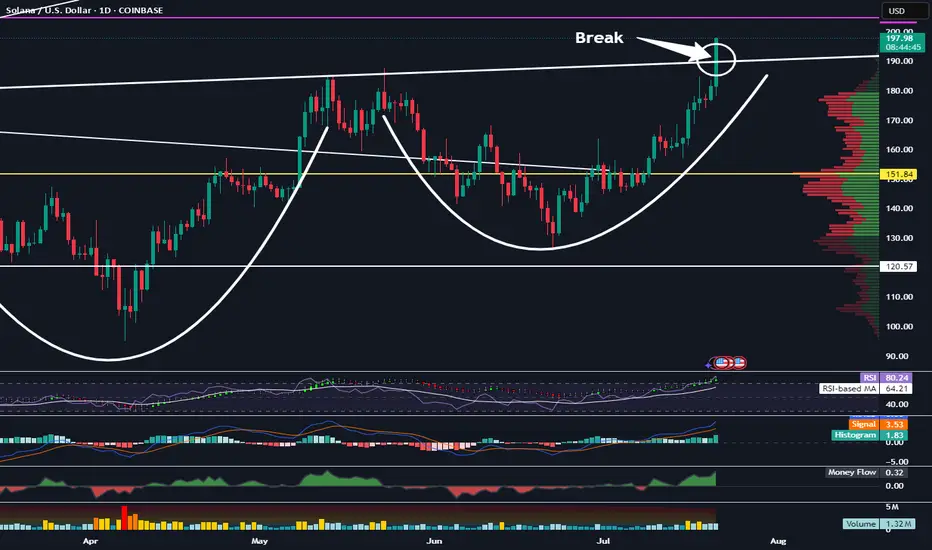
Solana Has Broken This Important Resistance LevelTrading Fam,
Things are definitely heating up in the altcoin space. Two big key movers are ETH and SOL. Right now SOL has broken a very important resistance level in the neckline of this inverse H&S pattern. Watch closely. If the body of our daily candle closes above this today and remains above it tomorrow, this pattern is in play and our target would be around $275.
✌️Stew
Solana Enters Bullish TerritorySOL has been showing strength since it reclaimed the 1D 200MA last week.
Currently trading around $192 - above May's highs - continued bullish momentum could see price test Jan highs around $270.
Until then, any retracement could be a buying opportunity.

SOL Breakout Fueled by Momentum — $165 Flip Holding StrongSolana continues its strong uptrend after reclaiming key structure. Price broke out above the $165 resistance zone and turned it into support — a classic continuation setup.
What makes this move stand out isn’t just the structure, but how clean the momentum confirmation has been throughout.
The **MACD Liquidity Tracker Strategy** — designed to filter signals based on both trend alignment and momentum compression — flagged a long around the $155 reclaim.
From there, we saw rising histogram bars, a clean crossover, and price action that respected the entry all the way up through consolidation.
This type of strategy doesn't just look at MACD crosses alone.
It analyzes whether liquidity is *compressing or expanding*, and filters trades based on whether there's actual follow-through potential — especially useful in choppy markets like what we saw in late June.
This latest run is a good example of how pairing structure (support flips, key reclaims) with smart momentum filters can keep you in the move — and out of the chop.
We’re watching to see how SOL behaves above $180 and whether momentum sustains into higher resistance zones.
—
#SOLUSD #Solana #MACDStrategy #MomentumBreakout #SupportFlip #TradingEdge #BacktestBetter #QuantTradingPro #CryptoTrading #TradingView

SOL: Clean Fakeout & Two Bearish Scenarios AheadHello guys!
Price just created a textbook fakeout above the resistance zone, grabbing liquidity and quickly dropping back into the range!
Here’s what the chart is showing:
Price is still inside the ascending channel, but the breakout attempt failed
The MPL (maximum pain level) around $162.30 is the key downside target
Two possible paths:
S1: Direct drop from here toward the MPL
S2: Another move up to retest the highs or form a lower high before the deeper drop
I think the S2 is more probable!

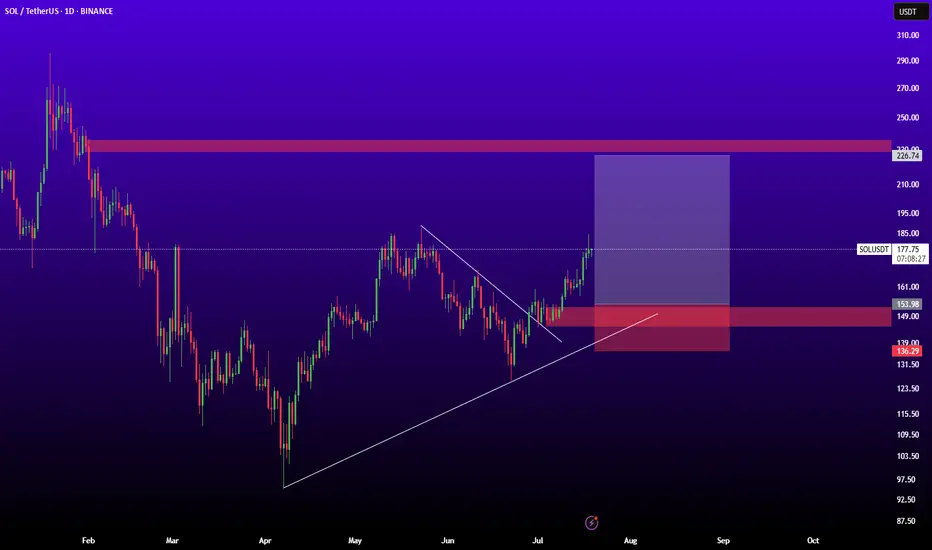
SOLUSDTThis signal for bull-trend because breaked trendline and higher high higher low.
best entry: 154
stop: 136
traget: 226
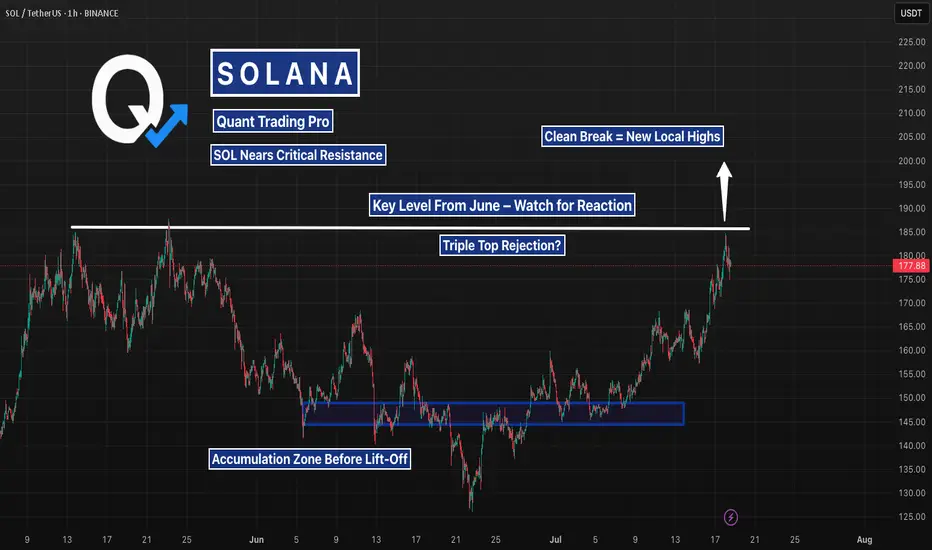
Solana Testing the June Breakdown Level — Decision TimeAfter weeks of slow grind, SOL is now pressing into a level that triggered a major selloff in June. A clean breakout here could flip momentum hard — but if buyers stall again, a short-term double top could catch late longs off guard. Watching $185 closely.
SOL/USDT Technical Outlook – Breakout Holding, Eyes on 175+Solana has successfully broken above the key resistance zone at $155–157 and is currently testing it as new support. If the level holds, this breakout could extend toward the next major target around $175–178.
📌 Key Insights:
Clean breakout followed by a potential SR flip
Watch for confirmation of support before continuation
Target aligns with previous swing high
Invalidated on breakdown below reclaimed level
🟢 Bias remains bullish as long as price holds above the breakout zone. A confirmed retest could provide a high-probability long setup.

DeGRAM | SOLUSD seeks to confirm the breakout📊 Technical Analysis
● Bulls pushed back inside the broad rising channel and pierced the five-week gray trend-cap; the breakout has been retested at the 147-150 pivot (green strip), now acting as support.
● Price is carving a tight bull-flag on diminishing volume; its 1.618 swing and the channel median intersect with the May swing high near 173, while the upper rail aligns with 187-190.
💡 Fundamental Analysis
● VanEck’s late-June 19b-4 filing for a US spot Solana ETF trimmed perceived regulatory risk, and Firedancer’s public test-net timeline lifted developer sentiment, both fuelling fresh inflows.
✨ Summary
Long 147-150; flag break above 155 targets 173 → 187. Invalidate on a 16 h close below 140.
-------------------
Share your opinion in the comments and support the idea with a like. Thanks for your support!

SOLANA SOL 1WThis coin is showing very interesting development, and the market maker seems to be painting clear structural patterns.
🔷 Macro Structure: Rising Triangle
On the higher timeframes, we can clearly see a rising triangle formation taking shape. If this pattern breaks out to the upside, the potential measured move suggests a target of up to ~2,500% from current levels.
📊 Chart Overview
Wide zones = key support and resistance
Former resistance often becomes support after a breakout
All target levels and zones are clearly marked on the chart
⚠️ Risk Warning & Realistic Scenario
Be mindful of market behavior:
Often before a bullish breakout, we see a fake breakdown — a trap to liquidate early longs — followed by a return into the triangle and a strong move upward. Don’t rush. Let the pattern confirm itself.
💡 Plan Accordingly
If you're already in, consider protecting your position with a stop-loss
Don’t overleverage, and take profit partially on strong levels

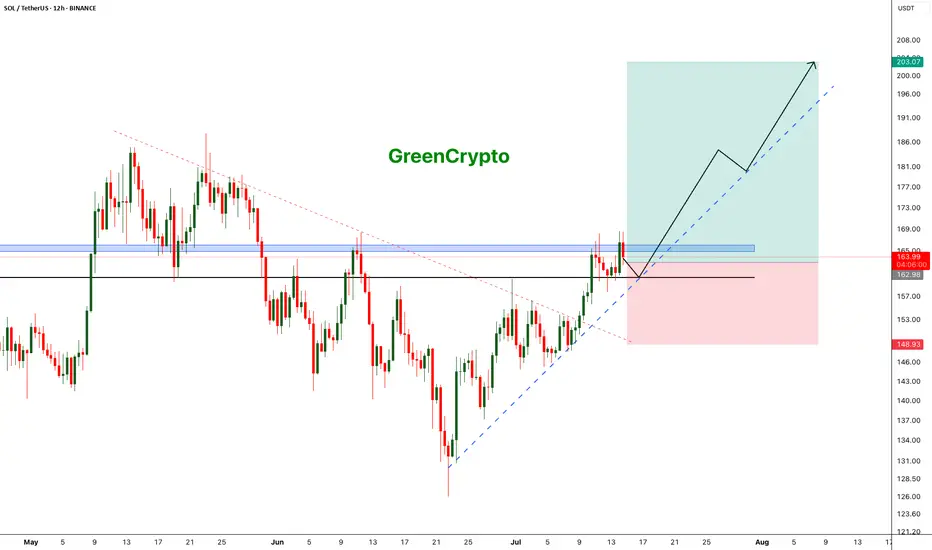
SOL - Excellent Trade Opportunity- Trade is giving us a trade with huge potential with huge risk reward ratio.
- Currently price is heading towards teh support around 160 range and this is strong support zone.
- I'm expecting price to bounce back from this zone and head towards the next target of 200 range
Entry Price: 163
StopLoss: 148
TP1: 172
TP2: 182
TP3: 200
Stay tuned for more updates.
Cheers
GreenCrypto
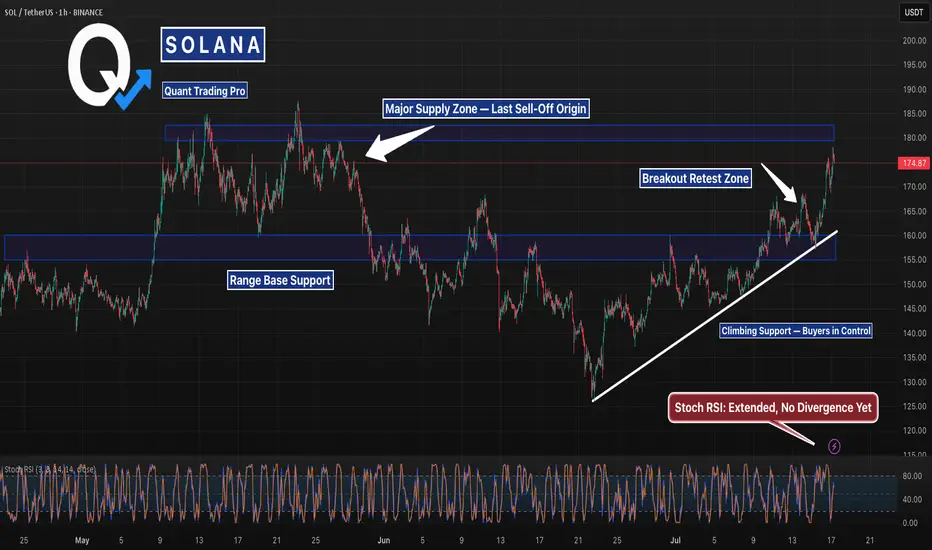
SOL Back at the Same Level It Dumped From — But with BackupSOL is right back where the last major dump started — but the structure this time is way cleaner. Higher lows, trendline support, and strong momentum behind the push.
If it clears this zone, we could see fireworks. But don’t fade resistance this thick without confirmation.
#Solana #SOLUSD #CryptoCharts #BreakoutWatch #ChartAnalysis #TrendlineSupport #CryptoTraders #QuantTradingPro #TradingView
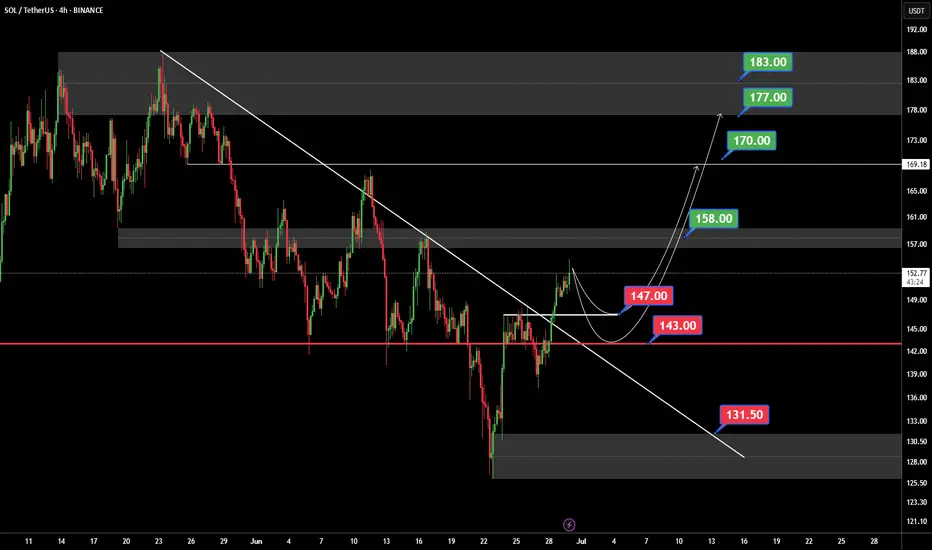
SOLUSDTThis chart BINANCE:SOLUSDT say to me that change of character. But we need to best confirmations for buy for example: pollback to 143 - 147 $ and higher high next pollback to level.
Support: 147 - 143 - 131.50
Resistance: 158 - 170 - 177 - 183
⚠️Please Control Risk Management in trades.
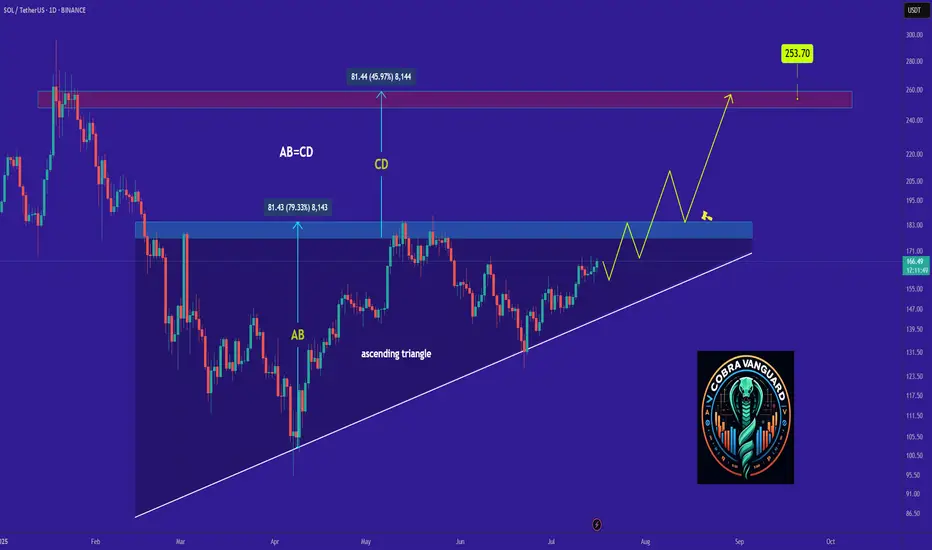
SOLANA's Situation, A Comprehensive Analysis !!!The price on the DAILY timeframe is within an ascending triangle, which can be promising. If the price breaks this pattern with bullish candles, it could easily rise by the distance of AB=CD .
Best regards CobraVanguard.💚
Solana UpdateHello friends🙌
After the price growth we had, the price hit the resistance level of $160 twice and failed to break it, which caused a double top pattern to form, which if confirmed, there is a possibility of falling to the specified areas.😉
The specified areas are good prices for buying in steps, of course, with capital and risk management.✔
🔥Join us for more signals🔥
*Trade safely with us*

Solana:Daily free signalhello friends👋
As you can see, after the drop that we had, insider buyers showed and were able to support the price well.
But it was not enough, and as you can see, a noisy pattern has formed, which can indicate a further decrease in the price.
Now we can take advantage of this opportunity and make step-by-step purchases with risk and capital management in the support areas that we have obtained for you and move to the specified goals.
🔥Follow us for more signals🔥
*Trade safely with us*
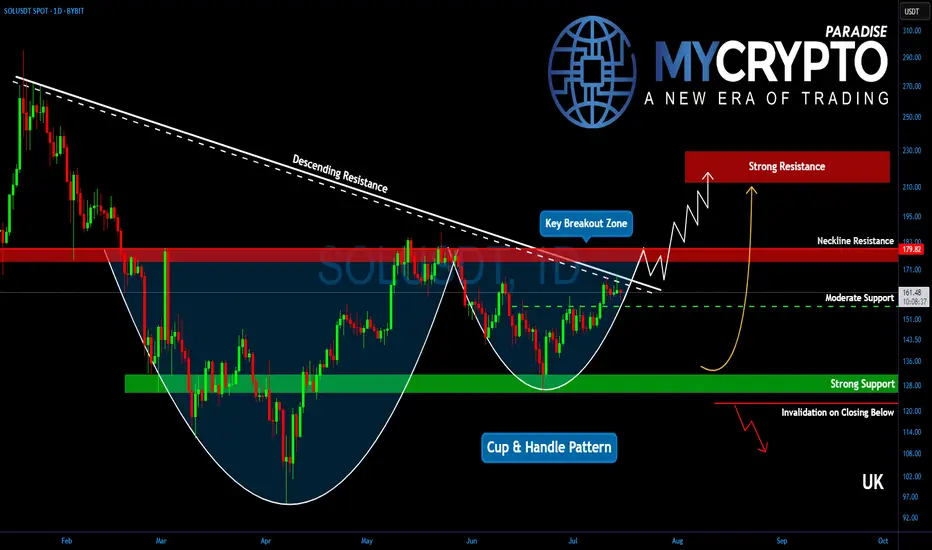
Will Solana Explode? This Important Zone Could Trigger a MoveYello, Paradisers! Is #Solana about to break free into a new bullish wave? After months of struggling under key resistance, the bulls are finally making a serious push… but only one zone stands between SOL and a potential explosion.
💎After peaking in January, Solana has remained suppressed under a descending trendline. But now, that trendline is being challenged aggressively, and the price structure is starting to form a reversal pattern that demands attention.
💎Right now, the most important level on the chart is the descending channel resistance at $167. Bulls are actively testing this zone, and if they manage to flip it into support, it could trigger a significant shift in momentum. But just above, at $180, sits an even more critical barrier, the neckline of the current reversal pattern. This entire region between $167 and $180 is the true battleground.
💎#SOLUSDT's confirmed breakout above $180 would be a major technical signal. It would likely send Solana toward the $210 to $225 zone, which marks a significant resistance area. This isn’t just psychological; it also aligns with the 61.8% Fibonacci retracement, a level where institutional players often begin offloading positions
💎As for the downside, support remains solid between $155 and $160. This region is protected by both horizontal demand and dynamic support from key moving averages, offering bulls a stable base to defend. Adding to the bullish case is a potential golden cross formation between the EMA-50 and EMA-200, a signal that, if confirmed, could inject even more confidence into Solana’s price action.
Paradisers, strive for consistency, not quick profits. Treat the market as a businessman, not as a gambler.
MyCryptoParadise
iFeel the success🌴
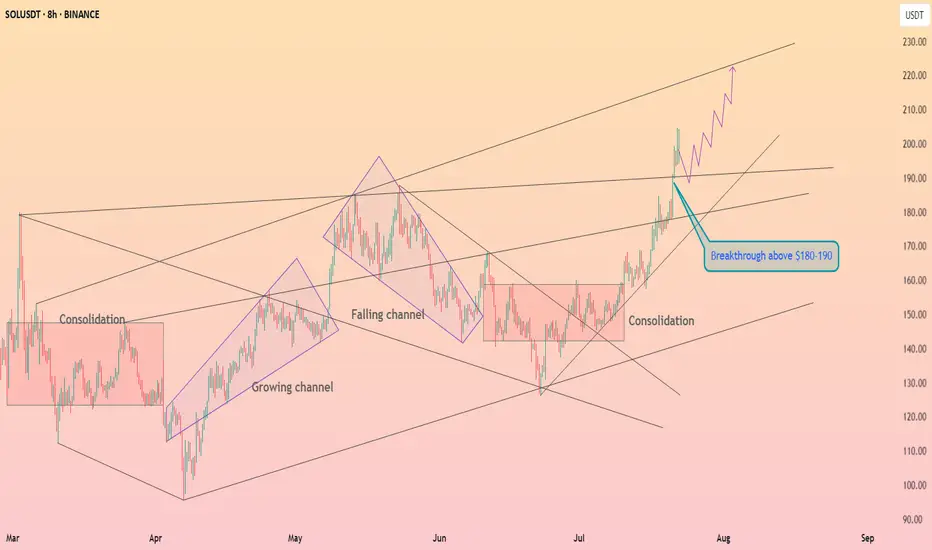
HolderStat┆SOLUSD above the $160 levelBINANCE:SOLUSDT has cleared key resistance at $159.78 after a series of consolidation patterns. The breakout has followed through into an ascending channel aiming at $185. Price remains structurally bullish with higher lows and strong recovery setups.
