Sol searching, for an entry. If you find this information inspiring/helpful, please consider a boost and follow! Any questions or comments, please leave a comment!
The Elliottician’s Paradox: 12-12 or Zigzag? Bias Is the Key
Ever stare at a chart and ask, “Is that a 12-12 or a classic zigzag?” Yeah… welcome to the paradox we Elliotticians live in. Pattern recognition’s a blessing and a curse because context is everything, but confidence can get you wrecked.
This one’s got me on the edge.
What’s Happening Here
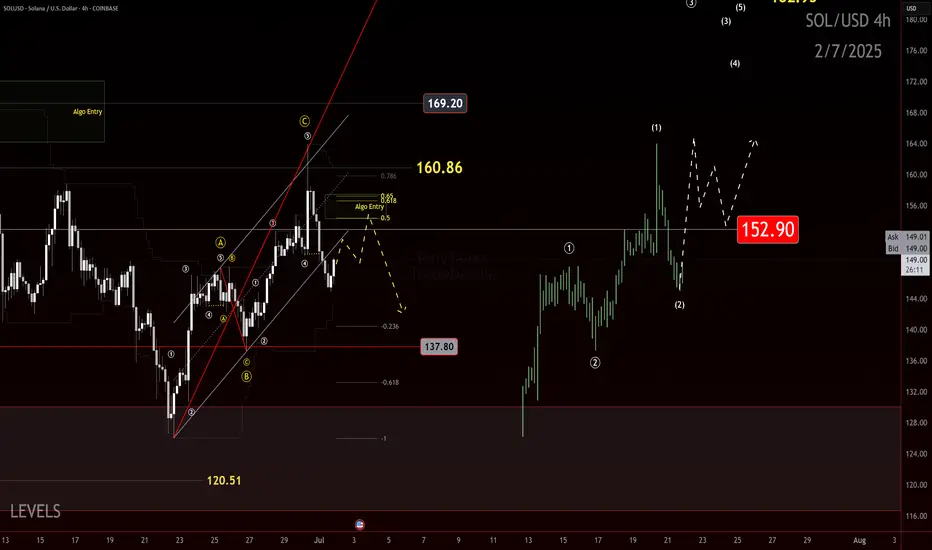
We’re currently watching a move that could be either:
- A corrective zigzag (5-3-5), or
- A 1-2, 1-2 setup, gearing up for a blastoff
That’s the core dilemma — two valid options, both technically legal. So what tips the scales? Bias.
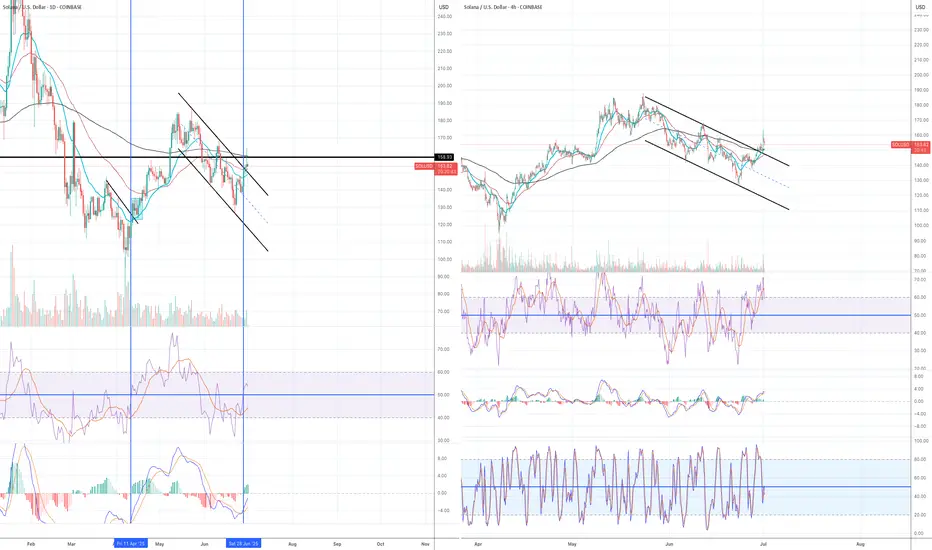
The Line in the Sand: 152
Here’s what I’m watching for:
Key Level: 152
- That’s the bull/bear line for me.
- A strong impulsive reclaim above 152 flips the script. I’d reconsider the bearish view if price surges with intent.
- But if we return to 152 in a sluggish, corrective way? I’ll be eyeing continuation lower, aligned with a more traditional zigzag structure.
Elliott View
This is where the paradox plays out:
If we’re looking at a 1-2, 1-2 setup, expect:
- A powerful Wave 3 soon (should not be shy)
If it’s a Zigzag ABC:
- Then we should expect a corrective internal retracement and continuation to the down side, at minimum past the origin of the initial move.
The chart will speak loudest. But structure and strength of this next leg will confirm the story.
Final Thoughts
Trading isn’t about being right. It’s about managing scenarios — and this one’s a classic fork-in-the-road moment. I’ve got a plan for both directions.
152 is my trigger. Stay below it and fade the rally. Break above it impulsively, and I’ll flip my bias with it.
The Elliottician’s paradox isn’t a trap — it’s an invitation to stay sharp.
Your Turn
How are you reading this structure? Do you favor the zigzag or the 1-2 setup? Drop a comment and let me know.
Trade safe, trade clarity!
SOLUSD
HolderStat┆SOLUSD aims for the $170 levelBINANCE:SOLUSDT has broken above triangle resistance, retesting the $146.60 level as new support. The breakout echoes earlier consolidation-based rallies, opening the path toward $170. As long as the structure remains intact, bulls could extend the climb over the next few sessions.

DeGRAM | SOLUSD retest of the 136 level📊 Technical Analysis
● Price bounced at 136 where the rising-channel base meets a long-held internal trend-line, locking in a higher-low and printing bullish RSI divergence.
● A micro falling-wedge is fading; clearance of the wedge roof/150 round turns bias up toward the 158.8 horizontal pivot and the channel mid-band near 187.4.
💡 Fundamental Analysis
● Solana’s daily active wallets and DEX volume have risen ~20 % since 20 Jun as new DeFi incentive programs (Jupiter, Pyth, Kamino) go live, hinting at returning user demand despite broader crypto lethargy.
Summary
Buy 137-145; confirmed break above 150 targets 158.8 → 187.4. Long thesis voided on a 16 h close below 130.
-------------------
Share your opinion in the comments and support the idea with a like. Thanks for your support!
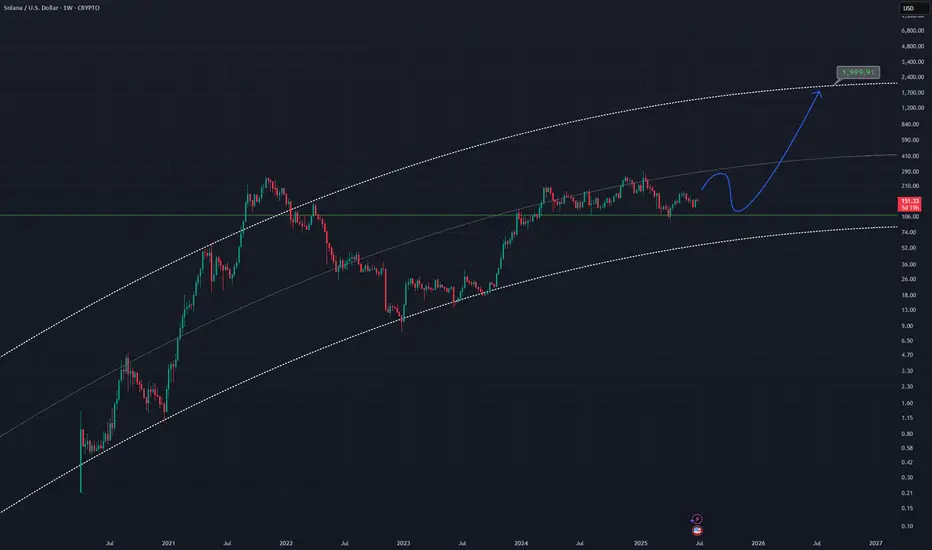
SOLUSD - Bull Ideaan idea for the bulls showing a curved channel rising
Once the bulls kick in price may push up to the top of this channel as it has before, putting price at around 2k
SOLUSD is a good altcoin pick imo
Weekly chart
Getting close to go long!
Solana bullish momentum is building up from both technical and fundamental perspectives.
Daily chart:
1) A daily candle decisively moved and closed above EMA21 on Sat 28th June.
2) RSI and MACD are still in the bear zone but the lines are crossed and now moving upwards.
3) RSI line is now above 50. When the RSI line moves above 50 and EMA21 closes above 21 at the same time, it is often (not always) an early sign of bullish momentum (see blue vertical lines in daily chart).
4H chart:
1) EMA21>EMA55, but EMA200 is still moving horizontally.
2) All momentum indicators have entered the bull territory. However, when the candle finally broke outside the descending parallel channel and broke and closed above EMA200, momentum indicators reached the overbought territory. It means the price is likely to consolidate first before taking off.
I plan to open a long position when:
1) Wait for the momentum indicators to come down and flip to the upside in the 4H chart.
2) A candle to retest, either EMA 21, 55 and/or 200 and forms a strong green (bullish) candle in the 4H chart.
3) A candle stays above EMA 21 in the 4H chart.
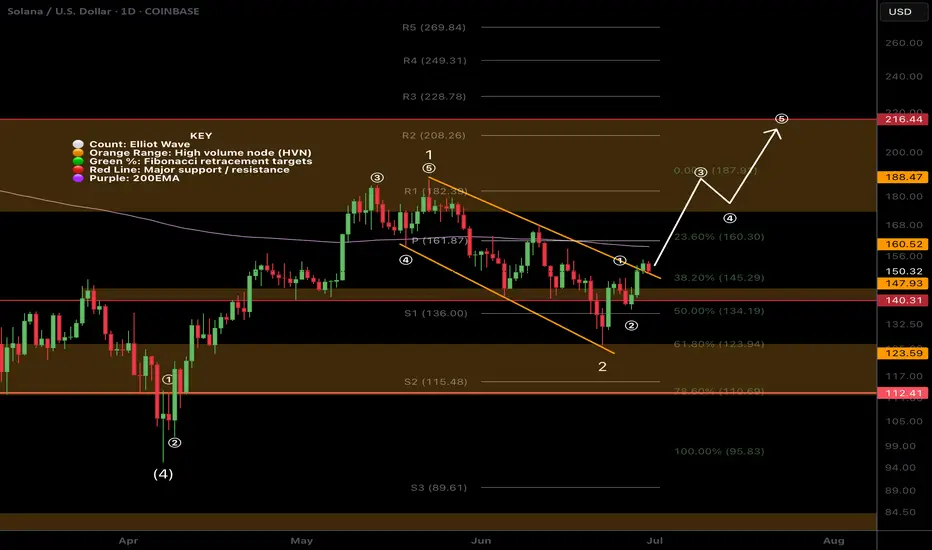
SOL Ready To Breakout?SOL had a decent move this weekend overcoming descending resistance and now testing as support.
Price appears to have a completed a wave (2) at the .618 Fibonacci retracement and S1 daily pivot and a larger degree wave 2 at the channel bottom, High Volume Node support and .618 Fibonacci retracement.
If a wave (3) of 3 is underway then we should expect a strong move sooner rather than later with an initial target of the swing high resistance a/ R2 daily pivot $208-$216 range
Safe trading.
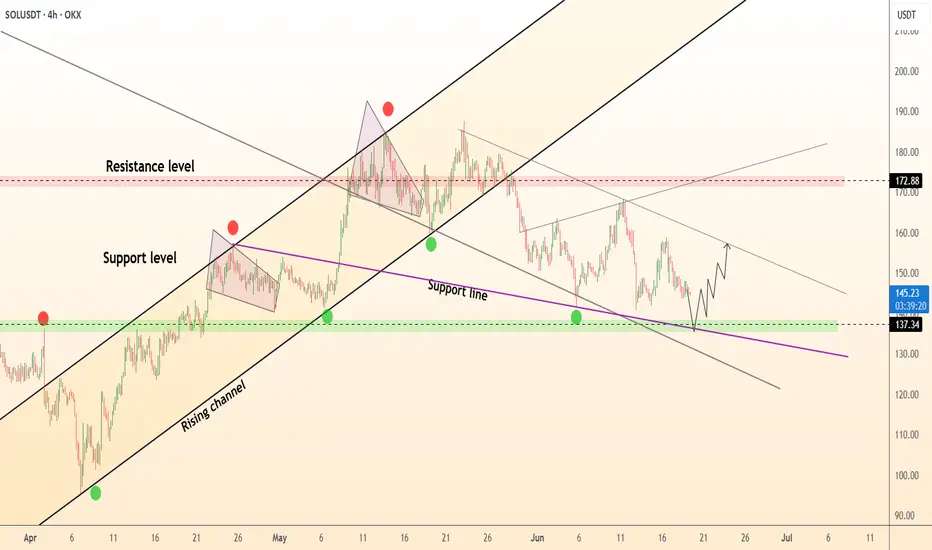
Is SOLANA SOL Ready for a Breakout? Bounce from Falling Channel?
🔍 Chart Pattern and Price Structure Analysis
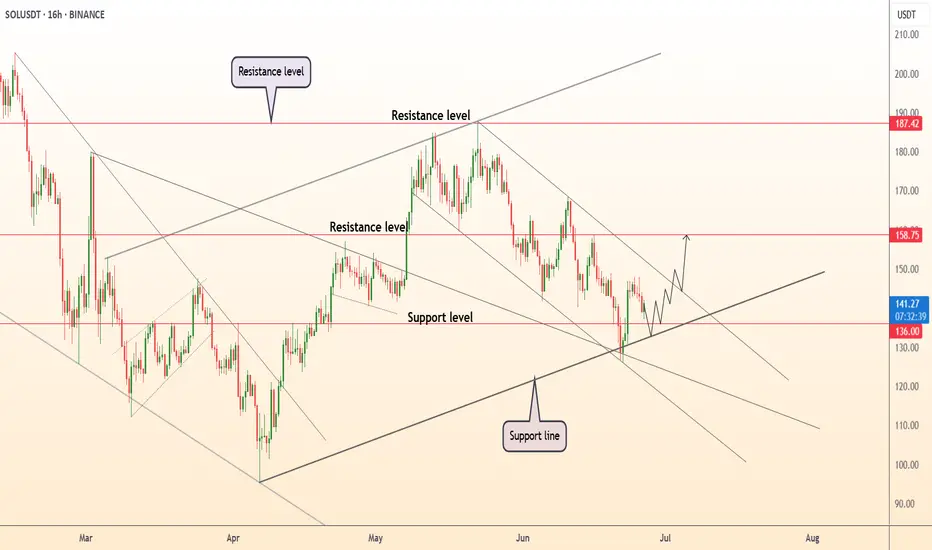
This chart illustrates a well-formed descending channel (parallel falling channel) that has been developing since mid-January 2025. Currently, the price is approaching the upper boundary of this channel — a key decision area.
🟡 Technical Pattern
Descending Channel: This pattern is characterized by a series of lower highs and lower lows, representing a medium-term bearish trend.
The price is now testing the upper resistance of this channel, a crucial point that could either trigger a breakout or result in another rejection.
📈 Bullish Scenario
If the price successfully breaks out above the upper trendline (around $152–$154), several resistance targets come into play:
1. $164.5 — A minor horizontal resistance and key psychological level.
2. $182.2 — A strong historical resistance zone.
3. $210–$217.8 — A previous consolidation/resistance zone.
4. $237.7, then $261–$280 — Key bullish targets if momentum sustains.
5. Ultimate target near $295.1–$295.7 if broader market sentiment remains strong.
📌 Bullish Confirmation:
Valid daily candle breakout above the channel.
Strong breakout volume.
Successful retest of the breakout area as new support.
📉 Bearish Scenario
If the price fails to break above the channel and gets rejected, we may see a continuation of the downtrend with potential moves to these support levels:
1. $140–$138 — Current minor support zone.
2. $128 — Recent consolidation support.
3. $115.5 — Major support from April.
4. $95.2 — The lowest support zone on the chart.
📌 Bearish Confirmation:
Strong rejection candle (e.g., bearish engulfing) from upper channel.
Weak breakout attempt with declining volume.
Break below the lower channel support or creation of a new lower low.
📊 Conclusion
The current setup is a classic descending channel, indicating a strong mid-term bearish structure.
Price is now at a make-or-break zone — a breakout could signal a trend reversal, while a rejection could extend the current downtrend.
Traders should wait for a confirmed breakout or clear rejection before entering a position.
#SOLUSDT #Solana #CryptoAnalysis #TechnicalAnalysis #DescendingChannel #BreakoutAlert #CryptoTrading #BullishScenario #BearishScenario #Altcoins #CryptoTA

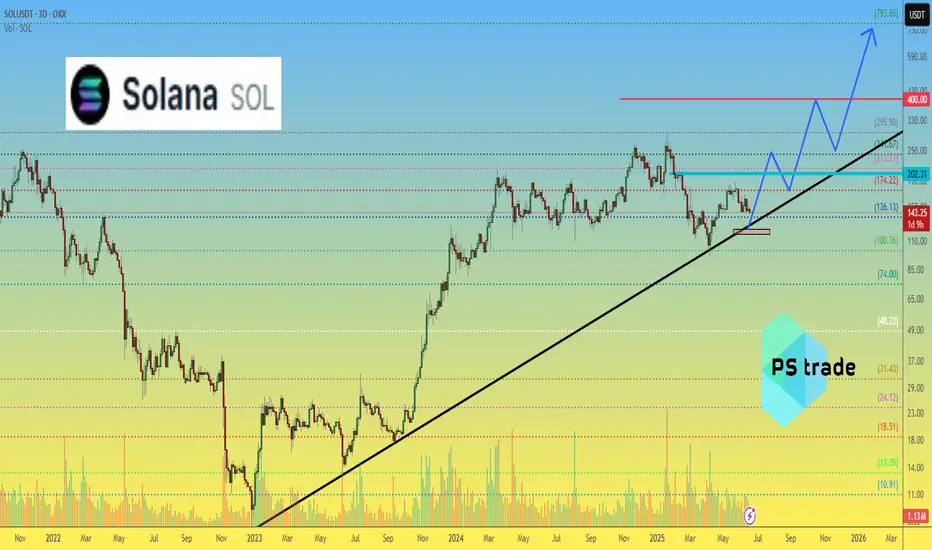
SOLANA ABOUT TO EXPLODE?CRYPTOCAP:SOL just broke out and is surging within a long-term bullish channel
Price action is clean, momentum is strong, and if this channel holds — we might be eyeing $700+ in the next run.
This is not the time to ignore Solana.
Chart says it all.
DYOR. Stay sharp.

NothingThe SOL will increase $150 and reach to the top of the wedge in the coming weeks .
Best regards CobraVanguard.💚

HolderStat┆SOLUSD breakoutBINANCE:SOLUSDT on the 6h chart has shifted from a falling to a growing channel structure. Support around $135 held, and now the price is eyeing $160–$170. Previous breakouts from similar structures have triggered steep gains.

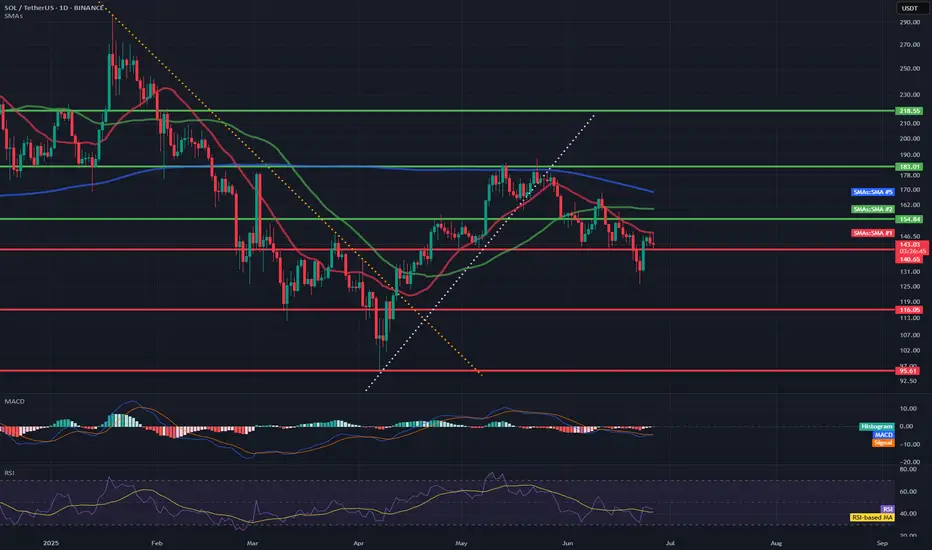
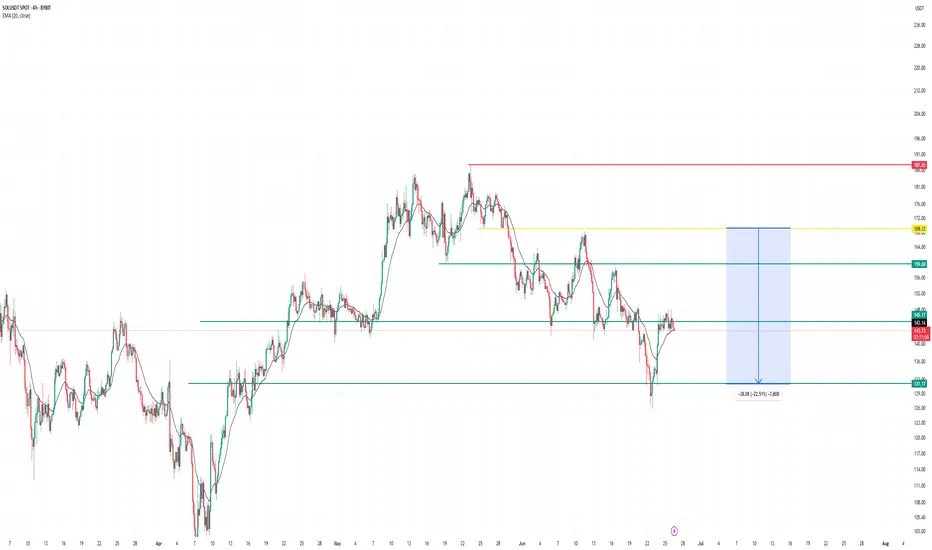
SOL/USD🔹 Trend direction
Current short-term trend: down
Price below key moving averages:
SMA50 (green) ≈ 154.84
SMA200 (blue) ≈ 168.79
Price ≈ 142.49 – below both, confirming weakness.
🔹 Supports and resistances (key levels)
✅ Supports:
142.00–143.50 – current level where price is struggling (multiple price reactions).
131.00 – strong support, last low (June 18).
119.00 / 116.00 / 113.00 – next supports from previous consolidations.
95.61 – deep support if market breaks down.
❌ Resistances:
148.00–150.00 – local resistance, coinciding with the red SMA (short-term resistance).
154.84 – resistance (SMA50).
162.00 – resistance (SMA200).
183.00 – main resistance from the May peak.
218.55 – very strong resistance from March.
🔹 Technical indicators
📉 MACD:
MACD line < signal, negative histogram → bearish signal.
No signs of bullish strength.
📉 RSI:
RSI ≈ 41.31 – close to the oversold zone, but not there yet (below 30).
RSI trend also downward.
🔹 Formations and trend lines
Broken support line after the April-May bullish structure (white trend line).
The previous bearish trend line (yellow) was broken in April, but the momentum did not hold.
A lower high and lower low may be forming now – a classic bearish structure.
🔹 Potential scenarios
🔻 Bearish:
Breakout of 142 → test of 131 → possible drop to 119/116.
Staying below SMA50 and MACD still negative = high chance of continuing declines.
🔼 Bullish:
Recovery of 148–150 needed → only then a chance to test 154 and SMA50.
RSI close to oversold = possible local technical bounce, but not reversing the trend.
📌 Conclusions / Summary
General trend: Bearish (down).
Sentiment: Negative, no confirmed signals of strength.
If level 142 breaks - next test will be at 131.
A strong breakout above 150-154 is needed to talk about a change in structure.
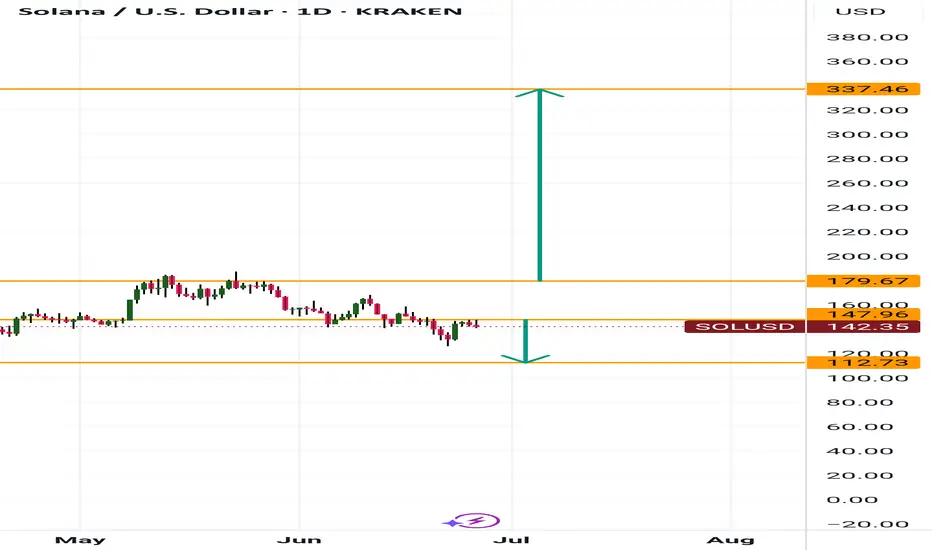
Solana Heading to 112 or 330+Hey fam
So for Solana if we hold under 148 then a drive down to 112 makes sense. However if we drive above 148 then we can possibly hit weekly targets of 330
Make sure you adjust accordingly in a smaller time frame to ensure your in the right move
Happy tradings folks
Kris Mindbloome Exchange
Trade Smarter Live Better
Under 148 we go to 112 if we break 148 we can see a drive up to 338
HolderStat┆SOLUSD above the supportBINANCE:SOLUSDT reclaimed the $140 level after a wedge breakout and is now forming a stair-step recovery structure. The price is targeting the mid $150s with higher lows supporting the bullish thesis. Previous consolidations and wedge formations suggest buyers are regaining control. Continued strength above $140 reinforces the move.

sol updateentry price 169.14
stop loss update 169.14
take profit
160.1
145.1
131.5
result full target
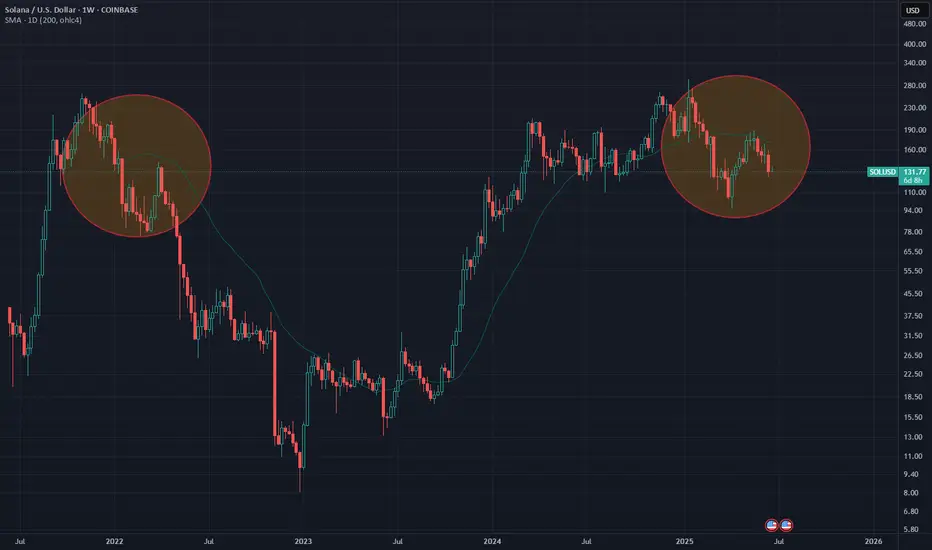
Solana looks scary. I don't like this rejection from the 1D 200MA.
Looking at the the weekly chart, it is very easy to see the similarity to 2022.
Maybe we should brace for impact?
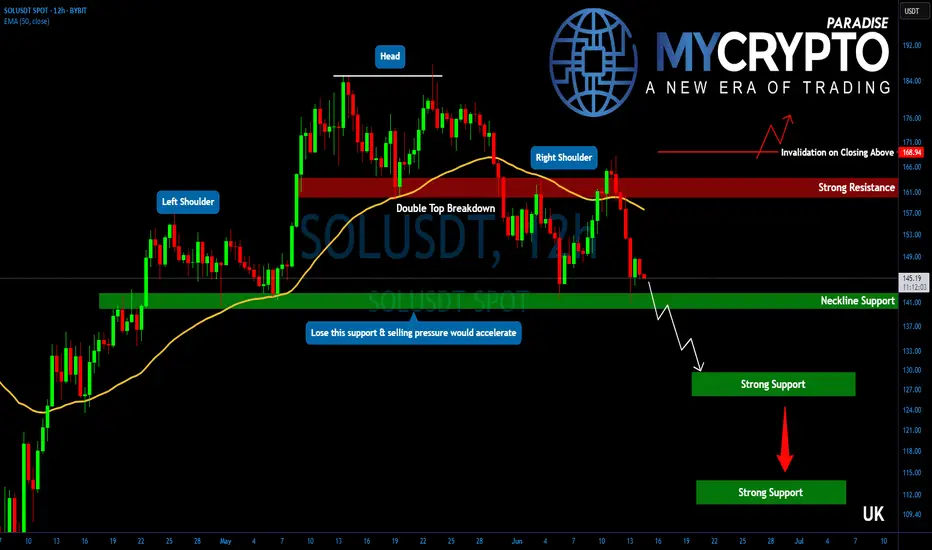
Solana Breakdown Incoming? These Are Key Levels To WatchYello, Paradisers! Are you ready for the next major flush? After failing to gain momentum since the May double top breakdown, #SOL is now showing even more bearish signs, and the market might be about to punish late bulls one more time.
💎Following the confirmed double top in May, SOL has struggled to reclaim any upside momentum. Now, on the 12-hour chart, a classic head and shoulders formation is emerging, a pattern that often precedes larger trend reversals when the neckline breaks.
💎#SOLUSDT is hanging onto critical support between $142 and $140. This zone is the neckline, and it’s the last stand for bulls. If bears break it, we get a clear breakdown confirmation, with a clean path down toward $130–$127, which marks the first major demand area.
💎That initial support likely won’t hold for long. If pressure continues, SOL is expected to drop further toward the $115–$110 region. This is not just a technical support, it’s also the target area of the H&S formation, making it a magnet zone for price.
💎Adding to the bearish developments, a death cross has now been confirmed on the 12-hour chart. The EMA-50 has crossed below the EMA-200, reinforcing short-term downside pressure. Even if a relief bounce occurs, the $155 region, where the EMA-50 sits, will likely act as fresh resistance and attract renewed selling.
Paradisers, strive for consistency, not quick profits. Treat the market as a businessman, not as a gambler.
MyCryptoParadise
iFeel the success🌴
Do not try to buy the dip!!!! It can go lower. My overall bias for Solana is bullish based on its fundamentals. I am a solana investor so I have been accumulating Sol and staking them. I think the price will eventually move up but at this stage I don't see anything bullish in the Solana chart. It is certainly not the buy the dip moment because I can see the price can go much lower from here. (and I can be gladly wrong on this!).
Bearish setups I see in the chart:
1) The $140.50 zone had been working as a support line since April 2025 (red horizontal line in the chart), but the price decisively broke and closed below the zone on Friday.
2) The price has been trapped in the descending parallel channel since early May. Now the price broke below the support line, it might drop further to touch the bottom parallel channel.
3) There is an unmitigated fair value gap (not very strong one) around $125-6 area and the area also was working as a strong support line for several months last year (see blue horizontal line in the chart)
4) There is a large order block at $104 zone. If the downside move is aggressive, it can wick down to this level.
5) The price is below all EMAs.6) EMA 9<14<21<55<200 - Bearish
7) MACD and RSI are deep in the bear zone and they are pointing to the downside.
8) There is a big fair value gap in the weekly chart in the $95 area.
I don't like to go short on the asset I am fundamentally bullish on, so I will just stay on the sideline and observe how the price will unfold in the next few months.
SOLANA MARKETCAP LOOKS COOKEDIs that a Head and Shoulder's top?
Is #crypto about to endure a Iron dome penetration event?
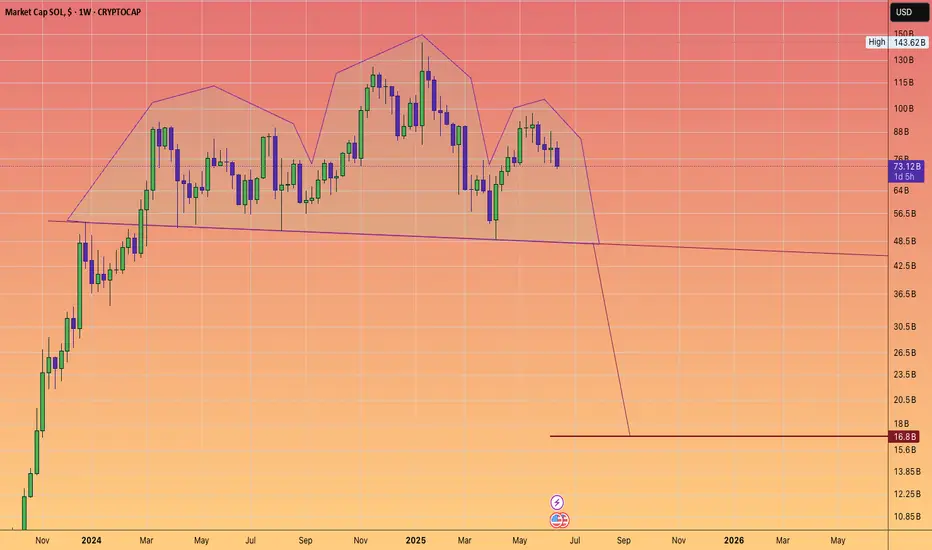
Daily EMA 55 needs to move above EMA 200!!
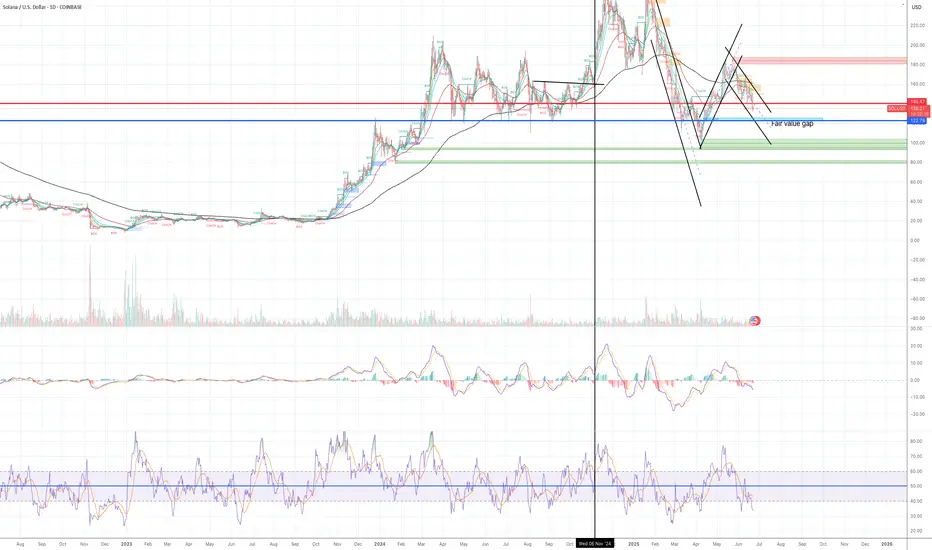
My general bias for Solana is bullish. However, the current setup is very similar to the setup in Feb-Apr 2022 before Solana started a macro bear trend. (see blue rectangular box)
I am still waiting for a long trade opportunity. I am not looking for a short trade. I just need to sit tight and see how the price is going to unfold in the next few months in the daily chart.
The 2022 setup (see blue rectangular box in the chart):
1) EMA55 crossed below EMA 200 on 16th Feb 2022. (red vertical line in the chart)
2)The price found the temporary floor around $80 and sharply moved above both EMA55 and
200. (see light blue rectangular box)
3) It was the dead cat bounce. It was the beginning of the macro down trend.
4)The price spent months and months under $40 in 22 and 23, however, the price eventually
broke above both EMA 55 and 200 and when EMA55 crossed above EMA 200 in Oct
2023 (red vertical line in the chart), the macro bull trend started.
The current setup (see orange rectangular box in the chart):
1) EMA 55 crossed below EMA 200 on the 4th March 2025.
2) The price moved down to $95 area and sharply moved above both EMA 55 and EMA200. However, it failed to stay above them.
3) The price has been oscillating between $140 and $18. The price is still below EMA55 and EMA200. (see orange rectangular block)
In order to start a strong bull trend,
1) the price needs to close and stay above EMA 55 and EMA200.
2) EMA 55 needs to cross and stay above EMA 200. EMA55>EMA200
3) MACD and RSI need to enter the bull zone.
EMA55 and EMA200 do not cross easily (I mean decisively cross). It only happened three times since 2022, however, when they cross, the price moves very aggressively in one direction.
I think Solana is bullish fundamentally. I am not suggesting it is going to start the macro bear cycle. I am pointing out the price is still not showing a clear direction. From a technical analysis point of view, it might take some time before the trend forms. For now, it is only testing my patience!

Solana SOL price analysis📞 Rumor has it that as soon as the global geopolitics reach a “temporary lull”, the following ETFs will be launched
Solana ETF is the most likely to be the next one (but there are at least 2 coins more on the list, which we will talk about in the coming days)
🪙 So, are you ready to buy CRYPTOCAP:SOL in your investment portfolio? For example, in the range of $117-123
🤖 Maybe we need to launch a long trading bot OKX:SOLUSDT so that it can buy in micro portions on the current possible price correction to get a “tasty price” as a result
◆ Would you like to join such a trading bot and copy them?
◆ And then compare the results with all “ETF candidates”
_____________________
Did you like our analysis? Leave a comment, like, and follow to get more
DeGRAM | SOLUSD channel floor launch toward 170+Solana continues to respect the broad rising channel that has guided price since early April. Recent corrective action tagged the channel median and then the intersecting 137-140 horizontal support, forming a classic confluence floor. The reaction: a sharp bullish rejection that restored price above the magenta internal trendline, indicating buyers remain in firm control. The corrective structure itself resembles a descending wedge losing bearish momentum, while RSI prints a positive reversal at 40 – conditions that often precede explosive upside resolution. A decisive close over 150 triggers an upside breakout aiming first at 160 (wedge objective) and subsequently at the 172-175 resistance block where prior distribution occurred. Should momentum spill over, the upper channel trajectory extrapolates 185-190 in coming weeks. Bullish bias is intact while candles close above 137; deeper dips into that zone likely represent opportunity rather than weakness.
HolderStat┆SOLUSD accumulation before growthOKX:SOLUSDT respects the $140 axis and tests the roof of its falling channel. Holding that shelf lets bulls aim for 160-170 and keeps the broader up-channel alive; a dip under 135 would postpone the rally but not derail the long-term trend ⚡️
