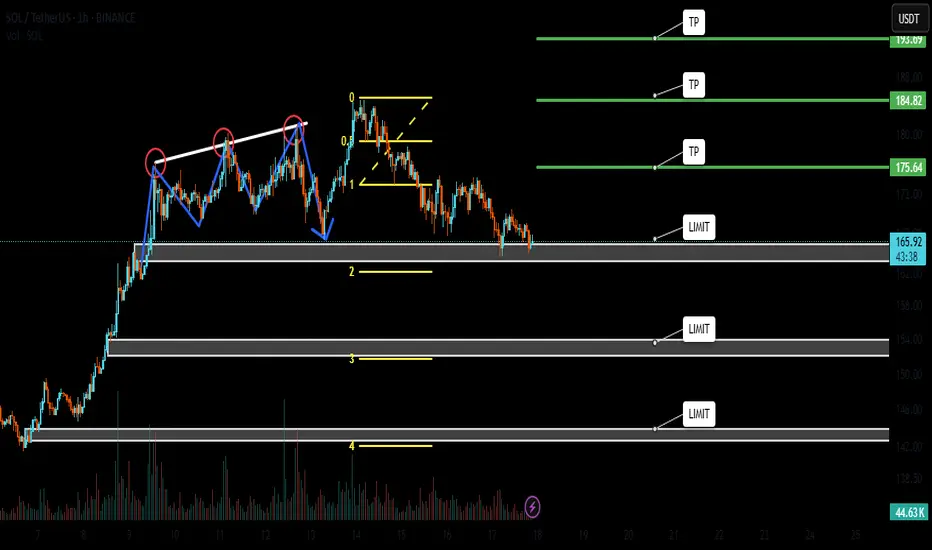
SOLANA BUYLIMITHello friends
Considering the good growth we had, you can see that the price has made a small correction after reaching its ceiling and has entered a range.
Now, with the price correction, there is a good opportunity to buy in stages and with capital management and move towards the specified goals.
*Trade safely with us*
SOLUSD
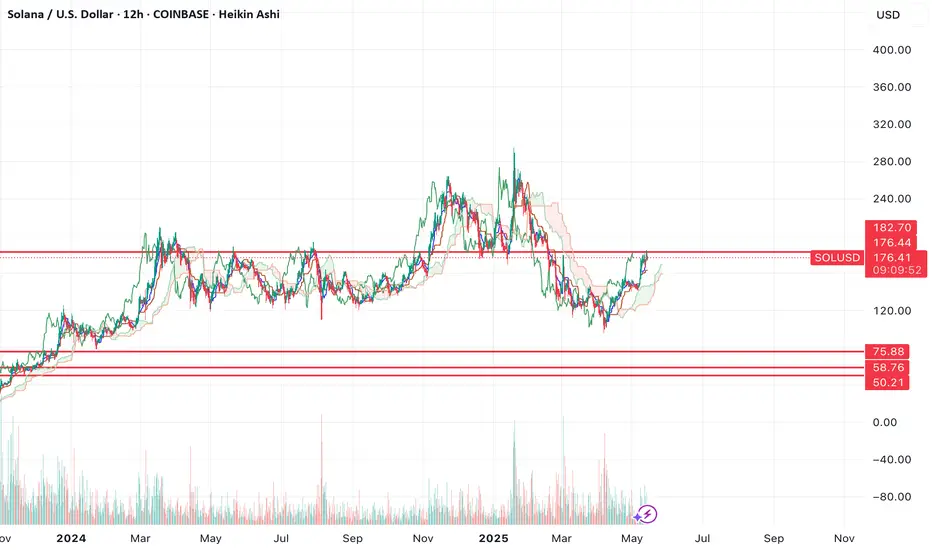
SOL at a key resistance area - Bullish or Bearish?SOL at $180 is at a key resistance area.
The last time we had the same pattern repeating from the trendline support that turned resistance which gave a prolong bear season. (April '22)
We need to see SOL break out past this wall of resistance above $180 to be bullish.
For now, I am not allocating capital into SOL until I see that break of resistance.

Solana: Below ResistanceOur primary scenario for Solana is that the coin is already close to the top of the green wave 4. Therefore, we expect a bearish trend reversal below the resistance at $192.33, followed by a move toward our blue Target Zone (coordinates: $56.56 – $29.87) with the green wave 5. Down there, we see an opportunity for long trades with the low of the blue wave (ii), which should be followed by a fresh upward impulse. According to our alternative scenario (probability: 38%), however, we may have already seen the low with wave alt.(ii) in blue prematurely. To validate this alternative scenario, the price would have to rise directly above the resistance at $192.33 from here and extend the blue wave alt.(iii) .

SOL-USD 12h Chart ReviewHello everyone, let's look at the 12h SOL to USD chart, in this situation we can see how the price came out sideways from the downtrend line, then formed a downtrend channel, the exit from which gave a strong rebound creating a new uptrend.
Let's start by defining the targets for the near future that the price must face:
T1 = 172 USD
T2 = 195 USD
Т3 = 218 USD
Т4 = 252 USD
Now let's move on to the stop-loss in case the market continues to fall:
SL1 = 151 USD
SL2 = 130 USD
SL3 = 115 USD
SL4 = 96 USD
It is worth paying attention to the Stoch RSI indicator, where you can see how the current correction has strongly reacted on the indicator, which may give room for another stronger uptrend.

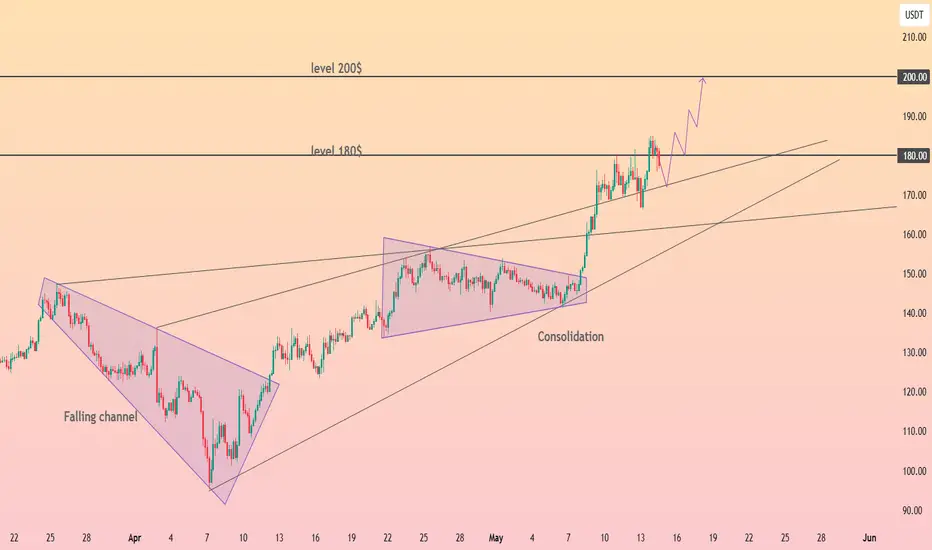
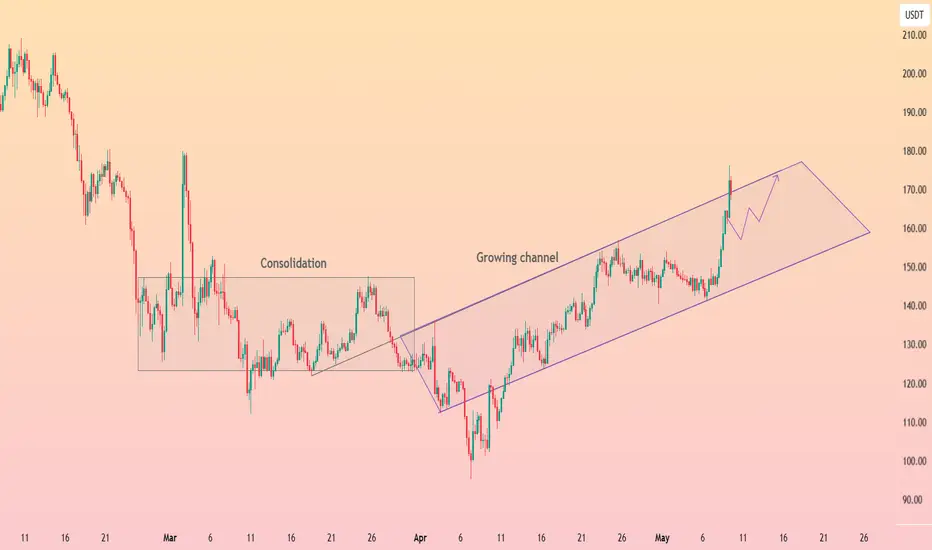
HolderStat┆SOLUSD 180 $ flip, 200 $ nextSolana price escaped April’s consolidation box, flipped the old down‑sloping resistance into a rising support line, and is now pressing the 180 $ ceiling inside a well‑defined growing channel. A decisive daily close above 180 transforms that barrier into a launch pad, opening the measured channel extension toward 200‑205 $. Channel lows near 150 remain key invalidation for the bullish momentum.
$SOL rejecting resistance $50-75 targetSol looks to be rejecting resistance here, which sets it up for a large move lower.
I think it's likely that unless price can flip the resistance above as support, that we revisit the support levels.
Pretty simple chart. All of crypto looks the same, look out below.
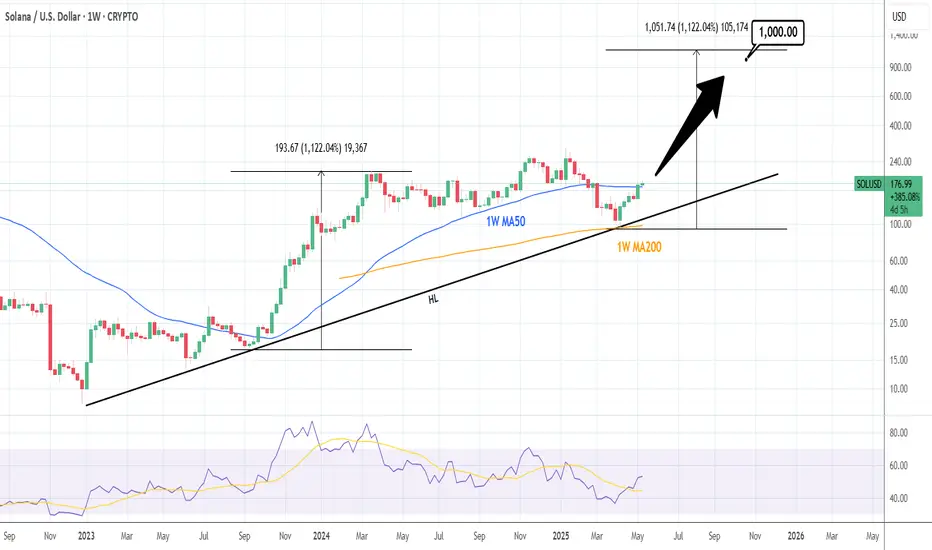
SOLUSD: Can it hit $1000?Solana is heavily bullish on its 1D technical outlook (RSI = 67.130, MACD = 11.423, ADX = 35.600) and just last week only crossed over its 1W MA50 again. This rebound started exactly on the 1W MA200, after holding the HL trendline of the Bull Cycle. Last time SOL crossed above its 1W MA50 after a HL, was on September 25th 2023 and a +1,122% rally unfolded. If macro and fundamentals assist, SOL can repeat this and reach the 1k mark (TP = 1,000).
## If you like our free content follow our profile to get more daily ideas. ##
## Comments and likes are greatly appreciated. ##
Solana can we hit 186 from this correction ? Hey everyone
currently Solana made a nice correction and looks like if price action can confirm it making a higher high this could be a nice spot for everyone to possibly look at taking a nice long position to 186-191
Let me know what you think
Kris/Mindbloome Exchange
Trade Smarter / Live Better

Solana - This just faked out literally everybody!Solana - CRYPTO:SOLUSD - just faked out literally everybody:
(click chart above to see the in depth analysis👆🏻)
Over the course of the past 25 days, Solana dropped a significant -30% and wiped out a ton of bulls before creating a complete reversal. Especially with the current horizontal support level, bulls are taking over again, offering us another major crypto trading opportunity.
Levels to watch: $120, $250
Keep your long term vision!
Philip (BasicTrading)

HolderStat┆SOLUSD fixed above the trend lineSOL spent March in a messy consolidation box before rotating into a disciplined rising channel that has marched price from 110 to the doorstep of 180. Bulls are now wrestling with that major horizontal barrier; acceptance above it would turn the former ceiling into fresh support and open the calculated channel extension toward 205. Until channel lows around 150 give way, trend traders may lean on pullbacks inside the lane to stay positioned with momentum. 🔥

Solana 1-Day Chart – Are We on the Brink of a $1,000 MOONSHOT?!Solana is absolutely on fire! On this 1-day chart, we’re witnessing a massive rising channel that’s been building since 2023. After a solid rebound from the $93 support, Solana has smashed through a fractal resistance line (check that arched arrow from mid-2023 to early 2024 top) . Now, it’s breaking out at a parallel resistance, hanging around $174 — and this could be the setup for a MASSIVE move upward!
I’m calling a potential target of $1,000 if SOLUSDT can muscle through the big resistances ahead: $200, the ATH at $270, and everything beyond. This breakout screams opportunity — Solana might just catch another wave of demand and go parabolic! The $93 support (marked "Back to Nothing Below This Line") looks rock-solid, giving us a strong foundation for this rally.
Key Levels to Watch:
Support: $93 (channel base)
Current Price: $174 (breakout zone)
Resistances: $200, $270 (ATH)
Target: $1,000 (if momentum holds)
Are you ready for this? I’m buzzing — I can’t believe this might actually happen!
Let’s hear your thoughts, traders! Are we heading to $1,000, or will resistance hold us back?

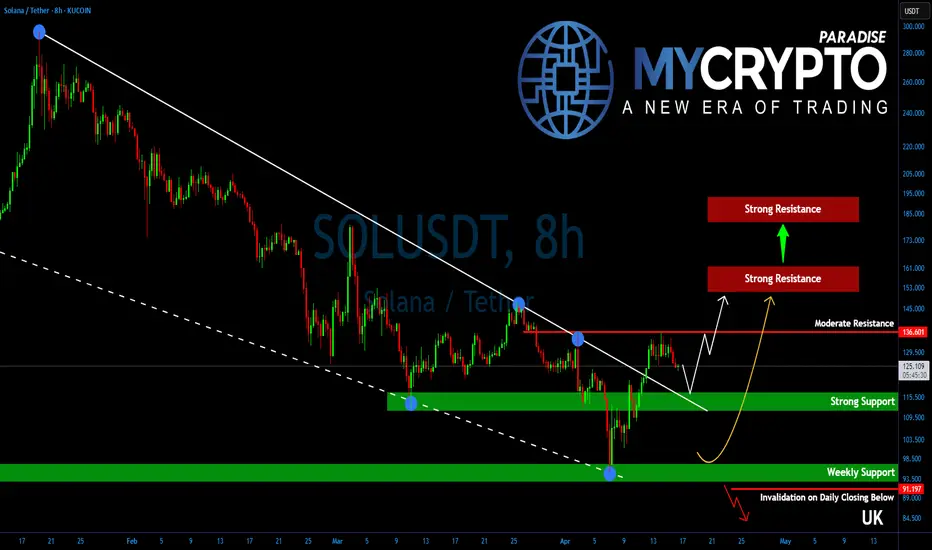
Solana Is One Breakout Away From a Bullish Explosion!Yello, Paradisers! Did you notice how #SOLUSD has been quietly positioning itself while the rest of the market remains uncertain? If you're not paying attention right now, you could be missing one of the cleanest setups on the charts.
💎After several weeks of downside grind and tight consolidation, Solana has just broken out of a falling wedge—a powerful bullish pattern that typically signals trend reversals or the start of a strong upside leg. This breakout wasn’t random either. It occurred after SOL successfully defended a key higher time frame support zone, signaling strength behind the move.
💎For #SOLUSDT, all eyes are on the $136.50 resistance level. This is a critical structural pivot. A clean break and close above this level would confirm a shift in higher time frame momentum from neutral to bullish. Until that happens, bulls still need to proceed with caution—but the setup is clearly developing in their favor.
💎Adding conviction to the idea of a bullish breakout are several supporting factors. Oscillators are showing bullish divergences, a classic sign that seller momentum is fading. At the same time, a golden cross formation on the 12-hour chart is getting closer which typically precedes sustained trend reversals and stronger moves to the upside.
💎If bulls succeed in reclaiming $136.50, the next price targets are $155–$160 as the initial strong resistance zone where some profit-taking could occur. If bulls hold strength, SOL is likely to head further higher and aim for $180–$190, which lines up with the target of the wedge pattern. This is a strong resistance zone and a level which could mark end of the corrective phase for Solana.
💎On the downside, immediate support lies between $110–$115. This is a well-defined range of demand and should offer strong buying interest if any short-term pullbacks occur.
Paradisers, strive for consistency, not quick profits. Treat the market as a businessman, not as a gambler.
MyCryptoParadise
iFeel the success🌴
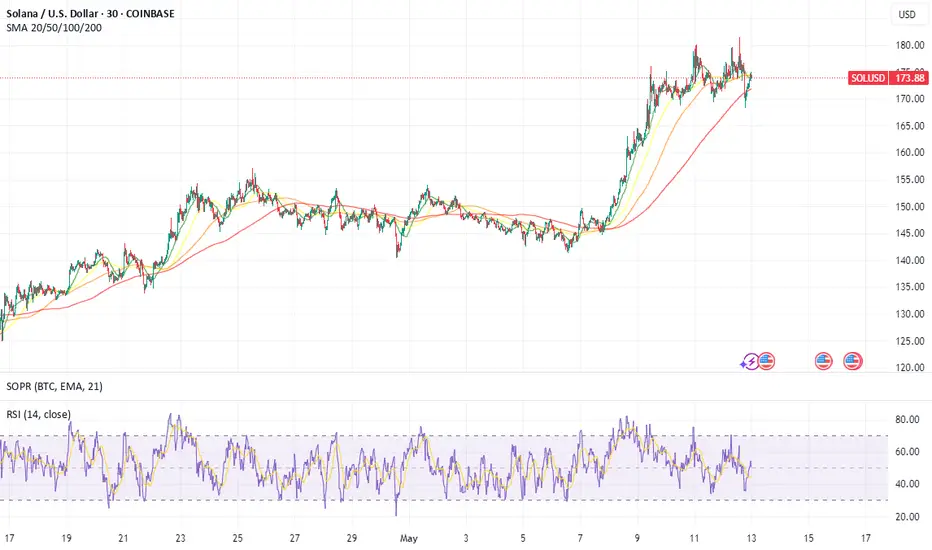
Solana (SOL) Rallies Above $162 Zone: Technical and FundamentalSolana (SOL) Rallies Above $162 Zone: A Technical and Fundamental Analysis of Its Path to $180 and Beyond
Solana (SOL), the high-performance blockchain network known for its lightning-fast transactions and scalable infrastructure, has once again captured the attention of cryptocurrency markets. After a fresh surge above the $162 psychological level, SOL price has entered a consolidation phase near $175, hinting at a potential breakout toward $180 and even $200. This article delves into the technical indicators, fundamental catalysts, and market sentiment driving Solana’s recent rally, while offering a balanced perspective on its short- and long-term prospects.
Technical Analysis: Rising Channel and Key Resistance Levels
1. Recent Price Action and Consolidation Phase
Solana’s price trajectory in recent weeks has been marked by volatility, but the broader trend remains bullish. On , SOL initiated a fresh upward move above the $155 and $162 zones, fueled by renewed investor confidence and macroeconomic tailwinds. The rally, however, faced resistance near $165, causing a temporary pullback.
SOL is trading near $175, consolidating gains after a 22% intraday surge. This consolidation phase aligns with the formation of a short-term rising channel on the hourly chart (data sourced from Kraken), with immediate support at $172. The channel’s upper boundary currently resides near $176, a critical resistance zone that, if breached, could trigger a fresh rally toward $180 and beyond.
2. Key Technical Indicators
• 100-Hourly Simple Moving Average (SMA): SOL price is currently trading below the 100-hour SMA, suggesting short-term bearish sentiment. However, a close above this level could signal a resumption of the uptrend.
• Relative Strength Index (RSI): The RSI on the hourly chart hovers near 50, indicating neutral momentum. A move above 60 would confirm bullish dominance.
• Volume Profile: Recent price spikes have been accompanied by elevated trading volumes, reinforcing the strength of the rally.
3. Bullish Scenario: Breaking $176 and Targeting $180
If Solana successfully clears the $176 resistance, the next immediate target would be the $180 psychological level, which coincides with the 200-day moving average. Analysts note that a sustained close above $180 could open the door to $200, driven by momentum traders and institutional inflows.
4. Bearish Scenario: Support at $172 and $165
Conversely, a breakdown below $172 would invalidate the rising channel pattern, exposing the $165 support zone. Further weakness could retest the $155 level, though this outcome appears less likely given the current bullish momentum.
________________________________________
Fundamental Drivers: 1inch Integration and Memecoin Frenzy
1. 1inch Network Integration: A Catalyst for Growth
One of the key fundamental catalysts behind Solana’s rally is its integration with 1inch Network, a decentralized exchange (DEX) aggregator and liquidity protocol. This partnership enhances Solana’s ecosystem by:
• Improving Liquidity: 1inch’s aggregation algorithms optimize trade execution on Solana-based DEXs, attracting traders and liquidity providers.
• Expanding Use Cases: The integration enables seamless cross-chain swaps, positioning Solana as a hub for multi-chain DeFi activity.
• Boosting Developer Activity: Increased infrastructure support could accelerate the launch of new decentralized applications (dApps) on Solana.
2. Memecoin Surge: The Role of Speculative Capital
Solana has emerged as a preferred platform for memecoin launches, driven by its low transaction fees and high throughput. Projects like SEED_DONKEYDAN_MARKET_CAP:BONK and NASDAQ:WEN have gained viral traction, drawing retail investors and creating a “fear of missing out” (FOMO). This speculative frenzy mirrors Ethereum’s memecoin boom in 2021–2022, with Solana’s faster and cheaper network offering a competitive edge.
3. Institutional and Retail Adoption
• Institutional Interest: Grayscale and other asset managers have added Solana to their crypto investment products, signaling growing institutional confidence.
• Retail Participation: On-chain data reveals a surge in small-cap wallet creations, indicating grassroots retail adoption.
________________________________________
Market Sentiment and Analyst Predictions
1. Bullish Outlook from Analysts
Technical analysts and on-chain experts have highlighted several factors supporting Solana’s bullish case:
• Accumulation by Whales: On-chain analytics firm Santiment reported a spike in large whale transactions, suggesting institutional accumulation.
• Network Activity Metrics: Solana’s daily active addresses and transaction volume have surged to 3-month highs, reflecting heightened network usage.
• Rare Chart Pattern: A “cup-and-handle” pattern on the daily chart implies potential for a 30–40% rally if resistance at $180 is cleared.
2. Skepticism and Risks
Critics argue that Solana’s rally is overextended, citing:
• Overbought RSI on Weekly Charts: The RSI currently resides near 75, signaling overbought conditions that could precede a correction.
• Competitive Pressure: Ethereum’s Layer 2 solutions (e.g., Arbitrum, Optimism) and rivals like Sui and Aptos continue to challenge Solana’s market share.
• Regulatory Risks: The SEC’s ongoing crackdown on crypto exchanges and tokens could dampen investor sentiment across the sector.
________________________________________
Future Projections: Path to $200 and Beyond
1. Short-Term Target: $180–$200
If Solana sustains its rally above $176, the next resistance zones to monitor are:
• $180: Psychological barrier and 200-day SMA.
• $190: Fibonacci extension level from the recent rally.
• $200: Historical resistance-turned-support from late 2023.
2. Long-Term Potential: $300+ in Q4 2024
Bullish scenarios envision SOL reaching $250–$300 by year-end, driven by:
• Spot SOL ETF Approvals: Regulatory greenlights in the U.S. could unlock billions in institutional inflows.
• AI and Web3 Integration: Solana’s partnership with AI projects (e.g., ChatGPT integration on Solana-based apps) could drive mainstream adoption.
• Bitcoin’s Bull Run: A broader crypto market rally, spurred by Bitcoin’s potential breakout above $80,000, would likely lift Solana’s price.
________________________________________
Risks and Challenges
1. Market-Wide Volatility
Cryptocurrencies remain highly correlated with macroeconomic factors, including U.S. interest rates and equity market performance. A sudden Federal Reserve pivot toward hawkish policy or a stock market crash could trigger a sector-wide sell-off.
2. Network Downtime and Security Risks
Solana has experienced periodic network outages and congestion during high demand. While the team has addressed these issues through upgrades, any future disruptions could erode trust.
3. Regulatory Uncertainty
The SEC’s classification of SOL as a security (vs. commodity) remains unresolved. Adverse regulatory rulings could impose restrictions on trading and staking.
________________________________________
Conclusion: Is Solana a Buy Ahead of the Next Leg Up?
Solana’s recent rally above $162 and consolidation near $175 underscores its resilience and growing appeal among traders and developers. Technical indicators, coupled with fundamental catalysts like 1inch integration and memecoin adoption, paint a bullish picture for SOL’s trajectory toward $180 and $200. However, investors must remain cautious of overbought conditions, competitive pressures, and regulatory risks.
For those considering exposure, a dollar-cost averaging (DCA) strategy could mitigate volatility risks, while close monitoring of on-chain metrics and macroeconomic trends will be critical. As with all investments in crypto, thorough research and risk management are paramount.
Disclaimer: This article is for informational purposes only and does not constitute financial advice. Cryptocurrency markets are highly volatile and speculative. Always consult a qualified professional before making investment decisions.
Solana Found support at $169.0FenzoFx—Solana found support at $169.0, consolidating after its recent gains on Friday. The primary trend remains bullish above this level. Furthermore, the uptrend will likely resume if the price exceeds the immediate resistance level at $179.5. In this scenario, the next bullish target could be the $200.0 psychological level.
Please note that the bullish outlook should be invalidated if SOL/USD dips below $169.0.

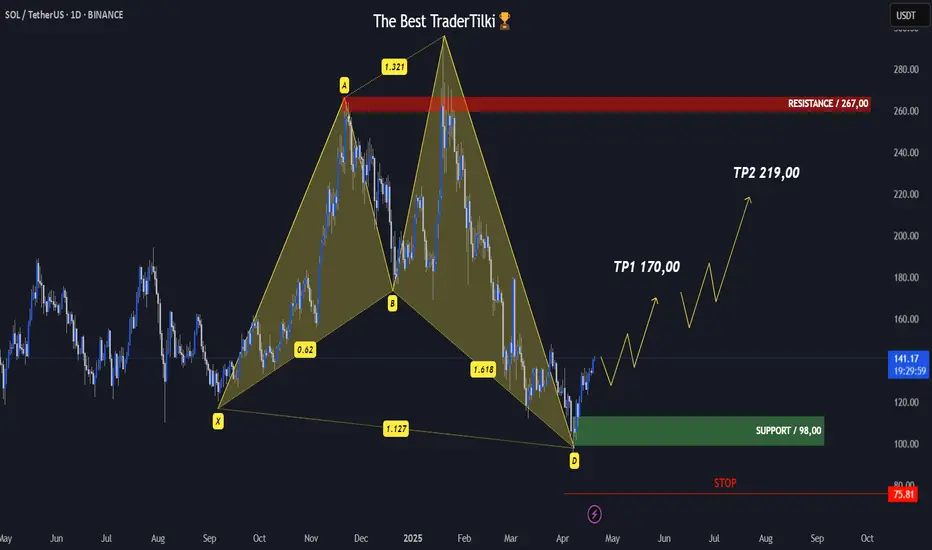
SOLUSDT | 1 DAY | SWING TRADING Hey friends!
I’ve put together a detailed analysis on Solana just for you. The harmonic pattern has completed, and we’ve already seen some strong buying from that exact zone. 📈
Now, I’ve got two targets for you:
🎯 Target 1: 170.00
🎯 Target 2: 219.00
🔴 STOP: 75,81
"Just a heads-up — since this is a swing trade, the target might take some time to hit. Good to keep that in mind."
Remember, the more love and likes I get from you, the more motivated I am to keep sharing these analyses. All I ask is for a simple like to show your support. 💙
Huge thanks to everyone supporting with their likes — I truly appreciate it!
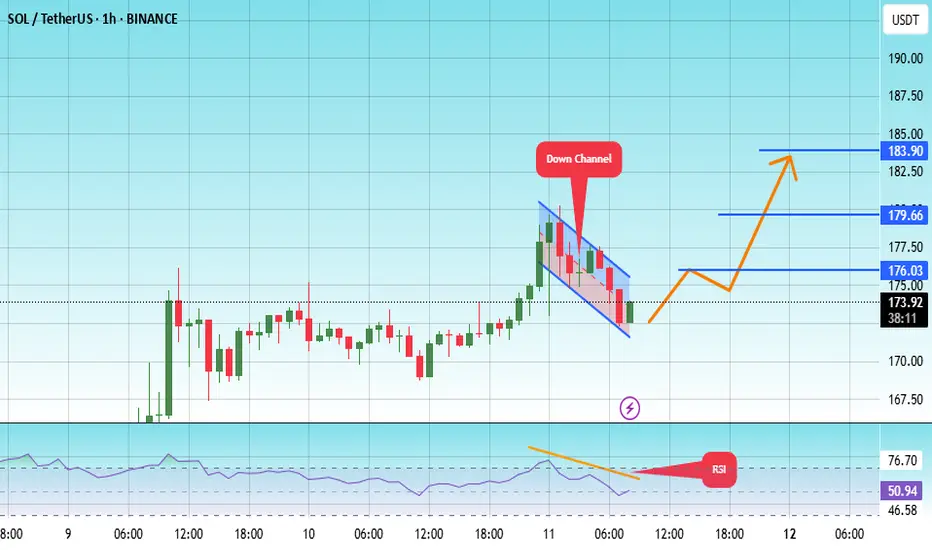
#SOL/USDT#SOL
The price is moving within a descending channel on the 1-hour frame, adhering well to it, and is on its way to breaking it strongly upwards and retesting it.
We are seeing a bounce from the lower boundary of the descending channel, this support is at 172.
We have a downtrend on the RSI indicator that is about to break and retest, which supports the upward trend.
We are looking for stability above the 100 moving average.
Entry price: 173
First target: 176
Second target: 180
Third target: 183
Very Bullish with a a clear Pullback incoming BINANCE:SOLUSDM2025
From the weekly chart we can clearly see that SOL has recovered quite nicely from the tariff scares the world markets have experienced in the last 2-3 months. We do have lowering Bullish volume over the last few weeks and we are approaching a weekly OB- (ICT Concepts) that was formed in the late February. I fully expect SOL price to spike into it, reverse for a good pullback to enter more longs and long term holdings and then continue higher from we clear $180.58 on the SOL/USD Binance chart 📈. Once that final level is cleared there is no stopping SOL until maybe the $250. If Bitcoin and the rest of the overall crypto markets remain Bullish for the rest of 2025 into January 2026 (seasonal tendency) SOL price could push to ALL Time Highs.

#SOL/USDT#SOL
The price is moving within a descending channel on the 1-hour frame, adhering well to it, and is on its way to breaking it strongly upwards and retesting it.
We are seeing a bounce from the lower boundary of the descending channel, this support is at 144.
We have a downtrend on the RSI indicator that is about to break and retest, which supports the upward trend.
We are looking for stability above the 100 moving average.
Entry price: 149
First target: 153
Second target: 156
Third target: 161

HolderStat┆SOLUSD bullish channel points higherAfter a consolidation base, SOL launched into a growing ascending channel. As long as price respects the lower trendline, bullish momentum is expected to continue with a potential target near $170-180.
💡 Short-term pullbacks inside the channel may offer entries as bulls eye higher resistance zones.
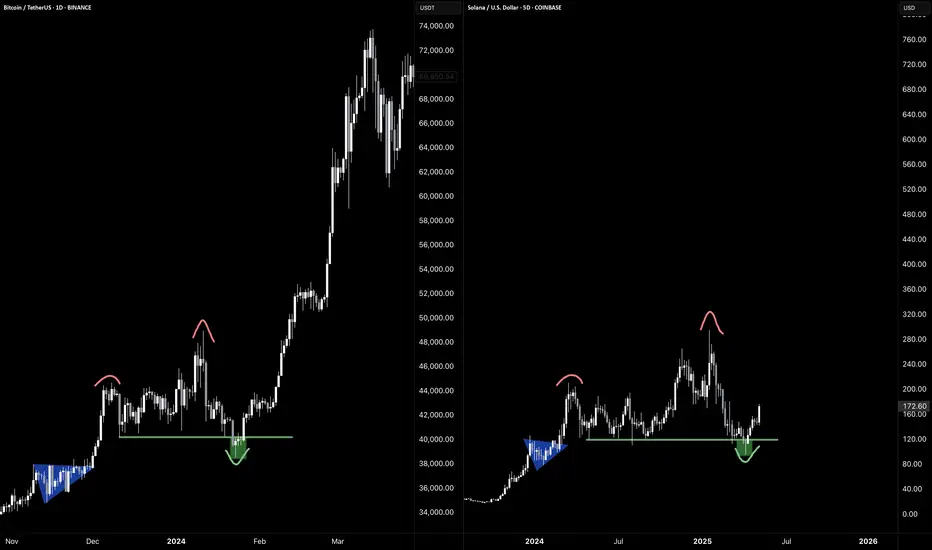
$SOL - Long FractalCRYPTOCAP:SOL Fractal compared with CRYPTOCAP:BTC from 2024.
Do not fade Solana.
My top pick this cycle.
-@CryptoCurb
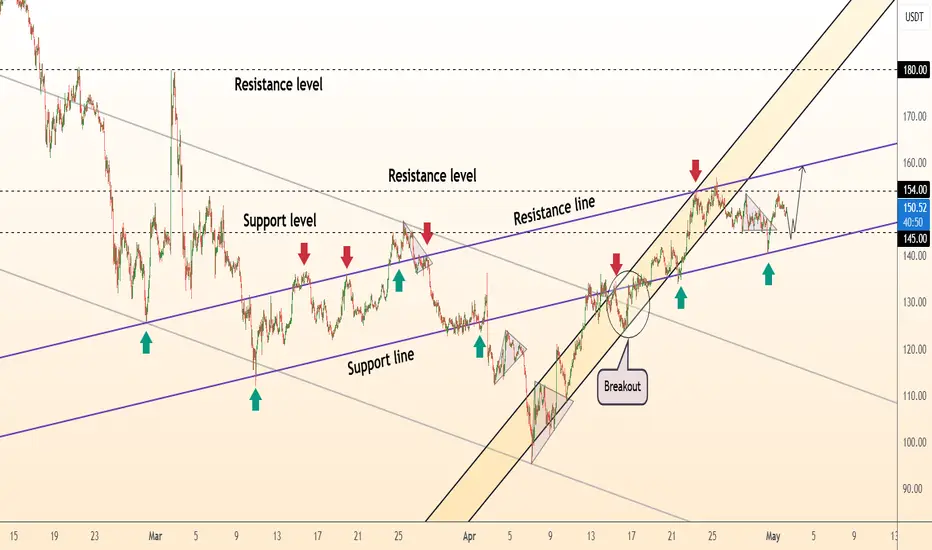
DeGRAM | SOLUSD Held the $145 level📊 Technical Analysis
● SOL broke above the long-term descending resistance near $130 and held it on a retest, confirming a bullish reversal.
● A consolidative range between $145 support and $154 supply has formed; a decisive break above $154 targets the rising-channel top near $160.
💡 Fundamental Analysis
● SOL staking volume recently surpassed Ethereum’s, underlining robust on-chain yield demand.
● DeFi Development Corp filed to offer $1 billion in securities to boost SOL holdings, signaling institutional accumulation.
✨ Summary
Resistance-turned-support at $145, strong staking growth, and corporate demand support a short-term long bias: targets $154 → $160; invalidation below $140.
-------------------
Share your opinion in the comments and support the idea with a like. Thanks for your support!
Solana - Here Comes The Bullish Reversal!Solana ( CRYPTO:SOLUSD ) might head for new all time highs:
Click chart above to see the detailed analysis👆🏻
Just a couple of months ago, Solana perfectly retested the previous all time high and created an expected short term rejection. However, with the current major support area and a potential bullish reversal, Solana remains in a strong market, potentially heading for new all time highs.
Levels to watch: $120, $250
Keep your long term vision,
Philip (BasicTrading)

Solana Price Target: Expert Predicts $180–$200 BreakoutSolana Price Target: Expert Predicts $180–$200 BreakoutSolana (SOL), one of the most prominent blockchain platforms in the cryptocurrency market, has been on a tear recently, with its price rallying significantly. As of today, Solana’s bullish momentum has caught the attention of investors and analysts alike, with many predicting a breakout to the $180–$200 price range. This optimistic outlook comes on the back of strong technical indicators, increasing adoption, and improving fundamentals.
In this article, we’ll explore the key factors driving Solana’s price rally, analyze expert predictions, and assess whether SOL can sustain its upward trajectory to hit the $200 mark.
________________________________________
Solana’s Recent Rally: A Snapshot
Solana has seen a remarkable recovery in recent weeks, with its price climbing steadily after periods of consolidation and minor corrections. The blockchain platform, known for its high-speed transactions and low fees, is once again making waves as it captures investor interest.
Key Highlights of the Rally:
1. Price Momentum: Solana’s price surged by over 30% in the last week, breaking past key resistance levels and positioning itself for further gains.
2. High Trading Volumes: The rally has been accompanied by a significant increase in trading volumes, indicating strong market participation.
3. On-Chain Activity: Solana’s on-chain activity has also spiked, with rising transaction counts and growing usage of decentralized applications (dApps) on its network.
These developments underscore the growing confidence among investors and the sustained demand for Solana’s ecosystem.
________________________________________
What’s Driving Solana’s Price Surge?
The ongoing rally in Solana's price is being fueled by a combination of technical, fundamental, and macroeconomic factors. Let’s take a closer look at these drivers:
1. Strong Technical Indicators
Technical analysis suggests that Solana’s price is in a bullish breakout phase. Analysts have pointed to several key technical patterns that support the prediction of a move toward $200:
• Ascending Triangle Pattern: Solana’s price chart shows an ascending triangle formation, a bullish continuation pattern that typically signals a breakout to higher levels.
• Support and Resistance Levels: SOL recently broke through the $150 resistance level, which had previously acted as a key barrier. With this resistance now flipped into support, the path to $180–$200 becomes more feasible.
• Moving Averages: Solana’s price is trading well above its 50-day and 200-day moving averages, a classic bullish signal that indicates strong upward momentum.
2. Ecosystem Growth
Solana’s ecosystem has been expanding rapidly, with an increasing number of developers and projects choosing its blockchain for their applications. Key areas of growth include:
• DeFi Expansion: Solana has become a hub for decentralized finance (DeFi) projects, with platforms such as Raydium, Serum, and Marinade gaining traction.
• NFT Boom: The Solana blockchain has also emerged as a major player in the non-fungible token (NFT) space, hosting popular marketplaces like Magic Eden and SolSea.
• Gaming and Web3: Solana’s high-speed, low-cost infrastructure makes it an ideal platform for blockchain-based gaming and Web3 applications.
This growing ecosystem contributes to increased demand for SOL tokens, driving up their value.
3. Institutional Interest
Institutional investors have been steadily increasing their exposure to Solana. This trend is evident from the inflows into Solana-based investment products and the growing number of hedge funds and venture capital firms backing Solana projects.
Notably, Solana’s ability to process thousands of transactions per second at a fraction of the cost of Ethereum has made it an attractive alternative for institutional use cases.
4. Favorable Market Conditions
The broader cryptocurrency market has also been in a recovery phase, with Bitcoin, Ethereum, and other major cryptocurrencies rallying. This positive market sentiment has spilled over into Solana, amplifying its price gains.
Additionally, the macroeconomic environment—characterized by easing inflation concerns and renewed interest in risk assets—has created a conducive environment for cryptocurrencies to thrive.
________________________________________
Expert Predictions: $180–$200 Breakout
Several experts and analysts have weighed in on Solana’s price trajectory, with many predicting a move to $180–$200 in the near term. Here are some of the most notable predictions:
Technical Analysts See Bullish Patterns
Prominent cryptocurrency analysts have pointed to bullish technical patterns that suggest Solana could soon reach $200. For instance:
• Ascending Triangle Target: Based on the ascending triangle pattern, the measured move suggests a price target of $190–$200.
• Fibonacci Retracement Levels: Analysts using Fibonacci retracement levels have identified $180 and $200 as key levels of interest.
Institutional Analysts Eye $200
Institutional analysts have also expressed optimism about Solana’s price potential. A recent report by a leading investment firm highlighted the following factors supporting a $200 price target:
• Increasing adoption in the DeFi and NFT sectors.
• Strong developer activity on the Solana blockchain.
• Growing institutional inflows into Solana-based products.
Community Sentiment
The Solana community remains highly bullish, with many investors and enthusiasts sharing optimistic price targets on social media platforms. This positive sentiment often serves as a self-reinforcing mechanism, attracting more buyers and driving up the price.
________________________________________
Challenges and Risks
While the outlook for Solana appears promising, it’s important to consider the potential challenges and risks that could impact its price trajectory:
1. Competition from Ethereum and Layer-2 Solutions
Ethereum’s transition to Proof of Stake (PoS) and the rise of Layer-2 scaling solutions like Arbitrum and Optimism could pose challenges to Solana’s market share. These competitors are addressing scalability issues, reducing the competitive advantage that Solana has traditionally enjoyed.
2. Network Outages
Solana has faced criticism for network outages in the past, which have raised concerns about its reliability. Any future outages could undermine investor confidence and slow adoption.
3. Regulatory Uncertainty
The cryptocurrency market remains highly sensitive to regulatory developments. Unfavorable regulations targeting DeFi, NFTs, or blockchain technology could negatively impact Solana and the broader market.
4. Market Volatility
Cryptocurrencies are inherently volatile, and Solana is no exception. While the current rally is encouraging, sharp corrections are always a possibility, particularly if external factors such as macroeconomic events or market sentiment shift.
________________________________________
Can Solana Sustain Its Momentum?
For Solana to sustain its momentum and achieve the $200 price target, several factors need to align:
• Continued Ecosystem Growth: Solana must maintain its position as a leading platform for DeFi, NFTs, and Web3 applications. This requires ongoing innovation and developer support.
• Institutional Adoption: Increased participation from institutional investors will be critical to sustaining demand for SOL tokens.
• Positive Market Sentiment: The broader cryptocurrency market needs to remain in a bullish phase, providing a favorable backdrop for Solana’s price growth.
• Resolving Network Issues: Addressing concerns about network reliability and scalability will be key to maintaining investor confidence.
________________________________________
Conclusion
Solana’s recent rally and the expert predictions of a $180–$200 breakout highlight the growing confidence in its ecosystem and price potential. Driven by strong technical indicators, ecosystem expansion, institutional interest, and favorable market conditions, Solana appears well-positioned for further gains.
However, challenges such as competition, network reliability, regulatory risks, and market volatility remain. Investors should approach Solana with cautious optimism, balancing the bullish outlook with an awareness of the risks involved.
As Solana continues its upward trajectory, the $200 milestone could mark a significant achievement for the blockchain platform, solidifying its status as one of the leading players in the cryptocurrency space. Whether this rally leads to sustained growth or faces temporary setbacks, one thing is clear: Solana’s growing ecosystem and innovative technology make it a force to be reckoned with in the world of blockchain and decentralized applications.
