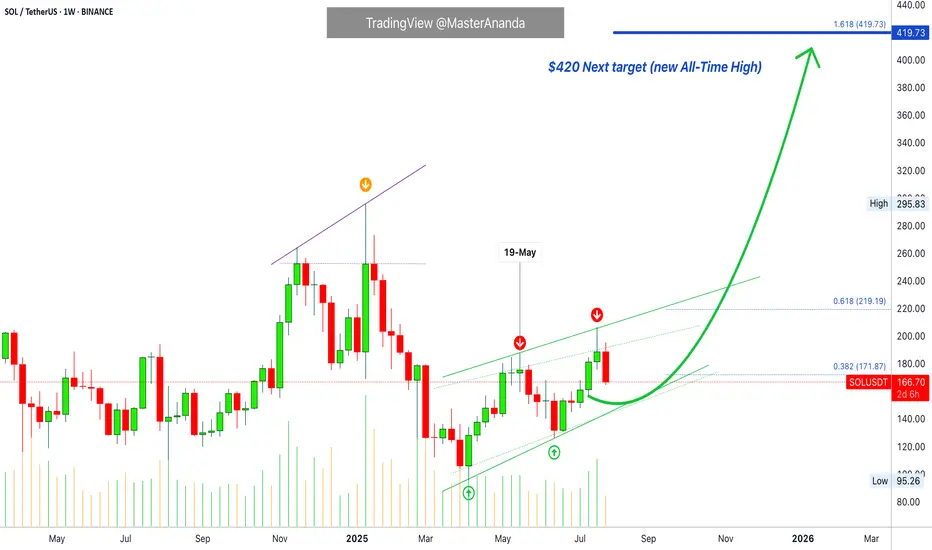
Solana Update · Retrace, Bears & The Bullish BiasSolana had a retrace in May. Notice the 19-May date on the chart. This retrace produced four weeks red. The bullish move that led to this retrace lasted 6 weeks. The last rise lasted five weeks and the current retrace might last only two weeks, can be less.
We are seeing Solana rising but this rise is not a one-time off event, this is a trend that is developing. An uptrend as a long-term phenomena is different to a short-term bullish moves. A short-term move tends to be really fast, one strong burst and that's it. A long-term move is different. Instead of seeing 2-3 candles and Solana trading at $1,000, we see dozens and dozens of candles with prices slowly rising. There are strong fluctuations but the end result is always up. And that's how you see the fluctuations on the chart.
Solana moved up and then immediately started to retrace. Then another rise and another retrace again. This retrace will end and prices will continue to grow long-term. The bulls are in. The bull market is on. Solana, Bitcoin, Crypto and the rest of the Altcoins market is going up.
Namaste.
Solusdt
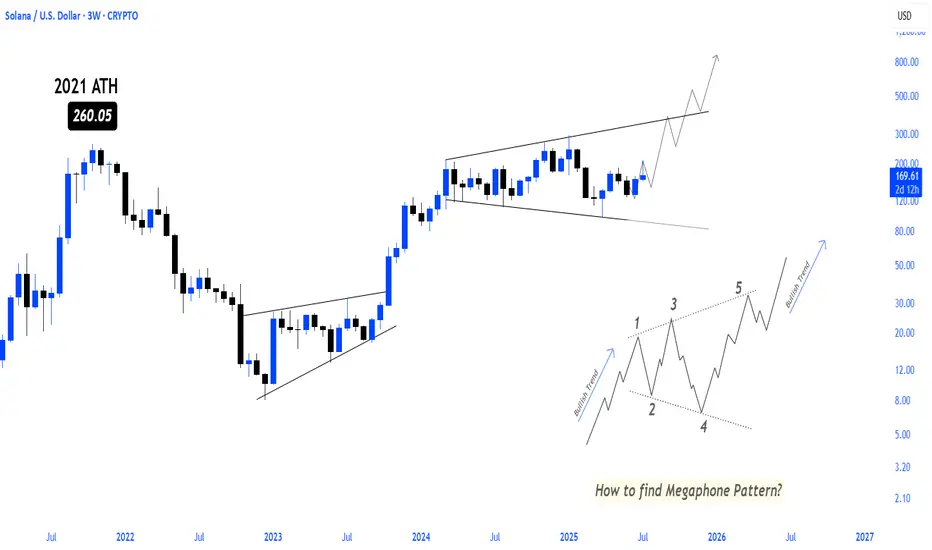
SOLANA BULLISH MEGAPHONE PATTERN LOADING! solana continues to move step by step towards higher levels within the bullish megaphone pattern, which will make movements towards ATH and more inevitable in the coming period
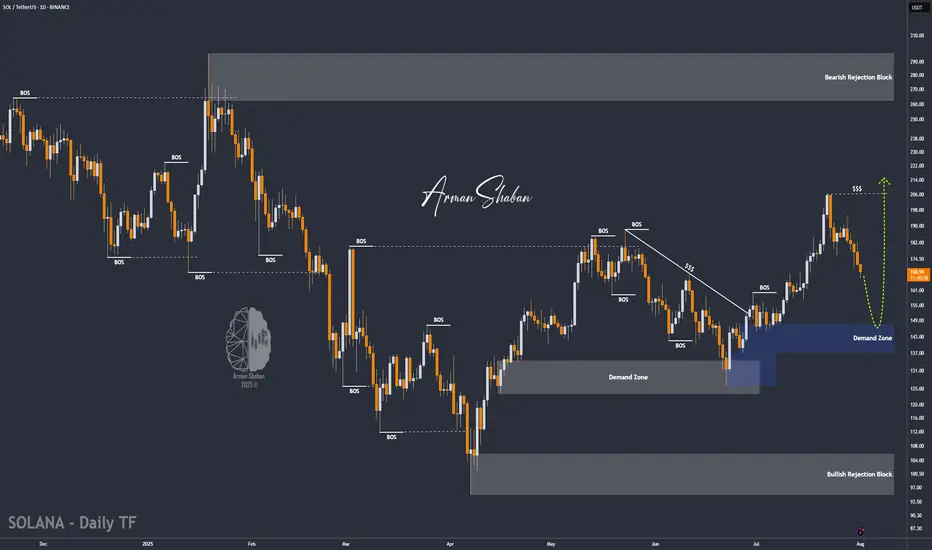
SOL/USDT | NFP Volatility Could Trigger Drop Toward $154!By analyzing the Solana chart on the daily timeframe, we can see that the price is currently trading around $169. If it fails to hold above the $168 level, a deeper drop could follow. With the upcoming NFP data release, increased volatility is expected across the markets. If Solana begins to decline, the potential correction targets are $163, $157, and $154. Watch the $145–$154 zone closely for a possible bullish reaction and buy opportunity.
Please support me with your likes and comments to motivate me to share more analysis with you and share your opinion about the possible trend of this chart with me !
Best Regards , Arman Shaban
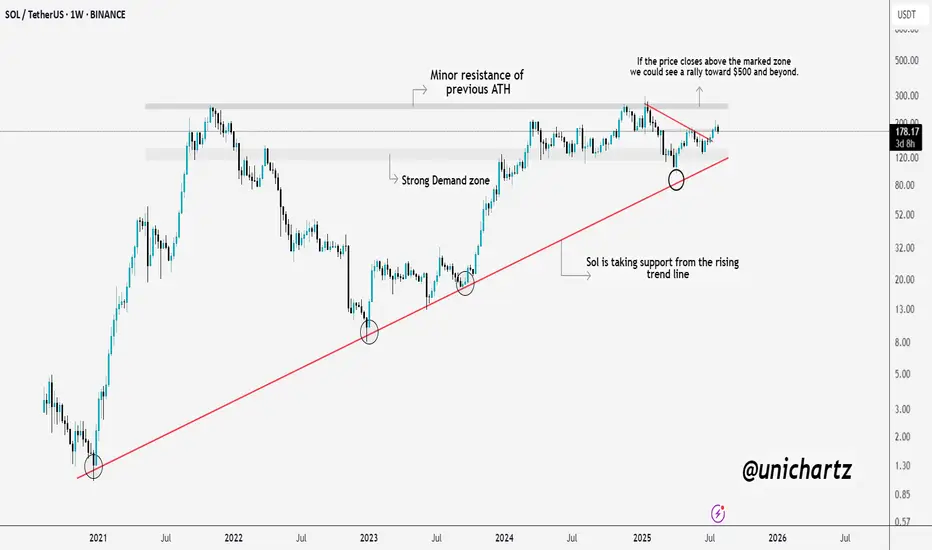
Massive Move Loading? $SOL Prepping for a BreakoutSolana is showing real strength here.
CRYPTOCAP:SOL consistently taking support from the long-term rising trendline, a sign that buyers are defending key levels. We're also approaching a critical resistance zone, which was the previous ATH area.
If SOL manages to close above this zone, we could witness a strong rally towards $500 and beyond. Until then, it’s a crucial level to watch, a breakout here could set the stage for the next leg up.
DYOR, NFA
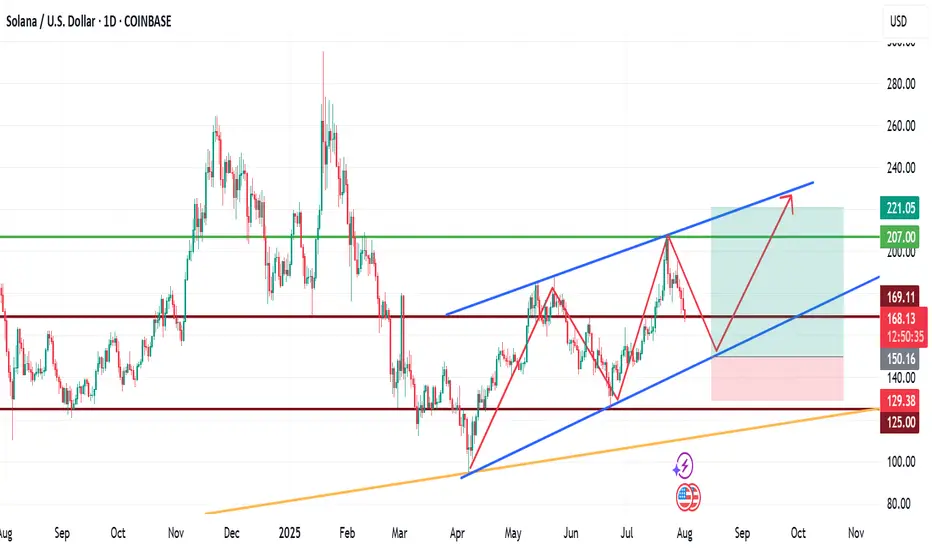
My View for SOLANA next moveMy View for SOLANA next move.
Technically, SOL has been trading within a channel for a while now, with the formation of HHs and HLs.
If fundamentals play out positively long to mid-term, we are likely to see SOLNA fall to $150 zone before another upward leg forms. This leg may rally to as high as $220.
Trade with care.
If you found this helpful, please connect with me.
Like, comment and share
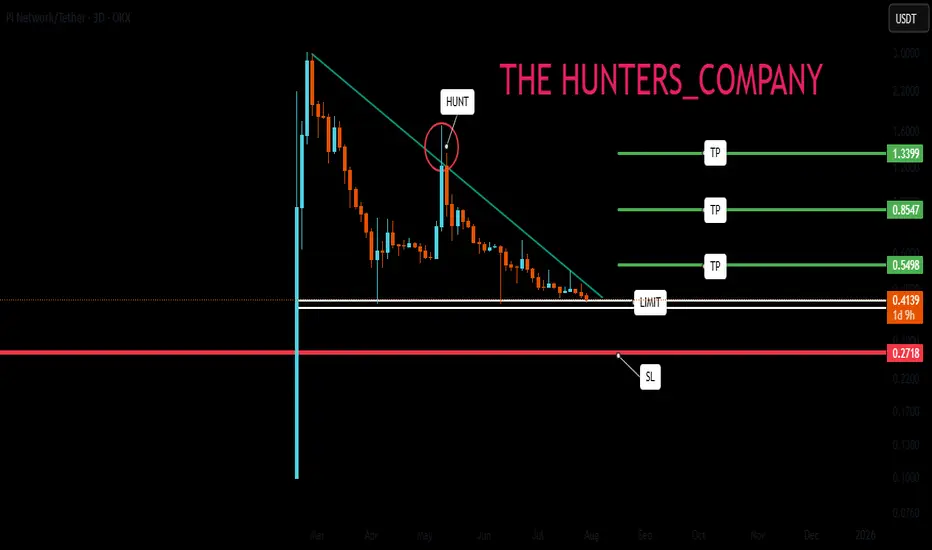
PI NETWORK : Will it finally be pumped?Hello friends🙌
👀According to the decline we had, you can see that the price has reached an important area and has formed a floor in this area. Considering the classic ego that is forming on support, you can enter the trade by breaking the resistance, of course, by managing risk and capital and moving with it to the specified goals.
🔥Follow us for more signals🔥
*Trade safely with us*
The next levels for Solana coinIn this video I recap the previous video and discuss what may be next after the current retracement .
I reveal some important levels that sit below as well as the relationship with the Eth/Btc chart.
Tools used vwap, Fibs and volume profile .

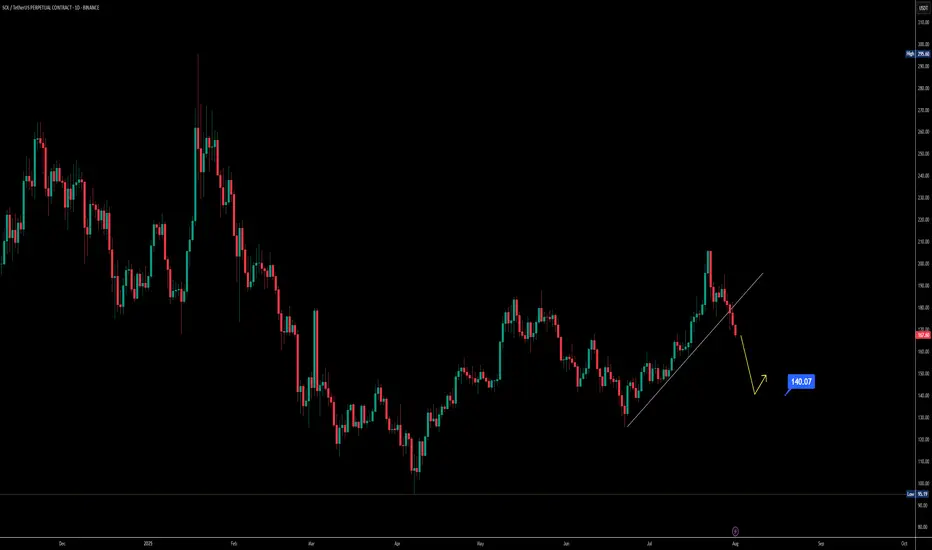
$SOL Loses Key Support | Eyes on $140 & $95 Zones📉 CRYPTOCAP:SOL Loses Key Support | Eyes on $140 & $95 Zones
🕵️♂️ On the daily timeframe, #Solana has officially lost its key support near $140, which previously acted as a strong bounce zone. A failure to reclaim this level could open the gates for a deeper drop toward the $95–$100 support range.
📊 Indicators signal downside:
RSI is trending downward
MACD shows a bearish crossover
Stochastic RSI confirms continued selling pressure
⚠️ Macro pressure adds fuel to the fire: August 1st tariff tensions, with expected news from Trump on charging Paris, are weighing down global risk assets. Historically, August tends to be a bearish month for crypto markets.
🎯 Key Levels to Watch:
Immediate Resistance: $140
Major Support: $95–$100
🧠 Trade wisely and manage risk accordingly.
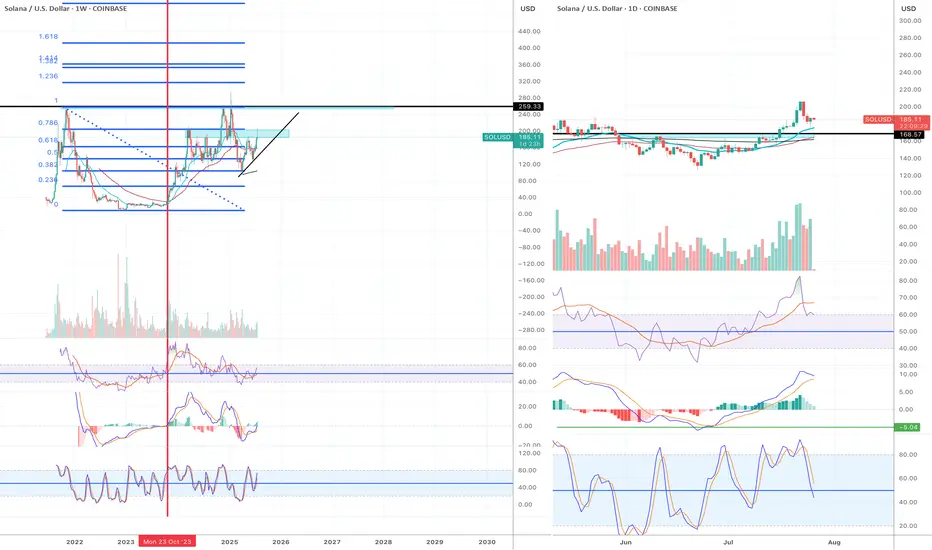
Very Bullish!!
Solana chart looks very bullish. The price is currently dropping but I think it is a very healthy correction.
Weekly chart:
1) all momentum indicators just entered the bull zone.
2) The chart is forming higher highs.
Daily:
1) EMA55 finally crossed EMA200. The last time they crossed was October 2023 (see red vertical line in the chart) and it was the beginning of the macro bull trend.
2) Momentum indicators have reached overbought territory and crossed to the downside, however, given weekly momentum indicators have just entered the bull zone, this move is likely to be corrective action.
3) When EMA55 and EMA200 cross, the price often retraces initially to EMAs (21, 55 or 200). Once it completes the pull back, I anticipate the price to move to the previous ATH and beyond.
This is the time when high leverage trading volume increases.
Be careful not get wicked out. Focus on monthly/weekly/daily charts and ignore the noise in the lower timeframes.
Crypto market review: Bitcoin, ETH, and Altcoins Setting Up for Prepared a new in-depth crypto market video update covering BTC, Ethereum, and key altcoins. Here’s a quick summary of the current landscape and what I’m tracking in the charts:
We’ll begin with Bitcoin. After the Fed’s decision, BTC showed a constructive shakeout and has been consolidating tightly around the same range for three weeks. I previously anticipated resistance near the 1.23 area and expected a sideways phase within the 1.15–1.13 support zone. That’s exactly what we’re seeing—shakeouts and quick recoveries. As long as we stay above 1.13 structurally, and especially above yesterday’s highs short-term, I expect BTC to push higher toward the 1.26–1.30 resistance zone.
Institutional buying during the post-Fed dip has been significant. Volume on Coinbase and Binance indicates strong participation, and Bitcoin treasuries have been accumulating. This bolsters confidence in the underlying trend structure.
I wrote in mid-July about BTC’s broader macro structure—this resistance region may trigger a prolonged consolidation, but ideally without breaking June lows. Short-term bias remains bullish.
Ethereum remains the strongest large-cap altcoin. It has respected the 8EMA on pullbacks and shows strength to target 4300–5100 in the coming weeks. It continues to lead risk-on sentiment.
XRP has been deep in consolidation, but we may be seeing a higher low forming. Any rally in BTC and ETH could lift XRP toward 3.30–4.60 levels, possibly even 5.00.
Solana showed strong action through late July, pulling back into mid-term support. As long as this structure holds, I expect upside toward 220–230 and potentially reclaiming ATH zones.
Hyperliquid has been a laggard but held its key macro support. If yesterday marked a bottom, I’ll be watching for higher lows and a move toward 55–60.
Other notable setups:
Brett: Both showing impulsive structures from April lows. Brett in particular looks poised for 74–77, potentially retesting May highs around 95.
ONDO: Recovering key zones and shaping a potential bottoming pattern.
SUI: Leading structure from July lows. After a likely wave-one completion, it could extend toward 5.15–7.70 before topping.
RENDER: Looks to have finished its correction. Potential long-term upside beyond May highs; the macro uptrend might already be underway.
SUPER: Since July breakout, forming a strong trend structure. If it holds the higher low, could reach 1.20–1.46 in coming weeks.
TON: Slow mover, but the macro pattern suggests a bottom with potential toward 4.60 short-term.
LINK: Hasn’t finished its move. Watching for 21–22 as a next target.
FET / Fetch.AI: Macro structure looks great. Watching for recovery from June lows with potential for strong continuation if structure holds.
Trump Coin: In a diagonal pattern post-failed impulsive breakout. If higher lows hold, watch for rally toward 13–14.
LTC: Linear and clean structure. Looks ready to push toward 130–145 before potential base-building.
UNI: Targeting 14–18+ in wave continuation if structure holds.
Let me know in the comments if there’s a specific coin you’d like me to go over. I’ll include it in future updates or make a quick standalone video.
Thanks for watching, and I wish you a successful trading week ahead. Let’s see how far this rally can go through the rest of the summer!

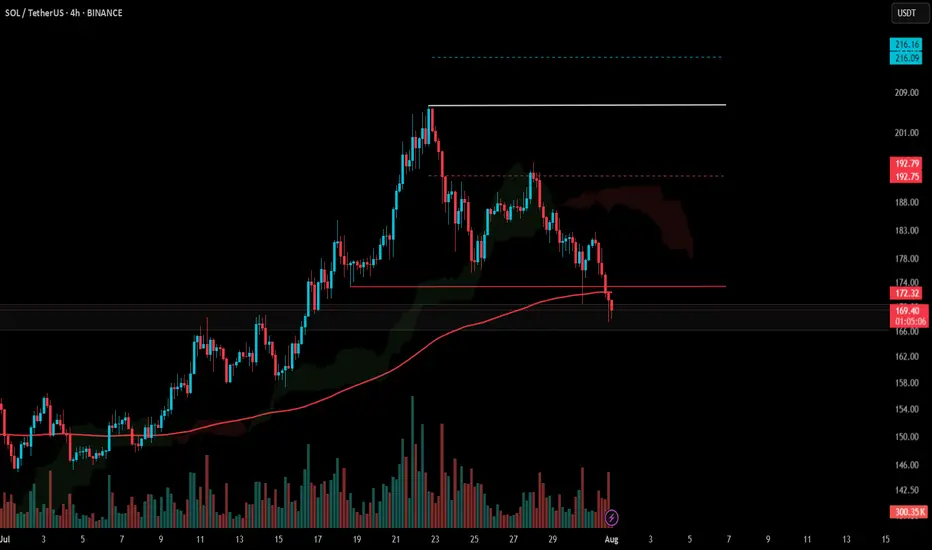
#SOL Update #6 – Aug 01, 2025#SOL Update #6 – Aug 01, 2025
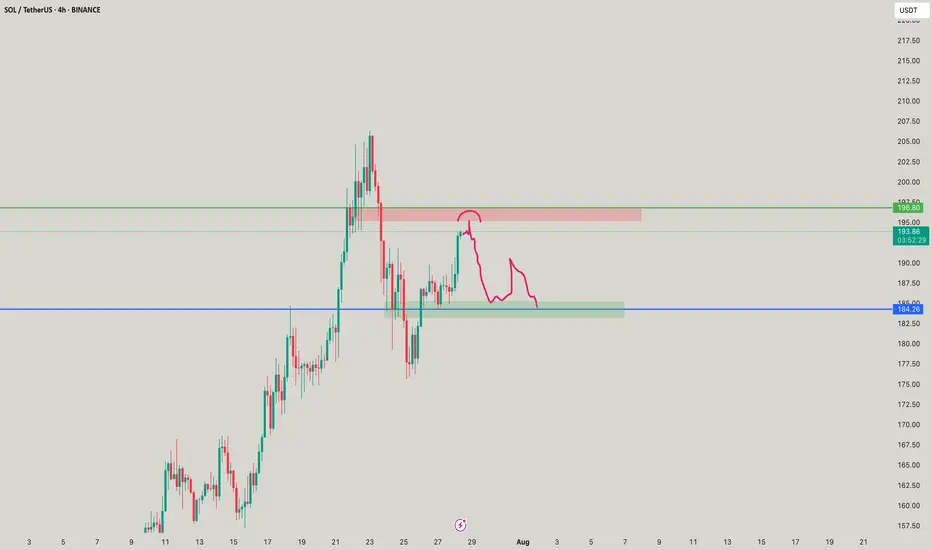
Unfortunately, Solana failed to hold the last low where its most recent impulsive move had started, and it closed below that level. This close also occurred below the MA200 band. In other words, Solana broke a very strong support on the 4-hour chart and moved downward, reaching the previous K-Level zone. It’s hard to say anything positive for Solana at this stage. If the current K-Level fails to hold, Solana may look for support around the $158 level. A long position on Solana is definitely not recommended. I also do not suggest a short position. However, unless there’s a strong reversal, it’s safe to say that Solana has entered a bearish phase on the 4-hour chart.
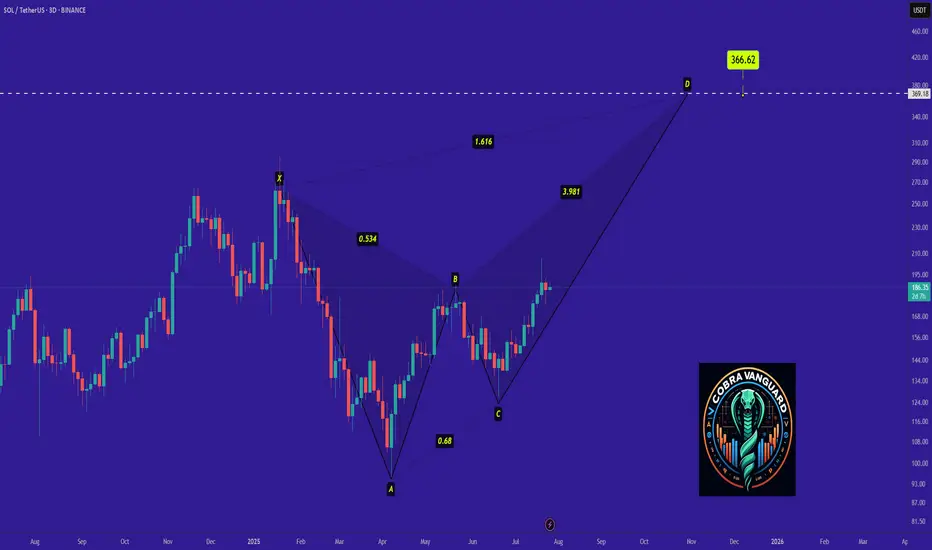
SOLANA could have a major retracement Solana completed a major ABC correction into a supply zone on the higher time frame (HTF), taking out the previous quarter’s highs.
On the daily chart, the RSI is overbought and signals the potential for a significant retracement.
Price action on the 4-hour chart shows a series of lower highs, indicating a bearish trend. If Solana fails to break above the previous high and trigger a market structure shift, the downtrend is likely to continue, leading to a deeper retracement on the higher time frames.

SolusdtHi snipers. On the one-day timeframe, the price is fluctuating in an ascending channel. It has now reached the middle line of the channel and the 103-day moving average support line is below it, which will help the price to move up again and reach the channel ceiling. If this support is broken, the price is likely to fall to the channel floor. This analysis is just a possibility. It is not a trading recommendation.

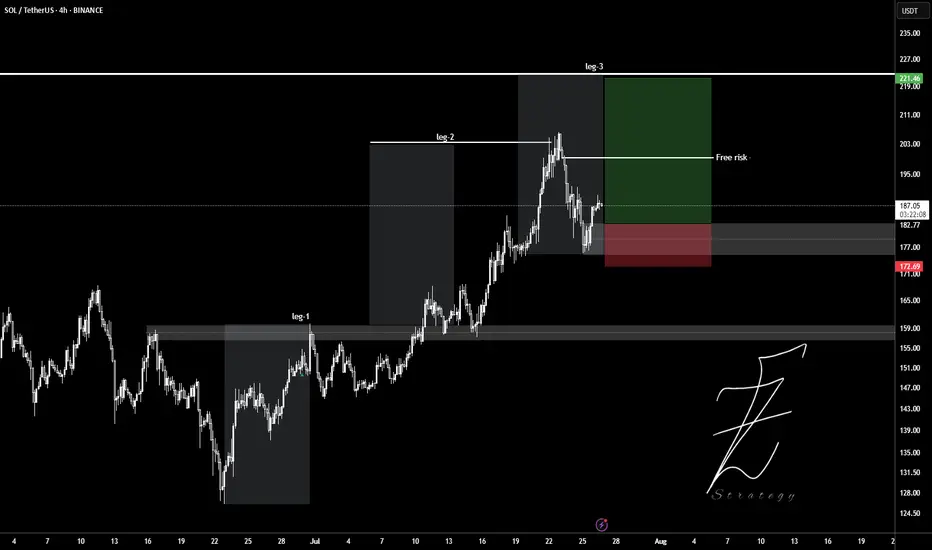
SOLUSDTWait for pollback to 180$ level and ready to get buy position.
Target set in leg2 and leg3.
Entry: 182
Stop: 177
Tp: 190 - 200 - 210 - 220
Please control Risk management.
FUTURES SIGNALFUTURES SIGNAL
Coin: SOL
Direction: LONG
🟢Input range: 179,5-179,7
✔️ТР: 182,47
❌SL: 178,11
Hedge scalp long after liquidity withdrawal. Target order block at 182.4. Stop behind PDL

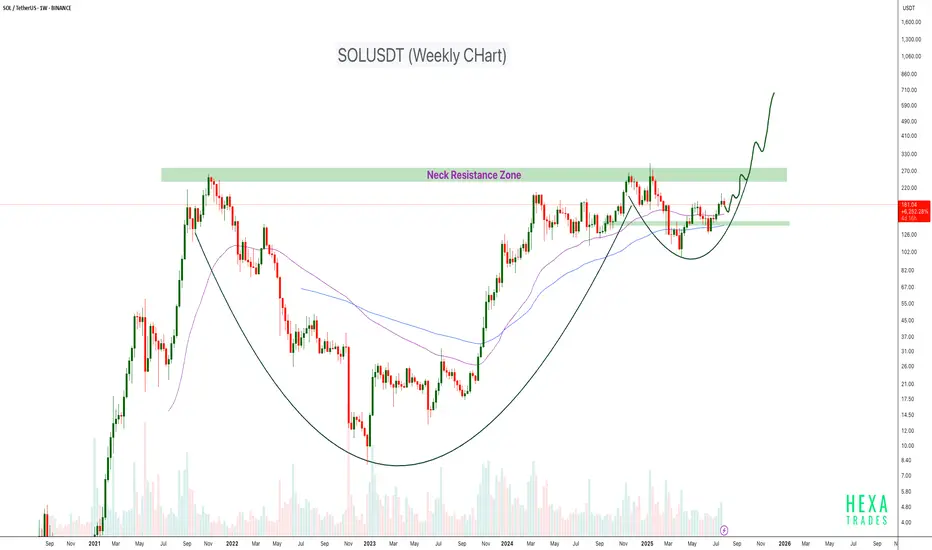
SOLUSDT Cup & Handle Formation CRYPTOCAP:SOL is forming a large Cup and Handle pattern on the weekly timeframe, a classic bullish continuation structure. Price is currently approaching the neckline resistance zone around the $250–$280 level. This area has acted as a major barrier in the past, rejecting the price multiple times, but the structure suggests it's now being retested with greater momentum.
If the neckline breaks cleanly with strong volume, the projected target could push SOL into the $600–$700+ range over the coming months.
Cheers
Hexa
BINANCE:SOLUSDT COINBASE:SOLUSD
Solana to $260?SOL is testing previous resistance as support around $180.
Reclaiming $184 could signal a test of last week's highs around $206.
Claiming $206 as support could signal a push towards $260.
Losing $180 could signal a retracement towards $165 or 1D 200MA.

SOL gives a SOUL!SoL just has happened as I told and mentioned earlier, this range looks very lucrative as of now and can turn things in a good manner! Observe where it goes

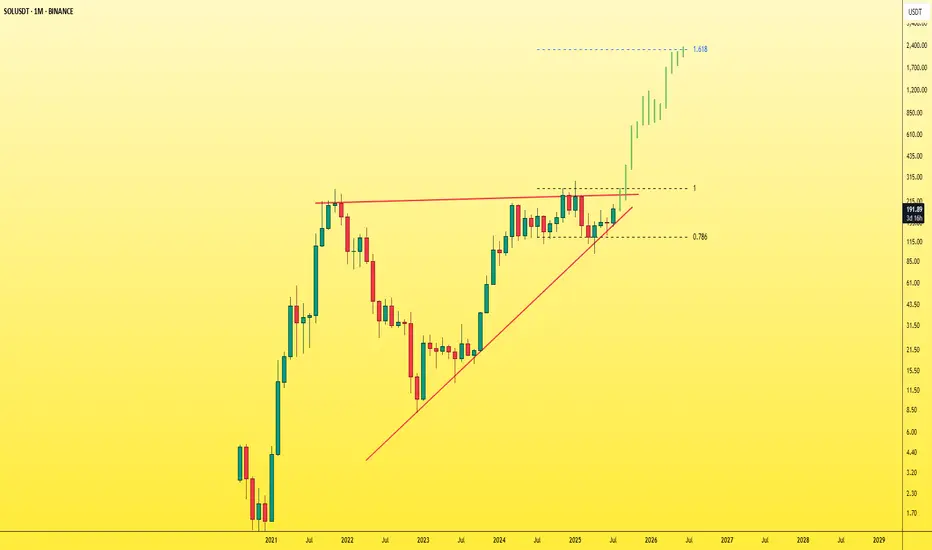
SOL - Don't miss the breakout before it's too late!The symmetrical triangle pattern on the monthly timeframe is showing signs of weakening after multiple failed breakout attempts — and now, a breakout seems highly likely.
Once SOL breaks out of this triangle, it will enter price discovery mode , opening the door to a massive bullish move. At that point, most traders will start saying “it’s too late”, while SOL keeps rallying aggressively — fueled by FOMO and liquidity traps.
You'll see:
- People outside the market waiting for a pullback that never comes.
- Traders inside the move getting shaken out by small dips and volatility.
Right now, SOL is still in a fair trading zone and available at a reasonable price .
Don’t wait for it to explode and then chase. Get in before the breakout .
Best Regards:
Ceciliones🎯
SOL - YOUR Choice of SOUL! LOLSOL as usual, pretty straight forward, short on the red, buy on the green, lines abbreviated for you to understand where
SOL - Time to buy again! (Update)Be careful with SOL !!!
we can hope that the price will act like a Crab pattern and the price will grow well.
I expect that the price will grow very quickly...
SOL/USDT Technical OutlookPrice may push higher towards the $194 resistance zone.
From there, a sharp rejection is expected, targeting the $171 support area.
If the market fails to hold $171, the next potential downside target lies around $140.
Key Levels:
Resistance: $194
Support: $171, then $140
Structure: Rising channel breakdown in play
📉 Bearish scenario activated if $171 fails to hold.

Just like #AKRM, #SOL can also pump 100%Just like #AKRM, #SOL can also pump 100%..
SOL will also have this kind of exit rally. Whether there is a war between the US, Iran, and Israel or not, the market will crash very badly.
