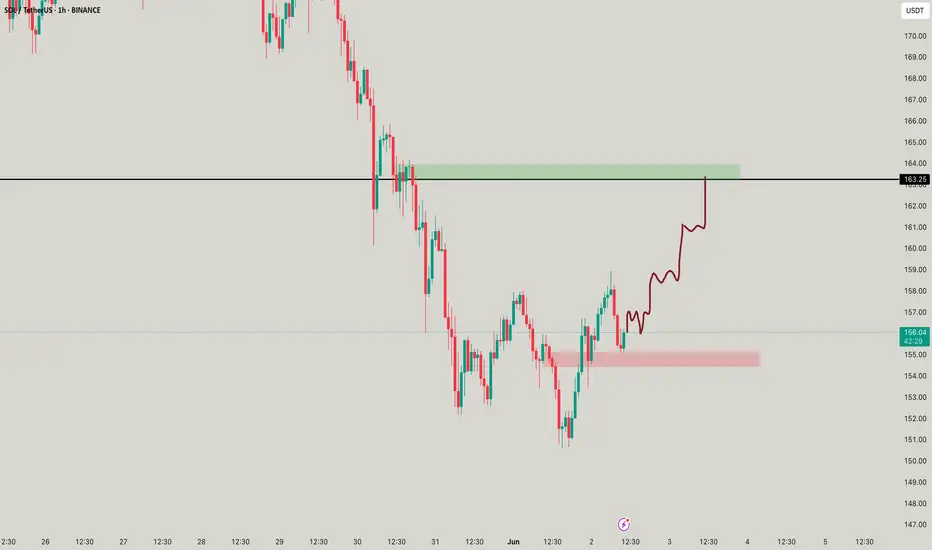
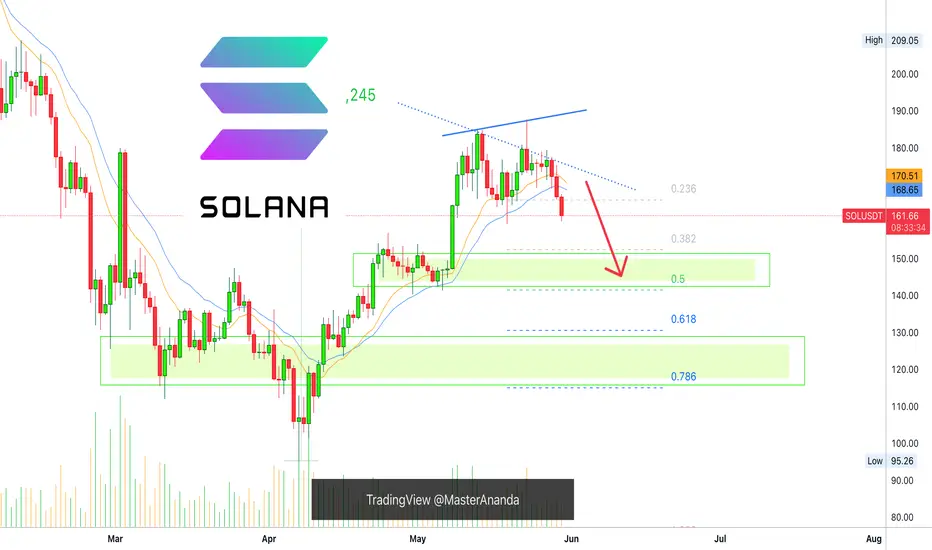
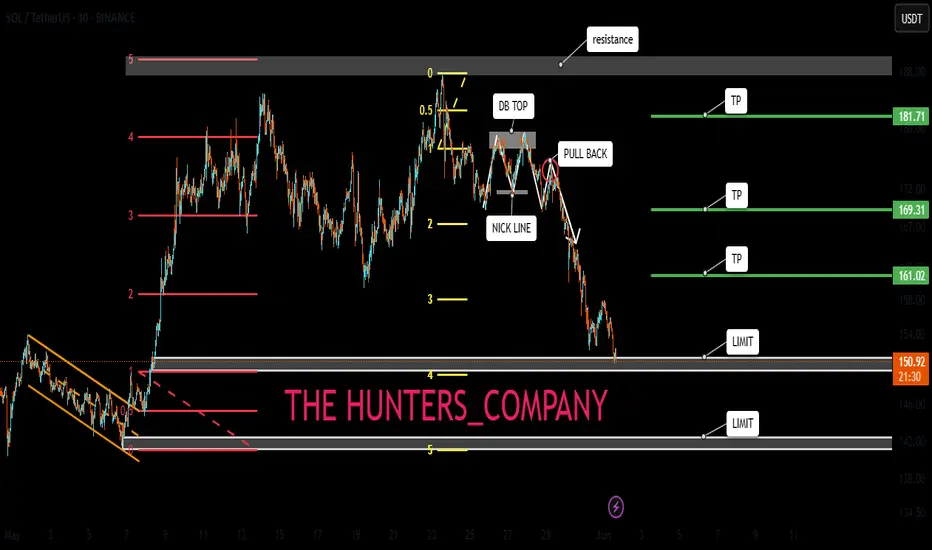
Solana UpdateHello friends🙌
After the price growth we had, the price hit the resistance level of $160 twice and failed to break it, which caused a double top pattern to form, which if confirmed, there is a possibility of falling to the specified areas.😉
The specified areas are good prices for buying in steps, of course, with capital and risk management.✔
🔥Join us for more signals🔥
*Trade safely with us*
Solusdt

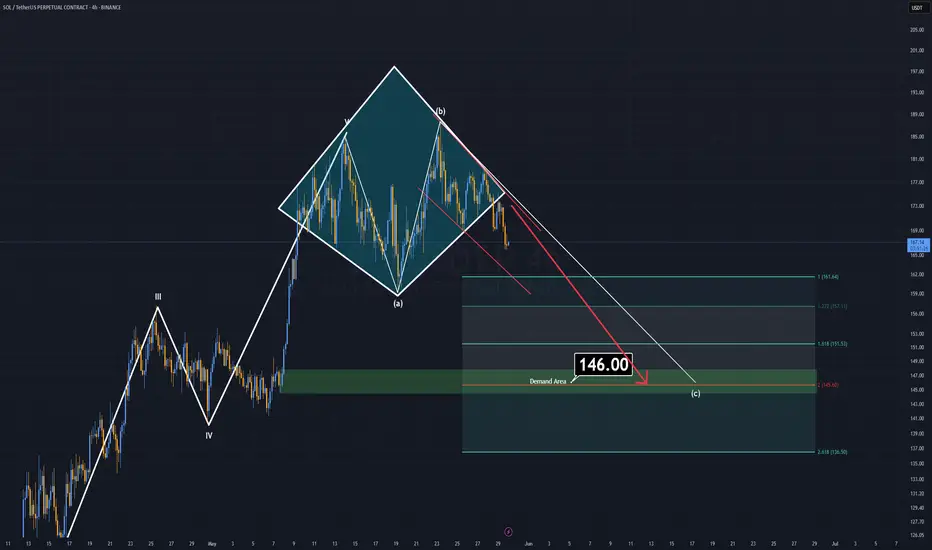
Red Lights for SOLANASolana has recently completed its 5-wave impulsive rise, and now a correction phase appears to be underway. Notably, a diamond top formation has formed and already broken to the downside, further supporting the short-term bearish outlook.
As long as SOL trades below the $180 resistance, this corrective scenario remains valid.
I currently do not expect a drop below the $146 support zone, making this a structured micro pullback within a larger bullish macro trend.
This setup offers opportunities for both short-term short and long entries, depending on how the price reacts near key levels. While the macro structure and fundamentals remain highly bullish for Solana, this correction could provide an ideal re-entry point before the next major leg up.
— Thanks for reading.
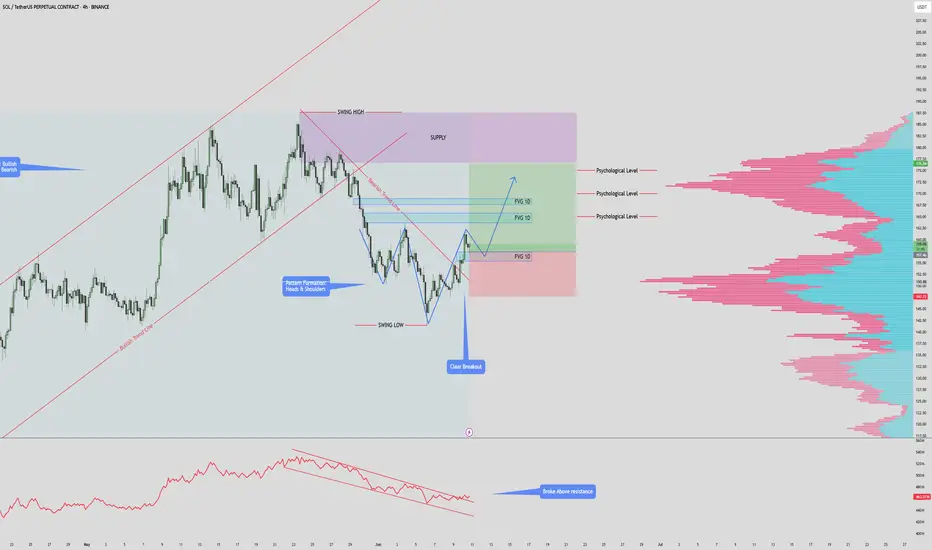
$SOLANA $180 PUMP INCOMINSOL/USDT – 4H Chart Summary
Market Structure:
HTF: Bullish trend remains intact.
LTF: Previously bearish, now showing early signs of a bullish reversal.
Pattern Formation:
Potential Inverse Head & Shoulders forming.
Neckline at $157 — must hold for pattern to complete.
Break above previous high will invalidate Inverse Head & Shoulders.
Trendline & Breakout:
Price has broken above the descending bearish trendline.
Indicates a momentum shift from bearish to bullish.
Fair Value Gaps (FVG):
1D FVG below current price – potential retest & long entry zone.
2x 1D FVG above price – act as targets or supply areas.
Psychological Levels & Volume:
Key levels at $165, $170, $175.
Volume profile shows high liquidity at each of these levels – strong TP zones.
OBV Indicator:
OBV has broken above resistance – supports bullish continuation.
Trade Scenarios:
Bullish Setup:
Long on retest of lower FVG zone ($142–$145).
Target TPs: $165 → $170 → $175 (align with psychological & high-volume areas).
Invalidation:
Break below FVG support or failure to hold above $142.
Is there hope for Solana?After a retest of support around $142, SOL is testing previous support as resistance around $152.
A strong break and retest of the $153 area could signal price reclaiming support and heading towards $166.
Failing to do so could lead to a retest and confirmation of $140 as support. Of course, losing support would signal further weakness towards $136 before a reversal potentially taking place.
As mentioned before, price is still trading below 1D 200MA, which could either be signaling weakness or the potential for more upside.
Considering the downward direction of the 1D 200MA could also be a bearish signal, however, this also usually happens before a reversal.
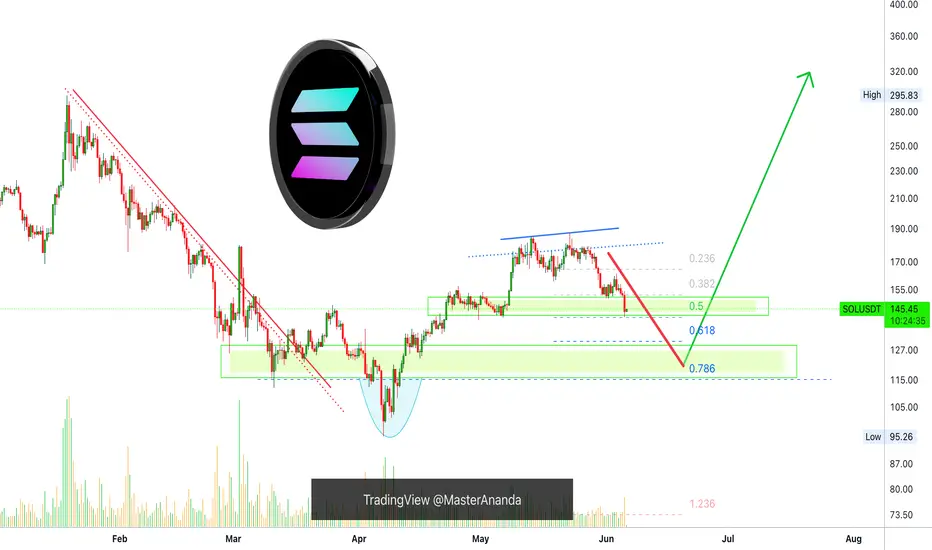
Solana >>> all trendlines are brokenHello guys!
As you can see, all of the trendline is broken, and after forming a double top in Solana, we can see a bearish trend is running!
I believe this downward movement will continue until the price touches the mentioned area!
The pointed area is the target level!
And the blue area has its own potential for getting long!

Solana Bullish, Retrace Over! Aim For $620 or $1,020 In this 2025 Cryptocurrency bull market, you should be aiming for $620 or $1,020 for Solana, $420 is the minimum.
How are you feeling today my dear friend?
I hope you are having a wonderful day.
Retraces and corrections, they can only last so long.
Solana dropped from $188 to $141 and I believe this is enough, a 24% drop (-24%).
As the retrace ends, the chart will produce a higher low and, as the higher low becomes confirmed, SOLUSDT starts a new wave of growth.
$420 is the minimum target for this bullish wave and should hit first but, you should aim higher, much higher. Crypto is showing to be many times stronger than what most people think.
Remember, the mistake we always make is not aiming too high but aiming too low. In each bull market, we tend to underestimate the market. Aim high, because we are going up.
Retraces and corrections are an opportunity to buy-in, 2nd entries, rebuy and reload.
Don't try to SHORT within a bull market, it is dangerous and not worth the risk. It is better to wait for support and go LONG. Always trade with the trend, specially if you are using leverage. Crypto is going up. Solana will now turn green.
Thank you for reading.
Namaste.

Solana Short-Term, Already Bearish After 97% UpWhat will happen in the long-term? Before we get there, let's focus on the short-term real quick because we want to know what is happening with the market now.
The market offers endless opportunities. We need to take advantage of those, our edge. We have an edge and this edge is being able to read the chart. With this edge, we can time the market and increase our trading success.
Solana grew by 97%. This is good. Of course, some pairs grew way more while others grew less. I did mentioned that when Bitcoin grows 50%, some Altcoins can grow 300%. This is exactly what happened, this is because of the size of the projects.
Some pairs grew more but these were smaller pairs. Some pairs grew less but these were bigger. That's just the nature of things.
This 97% bu-wave can be correlated to a 300-400% bullish-wave on other pairs. This means that after a growth wave comes a correction.
SOLUSDT—two main interesting levels. Won't mention them as they are shown on the chart.
Both are likely to hit but the first high is really high probability.
This is easy. Wait for support before buying again. I say "again" because you are supposed to sell at resistance, we are assuming you sold at resistance and are ready to buy at support.
Good? We are good.
The market will continue to move down and up while long-term it produces sustained growth.
We need to adapt fast and be smart, everything can change in a day.
Keep an eye on the news, we might be in front of some major event.
Political events can change everything and cannot be predicted.
Thank you for reading.
Namaste.
Will Solana Go Lower? Yes! Only To Recover HigherI've been asked: Will Solana continue lower?
I think it is a fair question but it is also pretty hard right now to say based on the chart, there are just too many mixed signals.
For example, if we take Solana in relation to Bitcoin, it is trading daily below EMA55 and MA200, while Bitcoin is trading daily above these levels. Bitcoin hit recently a new all-time high while Solana only produced a small recovery in May.
When it comes to the chart signals, SOLUSDT produced a volume breakout on the bearish side and the support zone was completely challenged on a single candle. What's more, Solana will grow really strong later this year, so it would be normal to see as much bearish action as possible now because later we will have sustained long-term growth.
It is a coin flip, but if you ask me, it can go a bit lower before moving up. It can go lower to end up producing a higher low.
I will wait for clear reversal signals before going LONG.
I closed all my LONGs a while back, when it became clear that the market was going into correction. Now we can just wait easily and patiently until the correction unravels, after the correction comes a new wave of growth. Down and up, down and up... The market continues to cycle. Never straight down, never straight up. It moves in waves.
Namaste.
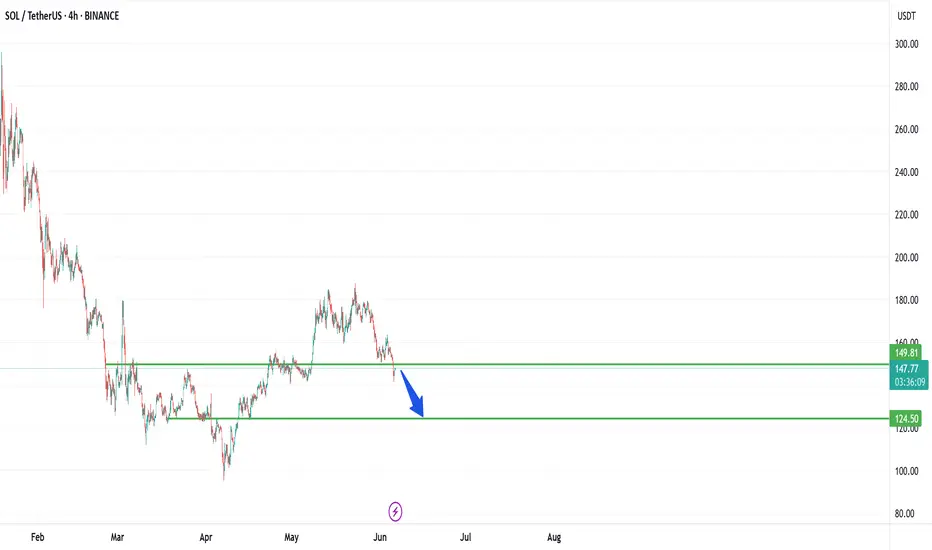
SOL/USDT Technical Breakdown: $125 Support in Sight?Key Observations:
1. Bearish Momentum Intensifying
SOL has been in a steady downtrend since its recent local high near $190, forming lower highs and lower lows on the 4H timeframe.
The current price sits around $147.63, having broken below a minor support level near $149.81.
2. Key Support Level: $124.50
The green horizontal line at $124.50 marks a critical demand zone, which acted as a launchpad during the April rally.
A clear blue arrow on the chart suggests a potential bearish continuation into that zone.
3. Structure and Price Action
The market is forming a descending channel, respecting key horizontal levels.
If the current downward pressure persists, a retest of the $124.50–$125 area looks likely.
Levels to Watch
Immediate Resistance: $149.80 – previous support now flipped
Support Zone: $124.50 – demand-based with prior reaction history
Trend: Bearish in short-to-mid term
Trade Setup Idea (Not Financial Advice)
Entry: $147–$149
Target: $125
Stop Loss: $155 (above minor structure)
Note to Traders
This setup leverages classic support-flip mechanics and momentum-based sell-offs. Watch for confirmation via volume spikes or sharp candle closes. As always, adjust sizing based on your risk tolerance.
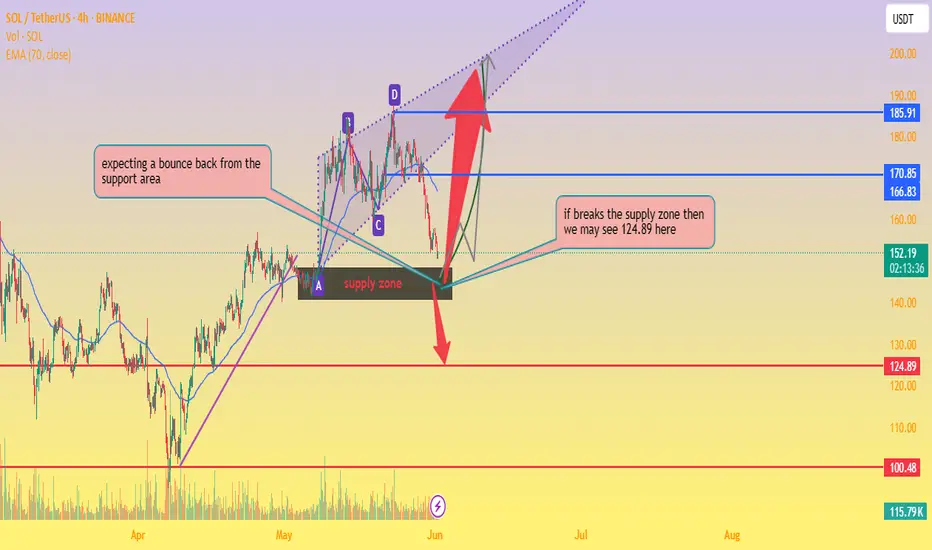
SOL/USDT Key Reversal Zone – Bounce or Breakdown?📊 Chart Analysis:
Current Price: $151.91
EMA 70 (Dynamic Resistance): $166.82
Support Area: Around $150, overlapping with a key supply zone.
Chart Pattern: Harmonic/ABCD structure completing near support.
🧠 Observations:
Price is testing a strong support/supply zone.
📦 If bounce occurs, potential targets:
🎯 First Target: $170.85
🎯 Second Target: $185.91
📉 If support breaks, then:
⚠️ Target: $124.89
📉 Next Major Support: $100.48
🧭 Trade Plan:
🔹 Long Entry (on bullish confirmation):
Entry: $152–$155
SL: Below $149
TP1: $170.85 🎯
TP2: $200 🚀
🔹 Short Entry (on breakdown confirmation):
Entry: Below $148
SL: Above $153
TP: $124.89 🧨
support and drop down your thoughts about it thanks
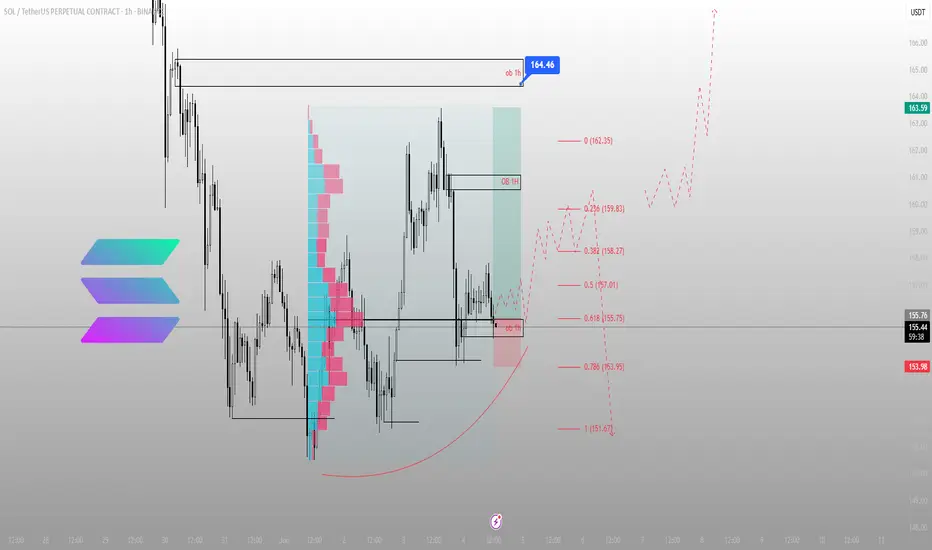
Price respected the level. The rest is execution.BINANCE:SOLUSDT just tapped the 1H OB near 155.75 — a zone defined by structure, not emotion. If you’ve been following the narrative, this isn’t a dip. It’s reaccumulation before displacement.
Here’s the setup:
Price tagged the OB at 155.75, perfectly aligning with the 0.618 fib — the algorithm’s comfort zone
Below this lies 153.95 — the invalidation level for the long idea
First upside target sits at 158.27 → then 159.83 → then a full rotation into 164.46, where we meet a 1H OB stacked with prior inefficiencies
The volume profile shows clear acceptance in this range. If we hold and rotate back above 157.01 with strength, expect continuation. If we sweep below 153.95 and fail to reclaim, the idea flips.
Execution clarity:
Longs from 155.75–155.00, invalidation below 153.95
First reaction target: 158.27
Full structure target: 164.46
Below 151.67 = deeper reprice scenario into weekly inefficiencies
No noise. No hype. Just structure. The chart is clean — the plan is already in motion.
Want more setups like this before they move? Profile description has them.

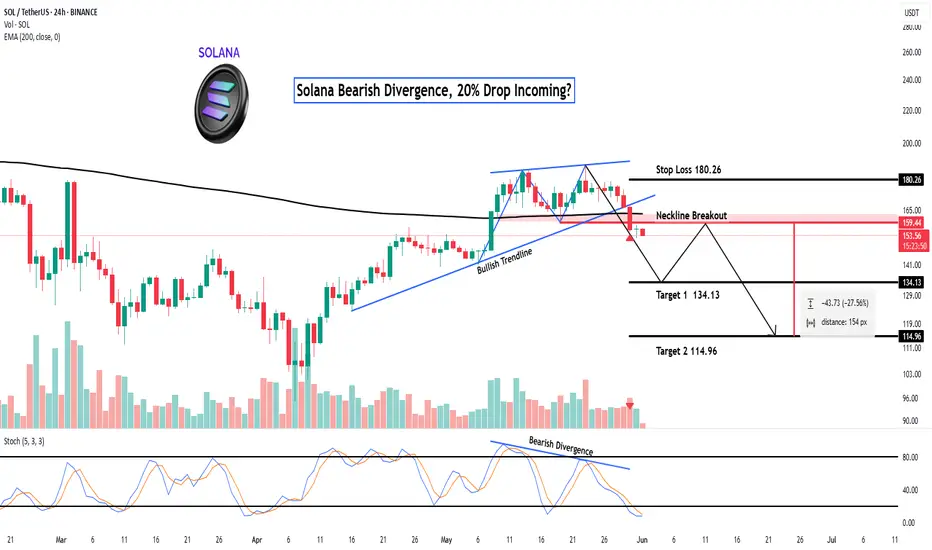
Solana Bearish Divergence, 20% Drop Incoming?Hey Realistic Traders!
Bearish Signal Flashing on BINANCE:SOLUSDT , What Signals Are Showing?
Let’s Break It Down..
On the daily timeframe, Solana has formed a double top pattern, followed by a neckline breakout, which is a classic sign of a potential shift from a bullish to a bearish trend.
This breakout was confirmed by a break of the bullish trendline, accompanied by rising selling volume, which reinforces the bearish momentum. Adding to this, a bearish divergence has appeared on the stochastic oscillator. Bearish divergence occurs when price makes higher highs while the oscillator forms lower highs, signaling weakening buying pressure and increasing the likelihood of a reversal.
Given these technical signals, the price is likely to continue moving lower toward the first target at 134.13, with a possible extension to the second target at 114.96.
This bearish outlook remains valid as long as the price stays below the key stop-loss level at 180.26.
Support the channel by engaging with the content, using the rocket button, and sharing your opinions in the comments below.
Disclaimer: "Please note that this analysis is solely for educational purposes and should not be considered a recommendation to take a long or short position on Solana.
Solana Still Bearish, Moving LowerI will alert you here when the bearish potential is completely nullified. Right now, Solana is still bearish. This applies to all other major projects that I shared recently but I will also update those.
The maker produced a rejection yesterday, 3-June, as a lower high. This implies a bearish continuation. The two levels mapped on the chart are the main support zone.
Since the first level is already being challenged, we can aim for the second one.
Once the correction is over, we will go bullish again.
Some of the smaller altcoins can grow while the rest of the market crashes down. Choose wisely. It will be hard right now.
Namaste.
SolanaSol usdt Daily analysis
Time frame daily
Risk rewards ratio >3.5 👈👌
Target 248$
Green line is a historical up trend for solana

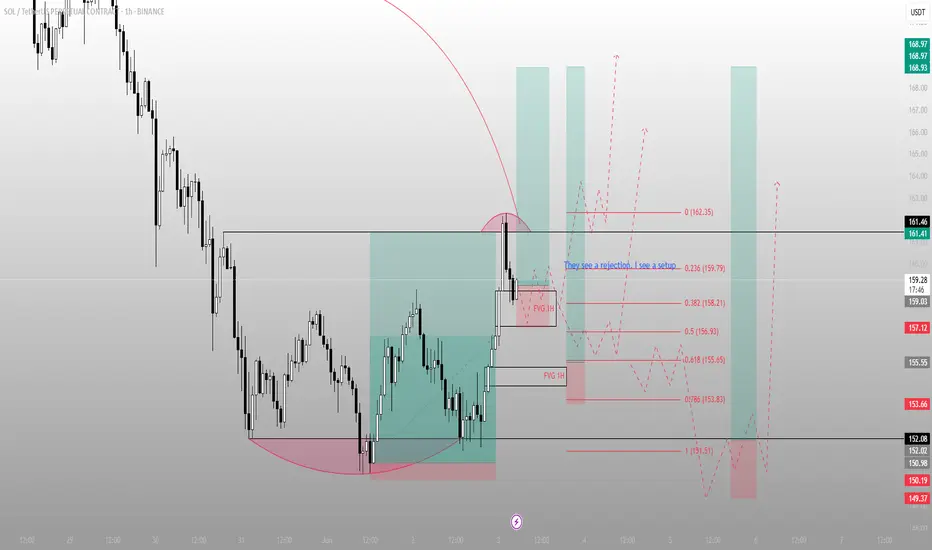
They see a rejection. I see a setupSOL swept the low, ran back to premium, and is now hovering in a reactive FVG.
Most traders see uncertainty here — but this is exactly where structure sharpens.
Here’s what just happened:
Price reversed off a well-defined STB and reclaimed the inefficiency above
It pierced into 162.35 before rejecting — not a failure, but a setup
That move left behind two stacked 1H FVGs
We’re now in the upper one — a re-entry pocket if you understand what this is
This zone between 158.21 and 156.93 is where I expect a reaction. If it holds, structure is preserved and the push toward 161.41 → 168+ resumes.
If it fails, we likely probe 153.83 or deeper into 151.51 — one last shake before the run.
Bias: Long
Trigger: Clean reaction off 1H FVG, higher low formed
Invalidation: Below 151.51
Target: 162.35 first, then 168.93+ on continuation
More setups like this — structured, timed, no fluff — are in the profile description.
No group chat noise. Just levels that matter.
Open long when this happens...My bias for Solana is very bullish. But the current price set up is very similar to April 2022 when the price started to have a major downside move. (See blue vertical line in the chart)
Similarities between April 2022 and today's chart set up in the daily chart:
1) The price moved from the peak (Historical all time high) to trough in the descending parallel channel over four months.
2) The price finally moved out of the the channel and decisively moved up to the major support resistance line (see red horizontal line)
3) Both RSI and MACD have moved way above the overbought territory and the lines are crossed to the downside.
4) EMA21 has crossed above EMA 55, but the EMA200 is still above EMA21 and 55.5) The price has moved and closed above all EMAs but it is pulling back.
I have already finished spot buying at a much lower price point, but I am now looking for a long trading opportunity if the parabolic run is going to happen.
The set-ups for a long trade that I am waiting for are:
1) EMA 22 and EMA 55 are to move above EMA 200.
2) The price to pull back to EMAs and move up and close above EMA 21.
3) RSI and MACD to come back to at least 0 if not below 0 and start to move to the upside.
The set up where the orange vertical line in the chart is a good example of a sort of entry set up described above.

Watch out for Solana today.Hello friends
You can see that in the image we have done a complete and comprehensive analysis of Solana for you and identified points that are good supports and can be bought in the areas.
Given the deep correction we had, the market has fallen into fear and a good opportunity has been provided for buying.
The targets have also been identified.
Please observe capital management and avoid irrational risks.
*Trade safely with us*
SOL is next to set new ATH and here's whyHey guys! Like I said in my last review - SOL went to close GAP from the bottom, gathering liquidity.
❓ GAP is almost closed and time to reflect, what's next?
The liquidity imbalance has gotten bigger. If, as recently as last week, there was 1.5 times more liquidity in shorts. Today liquidity in shorts is almost 4 times more than liquidity in longs.
Which means that most of the speculative positions have already been closed. Of course, the volume of liquidations is not even close to the peak, which indicates that there is still no fresh liquidity on the market and therefore it is difficult for the token to maintain the current momentum.
Besides, summer is coming soon and liquidity will only become less. But for SOL this is a plus rather than a minus and here's why:
⚙️ Metrics and Indictors:
VRVP - we are approaching one of the most active levels, in the 148-136 zone. This zone is where the largest area of trader interest is concentrated. And it is in this zone that I think a lot of people will start looking at SOL from a spot buying perspective.
RSI - is 40. It is not in the oversold zone yet, but the GAP is not closed to the end. That means that the probable continuation of the decline to the psychologically important level of 150-147, may provoke a decline to the oversold level and the beginning of short-term purchases by traders.
DLD - as already mentioned. Liquidity of shorts is now 4 times more than liquidity in longs. And as we know, the price moves from one liquidity to another, which acts as fuel for it.
📌 Conclusion:
Unlike ETH and even BTC - there is no more GAP below in SOL! This means that all further declines will be based on effectively traded zones where there is already organic supply and demand. So we are unlikely to see 20% drops overnight (unless if Trump don't do something weird).
Besides, there is a lot of liquidity in shorts at levels 185 - 201 (local double top of the current momentum).
Short squeezes in historically bearish patterns are not uncommon now. As traditional technical analysis has not been working as it should for a long time due to its proliferation.
So I see the first test of the 146 -141 level as the first possible point for a price reversal, at least to renew the local high.
🔥 Congratulations to everyone on the start of summer and have a good week!

SOLANA It has good growth potential in midtermThe SOL will increase $150 and reach to the top of the wedge in the coming weeks .
Give me some energy !!
✨We spend hours finding potential opportunities and writing useful ideas, we would be happy if you support us.
Best regards CobraVanguard.💚

They saw consolidation. I saw controlled accumulation at OB.SOL just printed what looks like sideways noise — but structure tells a different story.
Price swept the 0.786 fib at 151.44, tapped into a refined 4H OB, and held. That isn’t indecision. That’s deliberate compression — Smart Money accumulating just beneath the surface while the herd waits.
Volume profile confirms it. We’re sitting on a high-volume node, and price hasn’t broken it with conviction. Every wick down is a test — and every recovery is another sign of intent.
If price holds above the 4H OB zone, I expect delivery first into 161.49 — an unmitigated OB that lines up with prior liquidity. From there, 171.62 becomes the macro draw. That’s where imbalance meets memory.
Execution alignment:
🟩 Entry: 151.44–153.00 (OB retest zone)
🎯 TP1: 161.49
🎯 TP2: 171.62
❌ Invalidation: Break below 150.53 with displacement
This isn’t consolidation. This is foundation.
I don’t wait for permission. I wait for price to tip its hand.

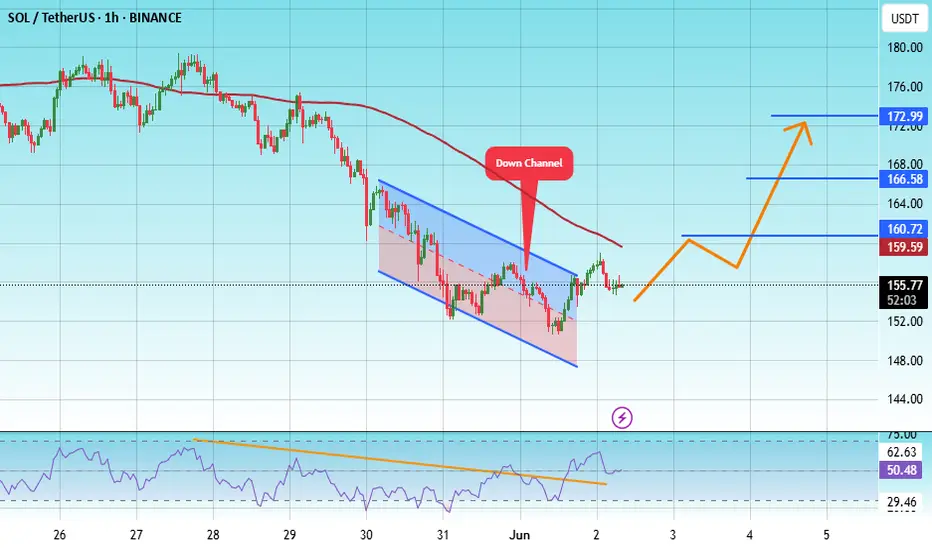
#SOL/USDT#SOL
The price is moving within a descending channel on the 1-hour frame, adhering well to it, and is on its way to breaking it strongly upwards and retesting it.
We are seeing a bounce from the lower boundary of the descending channel, this support is at 150
We have a downtrend on the RSI indicator that is about to break and retest, which supports the upward trend.
We are looking for stability above the moving average of 100.
Entry price: 156
First target: 160
Second target: 167
Third target: 173
SOL - Another run?Look another run means another buy and buy looks dope only if it doesnt breaks the red box for whatsoever reasons!!