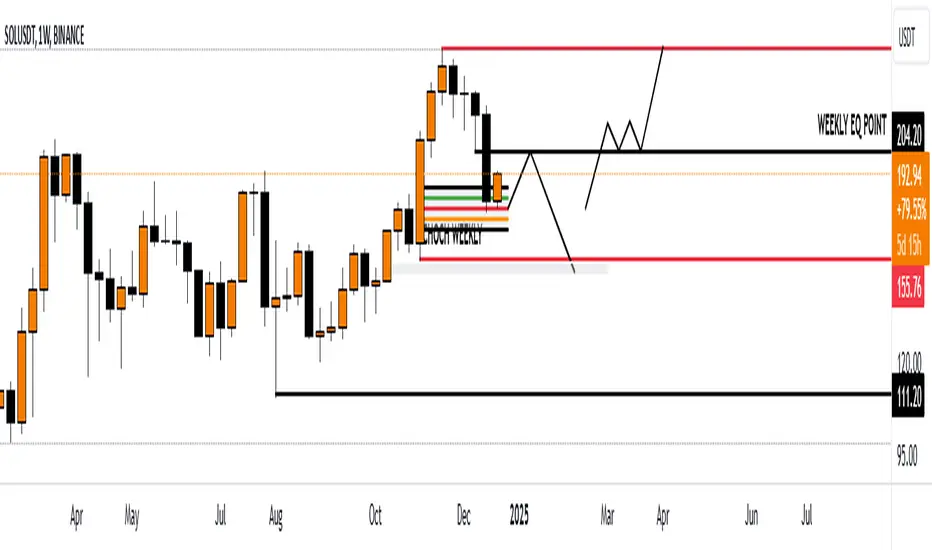
SOLA lot of well known traders are contemplating the idea that SOL MSS has changed. Yes it has changed in the LTF though in the higher time frame, it's still bullish.
A failure to close above the weekly high, trend moved towards the previous lows.
Now there are two possible scenarios.
1. Reclaim the previous low and move towards the previous high
2. Retrace towards the previous lows and sweep the current low and move higher.
I am opting for option 2 but one can trade accordingly
Solusdt
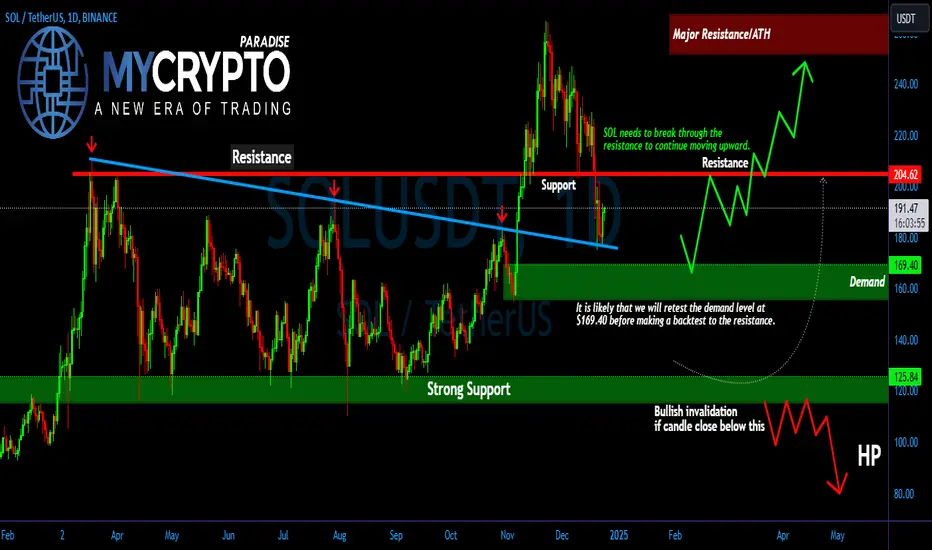
SOL/USDT: Are We Heading for a Breakdown or a Massive Rebound?Yello, Paradisers! Is #SOLUSDT gearing up for a major breakout, or are we staring at a looming collapse? The charts are heating up, and you need to see this analysis to stay ahead.
💎#SOL is currently holding its support trendline, hinting at a potential rebound. If this level holds, we could see SOL pushing upward to test the $204.60 resistance. A breakout above this level would likely trigger a strong continuation toward all-time highs (ATH).
💎If the support trendline gives way, the price is likely to test the $169–$155 demand zone. This area has consistently proven its strength, with previous price action respecting it multiple times. A rebound from here could still offer significant opportunities for the bulls.
💎The real danger arises if SOL fails to hold even at the demand zone. This area aligns with the support trendline, and a breakdown would signal a bearish trend, with the price potentially heading toward the strong support zone around $115.
💎Historically, the $115 level has acted as a major lifeline for SOL. If this level is broken and a daily candle closes below it, bullish momentum would be invalidated, and we could see a deeper plunge. This would be a clear bearish signal, and prices might dip even further.
Stay focused, Paradisers—this market rewards patience and strategy. Let's trade like champions.
MyCryptoParadise
iFeel the success🌴
SOL, is it still trembling?SOL as showed its TPO looks weak. purple line and red line is the mean deviation for if it goes up, else looks weak.

SOLANA Bull Flag (UPDATE)The solana token move-UP has begun , I published a previous idea where I spotted the bull flag earlier, while building up.
Previous idea here below, if you missed it.
A near resistance level has just been broken to confirm that CRYPTOCAP:SOL is ready to push up on a parabolic run, despite bitcoin dumping. I am holding from GP price level. My hopeful target is $300 - $500 .
CRYPTOCAP:SOL is expected to go back to previous high price. More update to follow as we go along
Merry Christmas TRADENATION:SOLANA 🎄🎅
Comment if you agree. Like if you disagree
Solana Sol usdt Daily analysis
Time frame 4hours
Risk rewards ratio =2 👈👌
2 strong resistance ( red boxes you can see in the chart) didn't permit Solana to continue its good growth
Here is a good situation to enter
Close to support lines helps us to have a 200% benefit

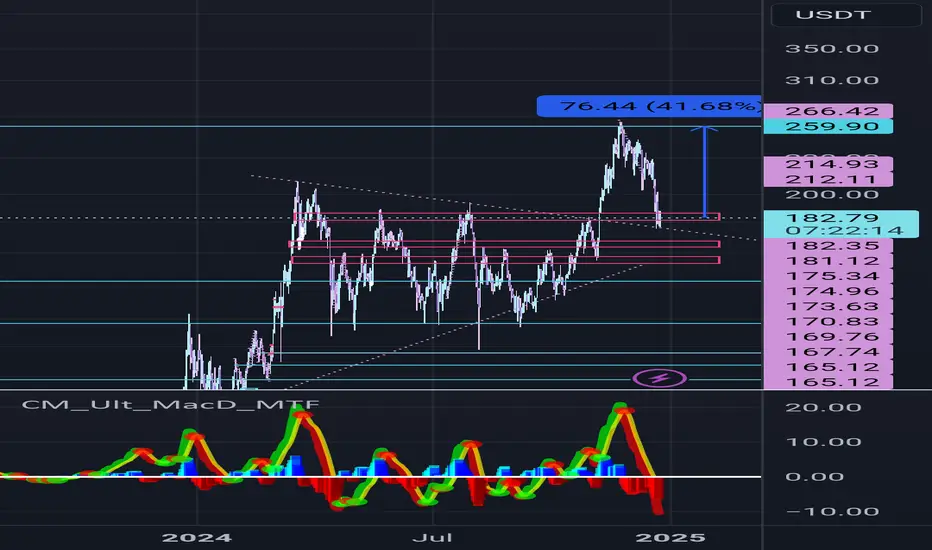
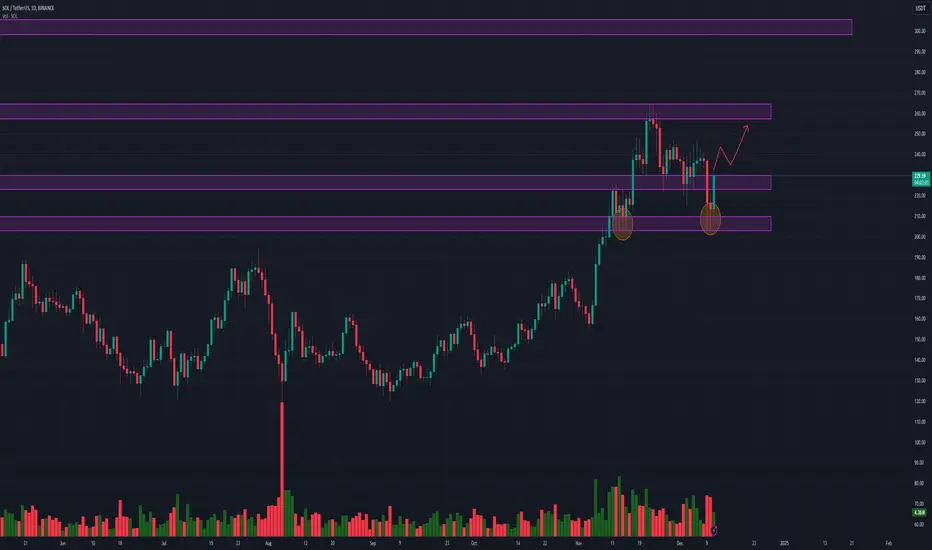
SolanausdtCrypto always gives second chances
259 is the same target as was before
Albeit itll probably break out next time :)
January???
This is the retest opportunity if you missed the initial pump
Retesting monster falling wedge here...
Is now the time to long Solana?Solana (SOL) has been the most oversold top altcoin, but its over 30% pullback could be a great buying opportunity per some pundits.
Since its November peak, SOL has declined from $264 to a low of $175. But the pullback has hit a key confluence area which, if held, could validate Marty’s thesis.
Throughout 2024, SOL’s dumps reversed at the 100-day EMA (Exponential Moving Average, blue). This pattern has repeated in June, July, and October.
As of this writing, the recent pullback stabilized at the moving average ($175). Interestingly, the level also coincided with the golden level (61.8%) of the Fibonacci retracement tool, as measured from September’s lows.
In most cases, price trend reversals happen at the golden ratio level. So, if the pattern repeats, SOL could bottom out at $175 with a potential deviation of $160.
That said, the overall market sentiment was still negative on SOL, which could be ideal for long-term investors eyeing discounted SOL.

The Two Archetypes of TradersIn the trading world, markets move in cycles, and bearish conditions are no exception. Here's an educational breakdown of how traders can navigate these challenging times:
1. The Long-Term Holders (Investors)
Mindset: Patience is their superpower.
Goal: Accumulate assets during bearish trends by buying at key support levels and holding for future gains.
Approach: Use the WiseOwl Indicator to identify areas of strong support and potential accumulation zones for strategic entries.
2. The Intraday Traders (Short-Term)
Mindset: Adaptability and precision are crucial.
Goal: Profit from short-term price movements, capitalizing on market volatility.
Approach: Utilize the WiseOwl Indicator to pinpoint bearish momentum for short entries and clear exit levels, ensuring optimal risk management.
Educational Example: WiseOwl Strategy in Action
Let’s analyze Solana (SOL) on the 15-minute timeframe during a bearish market:
Trend Identification: The WiseOwl Indicator highlights a confirmed downtrend with clear bearish signals.
Entry Points: Short trade signals are generated at moments of significant bearish momentum.
Risk Management: Stop loss and take profit levels, calculated using ATR-based logic, ensure disciplined trading.
Takeaways for Traders
📉 Bearish Markets:
Holders focus on identifying value areas for accumulation.
Intraday traders capitalize on market volatility with precise entries and exits.
Happy trading! 🚀
#WiseOwlIndicator #TradingEducation #BearMarket #SOLAnalysis #CryptoTrading

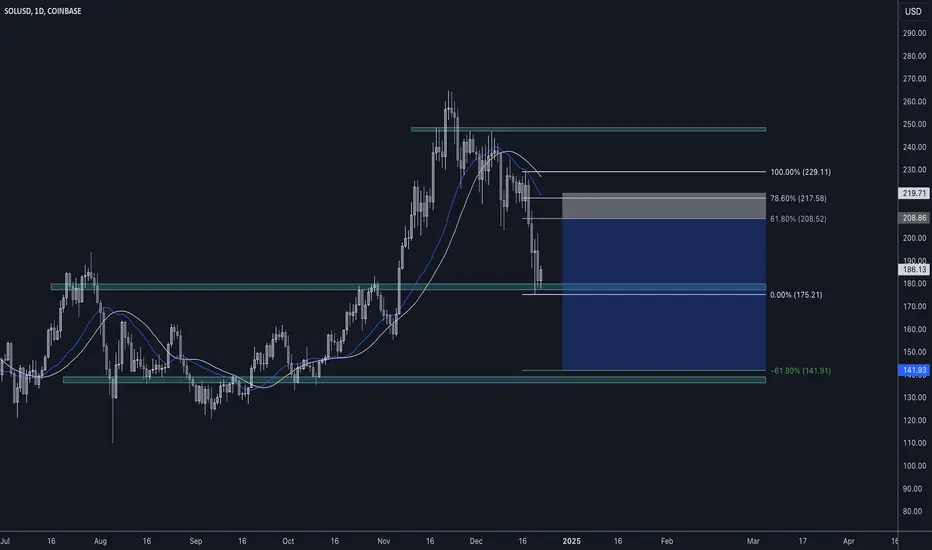
SOLANA TO $140Solana could potentially see a big dip in price if BTC continues in short downward trend.
As we all know SOL is correlated directly to the movements of BTC, in fact they are exaggerated on the SOL market, a 2% price movement on BTC could see 7-10% on SOL. If BTC continues downwards then Solana can jump from $180 to $140, there is also TA to support this.
As you can see from the TA the SMA's have crossed over on the daily time frame but we are yet to have a pull back and retest, when this does happen it would likely be to the $210 price range, this would line up with the 61.8% retracement as well as the next major resistance level.
This is when i would look to enter if we get a clear rejection from the SMA's, the resistance level and the 61.8% fib level. If SOL rejects this price then i believe the target for this short would be the $140 price area, this is the price that the fib gives us as well as the next major support level being located around this price.
Of course it'll have a lot to do with BTC's movements over the next few days / weeks so we'll watch BTC closely to see how it influences this potential trade.
SOLANA Bull Flag Building
Golden Pocket retrace and bounce was on point 🎯
Proper correction completed IMO. Now it's gearing up for move up 🚀. Load 'em up, we are expecting CRYPTOCAP:SOL at $400 - $600 price level .
Correct me if I'm wrong. Like if you disagree. Comment if you agree. 👍

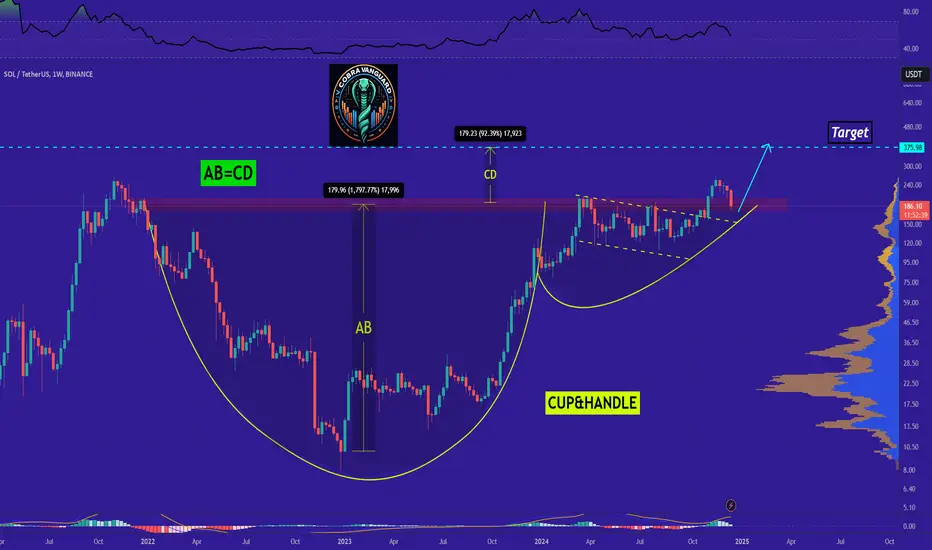
The last bullish chance of SOLANA !!The price has broken the cup and handle pattern and has also completed its pullback. Now is the time for the price to rise.
Give me some energy !!
✨We spend hours finding potential opportunities and writing useful ideas, we would be happy if you support us.
Best regards CobraVanguard.💚
_ _ _ _ __ _ _ _ _ _ _ _ _ _ _ _ _ _ _ _ _ _ _ _ _ _ _ _ _ _ _ _
✅Thank you, and for more ideas, hit ❤️Like❤️ and 🌟Follow🌟!
⚠️Things can change...
The markets are always changing and even with all these signals, the market changes tend to be strong and fast!!
SOLANA's PATH to $156 !I maybe wrong but not so wrong enough to understand buys here would get me off hold and short me to death so better i follow it here and buy from 157 to 156.
ideally purple line deflection would be major catastrophe, means if it goes up!

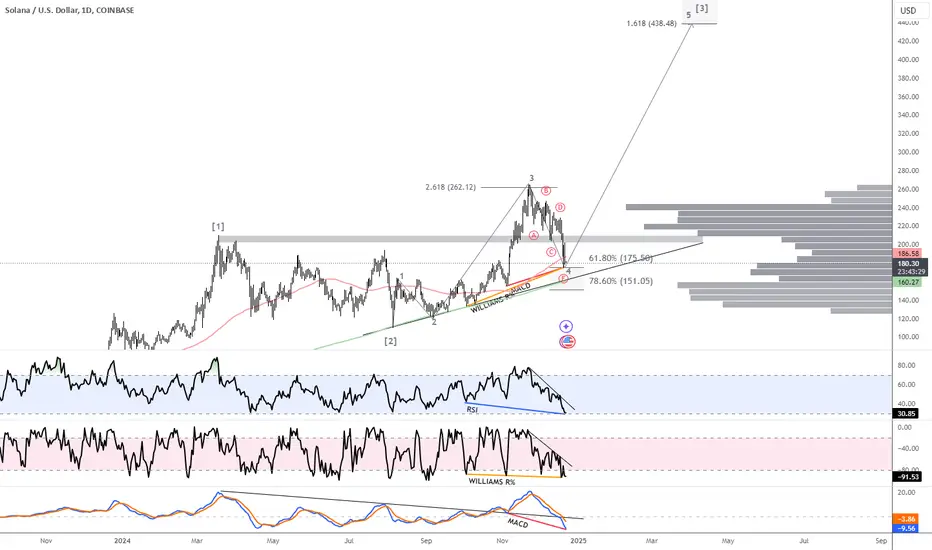
$SOLUSD BuyCOINBASE:SOLUSD
Technical Analysis
This chart suggests the price is in a corrective phase, with confluence around key Fibonacci levels. Divergences in RSI, Williams %R, and MACD support this corrective structure, while the Elliott Wave count indicates the potential for a strong rally in the next impulsive wave.
Fundamental Analysis
1. Anticipation of Solana Spot ETFs:
Following the successful launch of Bitcoin spot ETFs, there is growing speculation about the introduction of Solana-based ETFs. Such financial products would make SOL more accessible to traditional investors, potentially increasing demand and positively impacting its price.
2. Positive Technical Indicators:
Analysts have observed bullish technical patterns in Solana's price charts, suggesting the potential for significant growth. For instance, the formation of a 'cup and handle' pattern indicates a possible upward breakout, with some projections estimating substantial price increases if this pattern holds.
3. Evolving Regulatory Environment:
The recent approval of Bitcoin spot ETFs and a shift towards a more crypto-friendly regulatory stance in the U.S. have increased optimism for the approval of Solana-based ETFs. This regulatory shift could enhance Solana's legitimacy and attract a broader investor base.
These developments contribute to a positive outlook for Solana, indicating potential for continued growth in the near future.
SOLUSDT - UniverseMetta - Analysis#SOLUSDT - UniverseMetta - Analysis
After reaching its ATH, the price has formed a descending channel and corrected by more than 50% from the previous impulse. Has the correction ended? Currently, the price is testing a support level, which might lead to a bounce back into the channel. Monitoring potential entry points for long positions is essential. If the decline continues, the next targets are $171.60 and $152.01.
Target levels: $171.60 - $124.99

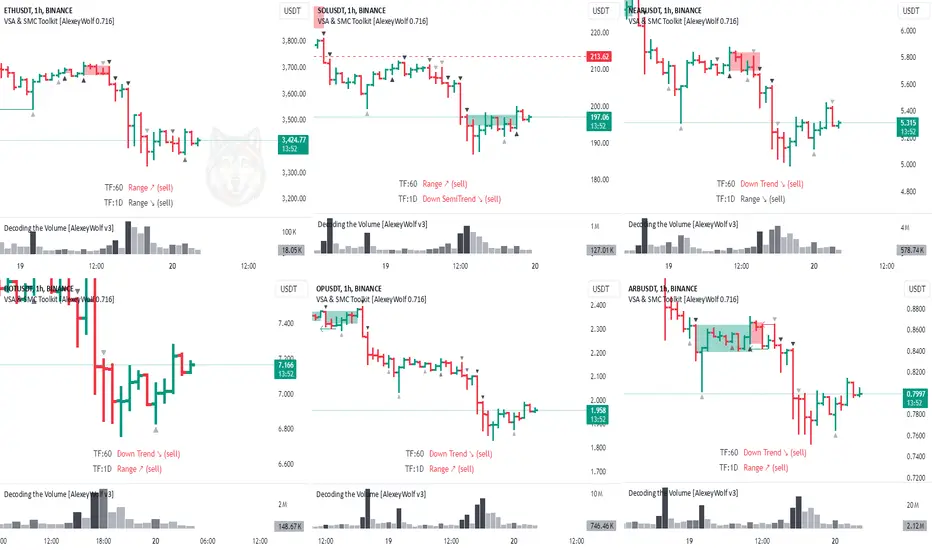
The correction in crypto assetsHey traders and investors!
The correction in crypto assets continues.
You can look for selling opportunities (for example, in futures) on these assets, as both the daily and hourly timeframes favor the sellers.
Stop-losses are a must!
If buyers on these assets (OPUSDT, ARBUSDT, DOTUSDT) buy up the daily bar from December 19, the priority will shift to purchases.
I wish you profitable trades.
Are Solana lovers here?BINANCE:SOLUSDT Did you get high from how Solana held the most powerful historical level?
But we need to stand a little longer to go into space.At the moment, the chart is very favorable.Who can we thank for this positive development in the market?⚡️
Very strong purchases at the 200 level.I think 300 won't take long to wait.🚀🚀🚀
One small correction and people's market goals change dramatically. They forget about the action plan and how this market works in general.
Don't let your emotions control you. It's not going to do any good. Both in this market and in life.
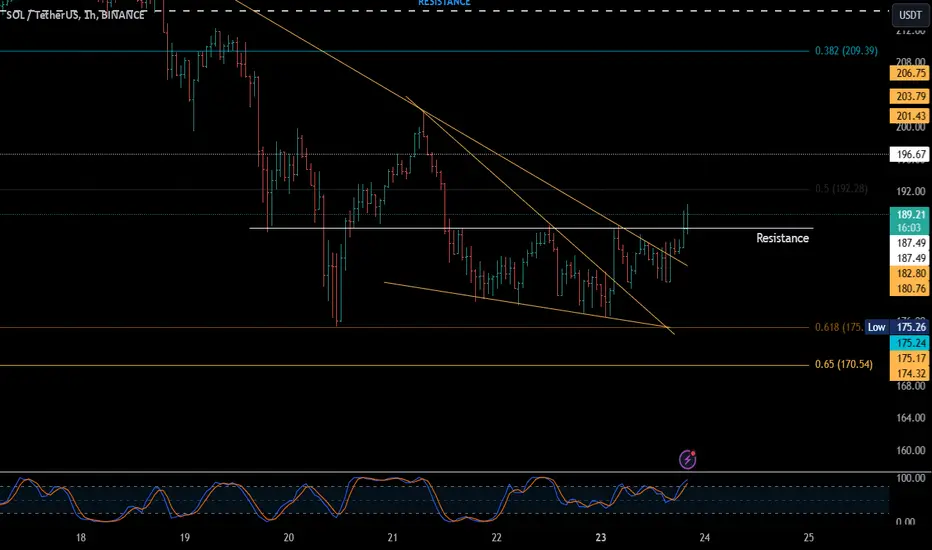
#SOL/USDT Ready to go higher#SOL
The price is moving in a descending channel on the 1-hour frame and sticking to it well
We have a bounce from the lower limit of the descending channel, this support is at 205.00
We have a downtrend on the RSI indicator that is about to break, which supports the rise
We have a trend to stabilize above the moving average 100
Entry price 209.68
First target 215.40
Second target 221.87
Third target 231

SOL | ALTCOINS | Does Solana Have One More Push?Solana has barely just made a new ATH, and it's likely at the end of the correction after trading red for 3 weeks consecutively.
It's likely that once ETH has made a new ATH, Solana will be soon to follow. More on that topic here:
___________________
BINANCE:SOLUSDT

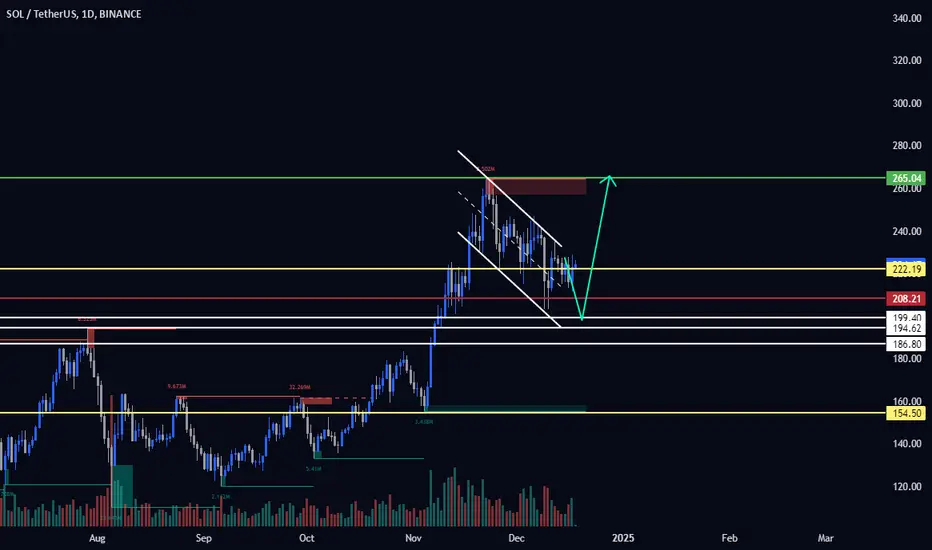
SOL 1D. Solana Ready for New Highs. 12/18/24Currently, the price has formed a "descending parallel channel" and is moving within its boundaries.
I expect Solana’s price to revisit the $200 level, which serves as a key support zone. After this return, I anticipate continued growth and a move toward a new all-time high.
Trade Plan:
EP (Entry Point): $202 - $196
TP (Take Profit): $240 - $260
SL (Stop Loss): $184 - $182
Personal Approach:
I plan to buy Solana on spot in the $186 - $156 range since I’m targeting $300 - $400 levels in the mid-term (expecting another correction as well). If my futures position hits stop-loss, I won’t be upset at all because my spot position will cover any losses — I’m confident in this!
What you should do is entirely up to you.
DYOR.
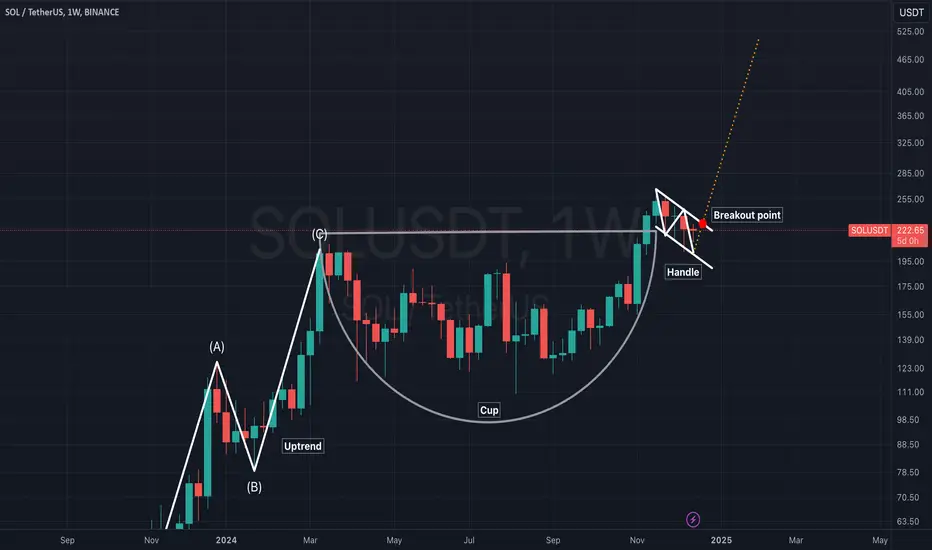
SOL/USDT Weekly Chart: Cup & Handle Pattern Signal 115% Breakout(I'm not a financial advisor)
The chart reveals a classic Cup and Handle formation on the weekly timeframe, signaling a continuation of the bullish trend. The cup represents a period of accumulation and consolidation, while the handle indicates a minor pullback before a potential breakout.
Key Levels:
Breakout Point: ~$235
Current price: $222.73
Target Projection: ~$500 (based on the measured move from the bottom of the cup to the breakout point, mirrored upwards).
Bullish Outlook:
A confirmed breakout above the handle resistance could trigger a strong move upward, fueled by the continuation of the prior uptrend. The measured move aligns with a target near $500, reflecting a potential 2x increase from the breakout point.
Why This Setup is Significant:
Cup and Handle patterns are reliable continuation patterns in technical analysis.
The handle's tight consolidation shows reduced selling pressure, increasing the probability of a breakout.
Volume confirmation upon breakout would strengthen this bullish forecast.
Watch for:
A weekly close above the breakout point (~$235) with increased volume.
Potential pullbacks to retest the breakout zone as support.
SOL pending breakoutBINANCE:SOLUSDT.P the bull flag seems to be holding quite well,
I'm getting in ahead of the breakout. If it fails, I'll catch the second.

SOL / USDT : Approaching trendline resistance SOL/USDT: Approaching Trendline Resistance with Strong Breakout Potential
SOL/USDT is gaining momentum 📈 as it nears a crucial trendline resistance zone 📊. The pair has been consolidating tightly, building up energy for a potential breakout 💥. This could be the breakout we've been waiting for, signaling the start of a strong bullish trend 🚀. Stay alert and watch for confirmation signals before making a move.
Key insights:
1. Trendline resistance: SOL/USDT is testing a significant trendline that has acted as a barrier in the past. A breakout above this level could unlock substantial upside potential.
2. Volume surge: A noticeable increase in trading volume during the breakout will confirm strong buyer interest 🔥.
3. Bullish signals: Momentum indicators such as RSI and MACD are turning positive ⚡, indicating growing bullish strength.
Steps to confirm the breakout:
Look for a decisive 4H or daily candle closing above the trendline 📍.
Watch for a volume spike during the breakout, signaling robust buying activity 📊.
A retest of the broken resistance as a new support level will add confidence to the move ✅.
Be cautious of fake breakouts, such as sharp reversals or wicks above the trendline ⚠️.
Risk management strategies:
Set stop-loss orders to protect against unexpected reversals 🔒.
Ensure your position sizing aligns with your overall trading plan 🎯.
This analysis is for educational purposes only and is not financial advice. Always conduct your own research (DYOR) 🔍 before making investment decisions.

SOL is Bullish as Feverything is clear that we will see ATH soon.
As you can see, we are in the top of bear channel. If just one candle closes above black line, you will see how Solana fly to the moon.
