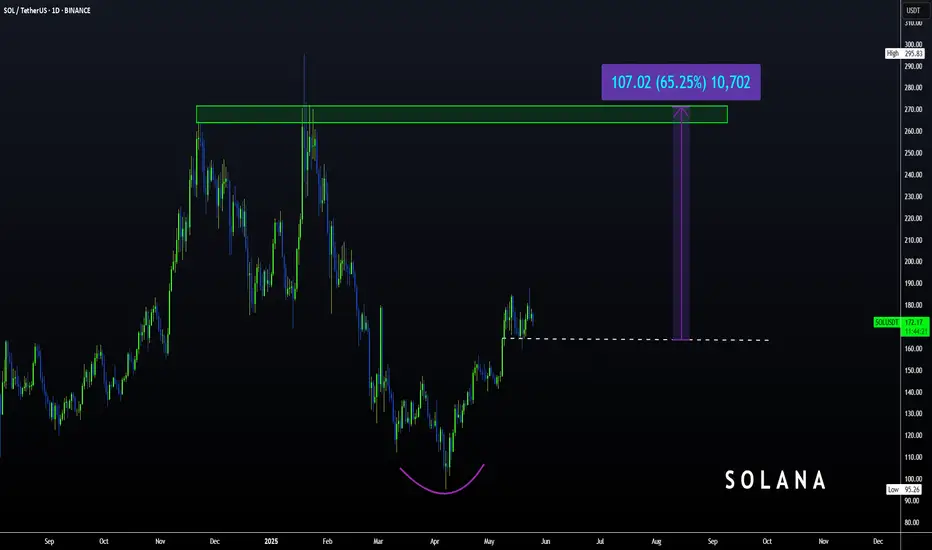
SOL Local Elliot Wave ii UnderwaySolana appears to have completed a motif wave 1 after finding a bottom at the major support high volume node (HVN) macro wave 4.
Wave 2 has not retraced as deep as other alt coins showing strength in the move up. The downside target is the HVN at $140 at the 0.5 Fibonacci Retracement.
Wave 3 should be a powerful move up taking price into all time high.
Failure to hold this support could see price heading back to fresh lows and testing the $90 HVN once more.
Safe trading
Solusdt

SOL - Is it good for buys?SOL really looks good at the multiple points mentioned, Looks good for longs at the point marked!!

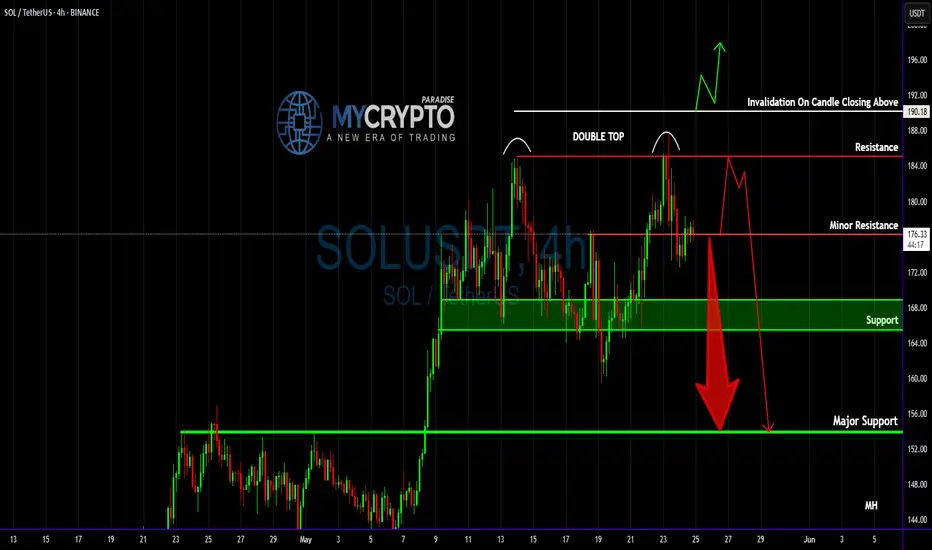
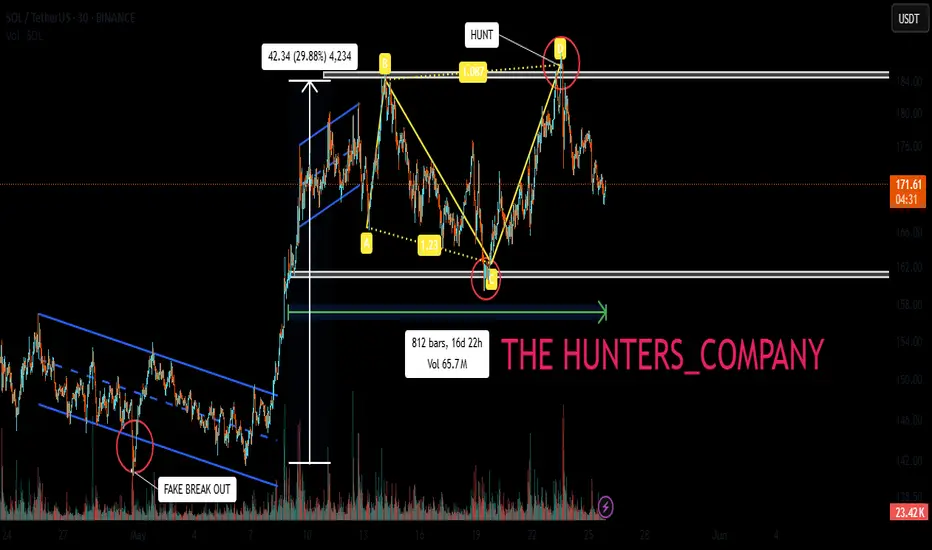
Double Top Alert: SOLUSDT Setup Screams ReversalYello Paradisers, will you act like a pro and prepare for the next clean short opportunity on #SOLUSDT, or will you fall for the same breakout trap again just before the market punishes greed?
💎#SOLUSDT is displaying a textbook double top formation just under a well-respected resistance zone. This kind of structure is no joke—it’s a consistent precursor to sharp downside when liquidity gets taken from retail longs who are too eager to buy high. The market rarely gives second chances. What you’re looking at now is one of them.
💎Price has printed a double top around the $185 to $188 region. That zone has repeatedly acted as a ceiling, and buyers have failed to maintain any strength above it. The lack of follow-through is a major sign of exhaustion, especially after the second tap failed to even test the previous high with conviction.
💎Instead of breaking out, SOLUSDT has rolled over and is now struggling under the $176.23 minor resistance. That weakness is already being confirmed on lower timeframes. As long as this area holds as resistance, there is no justification for any probable aggressive long setups. This is a market preparing to punish overleveraged traders.
💎There’s a clear invalidation for this setup, and it’s extremely important to stick to it. Any 4H candle closing above $190.18 would break this structure and force us to step back and reassess the setup. Until that happens, the current bearish thesis remains firmly in play.
💎The nearest support sits at $168.86 which has highest probability that price may visit there. This level may act as a brief pause, but if the selling intensifies, it will likely break. A confirmed move below that level opens the door toward the true target of this breakdown, which is the $153.95 major support zone. That’s where we’ll be watching for a real reaction.
💎The current structure is heavily skewed toward the downside. Bears are clearly in control below $176.23, and the market has shown no signs of reclaiming key levels that would shift that control back to the bulls. Any bounce should be treated as corrective unless proven otherwise by a structural shift.
Strive for consistency, not quick profits, Paradisers. Treat the market as a businessman, not as a gambler. If you master that mindset, you’ll already be far ahead of the crowd.
MyCryptoParadise
iFeel the success🌴
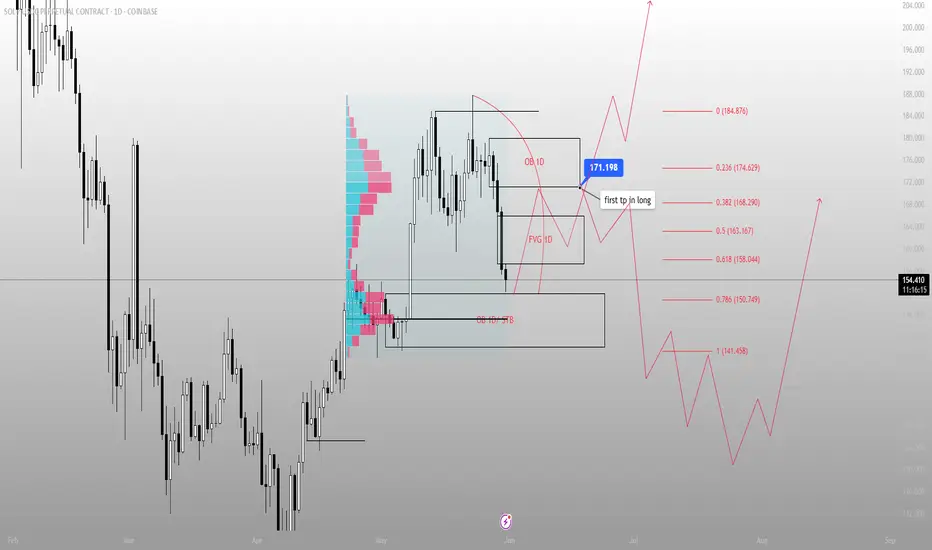
Price tapped the origin. Now we wait for the rest to catch up.Most of the market is reacting. I’m just tracking delivery.
SOLUSDC just printed a clean raid into the 1D OB — perfectly aligned with a HVN on the volume profile. It’s not a coincidence. It’s Smart Money reloading before the next distribution cycle.
The sell-side sweep into 150.7 tagged the 0.786 retracement and the top edge of a stacked STB/OB zone. That’s where I’m already building long exposure.
Price isn’t reversing because of “support.”
It’s reversing because the inefficiency from the rally has now been filled — the FVG is complete, and the reaction confirms it.
From here, my first draw is 171.198 — the EQ of a 1D OB and a known liquidity pool. If we displace through that with conviction, I expect full expansion toward the 184.8 high.
Execution logic:
🔑 Entry: 150.7–154 zone (1D OB + STB zone + 0.786 retrace)
🎯 First TP: 171.198
🛑 Invalidation: 141.4 break and close below (full POI invalidation)
🧠 Patience if we revisit 141 — that level may serve as the final sweep before a macro move higher
I don’t trade headlines. I trade imbalance and narrative.
Precision or nothing. This is why my trades don’t miss.
SOL/USDT"Solana, like the other two coins, is also poised for growth and is currently in the best possible position. What do you think, my friend? Do you think Solana can go up?
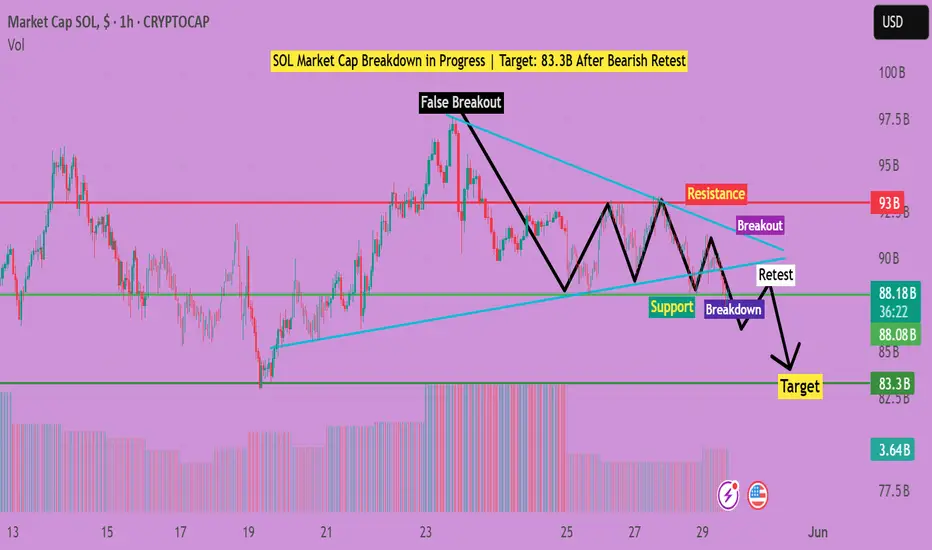
"SOL Market Cap Breakdown Setup| Bearish Retest Targeting 83.3B"SOL Market Cap is showing signs of a potential breakdown after a series of lower highs and a bearish retest of previous support. Price is currently retesting the breakdown level. If confirmed, the next support zone is near 83.3B.
This is a technical analysis-based observation, not financial advice. Always manage risk and confirm with your own strategy before making any decisions.
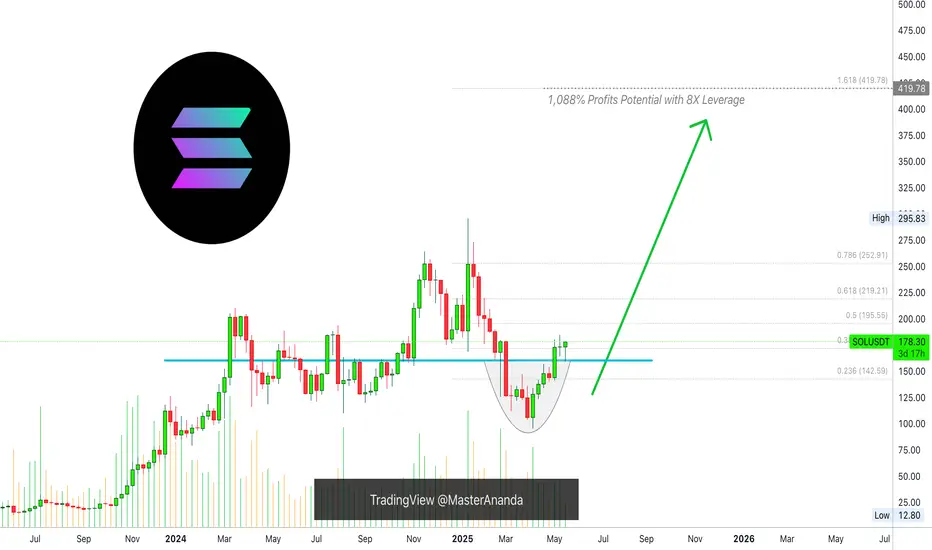
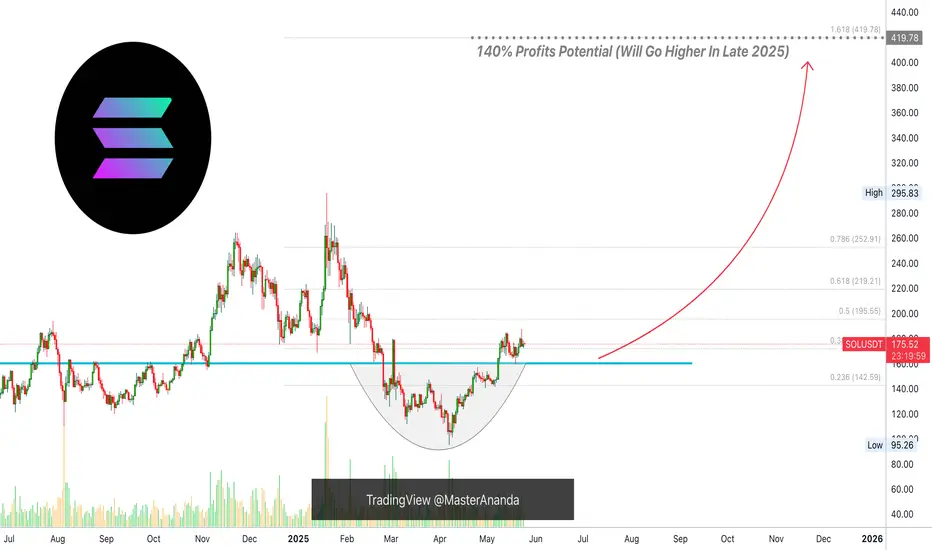
Solana 8X Lev. Full PREMIUM Trade-Numbers (PP: 1088%)Good morning my fellow Cryptocurrency trader, I wanted to give you one more high profits potential, high probability, high certainty, great entry and timing, leveraged-trade.
The Altcoins market is about to go wild and this chart setup can be a life changer if approached with the right planning and mindset, if approached in the right away.
» SOLANA —SOLUSDT
I'll let you take care of the rest.
Full trade-numbers below:
____
LONG SOLUSDT
Leverage: 8X
Entry levels:
1) $182
2) $175
3) $165
Targets:
1) $195
2) $220
3) $253
4) $296
5) $343
6) $372
7) $420
Stop-loss:
Close weekly below $160
Potential profits: 1088%
Capital allocation: 5%
____
Thank you for reading.
If you enjoy the charts, numbers and content, consider a follow.
Namaste.
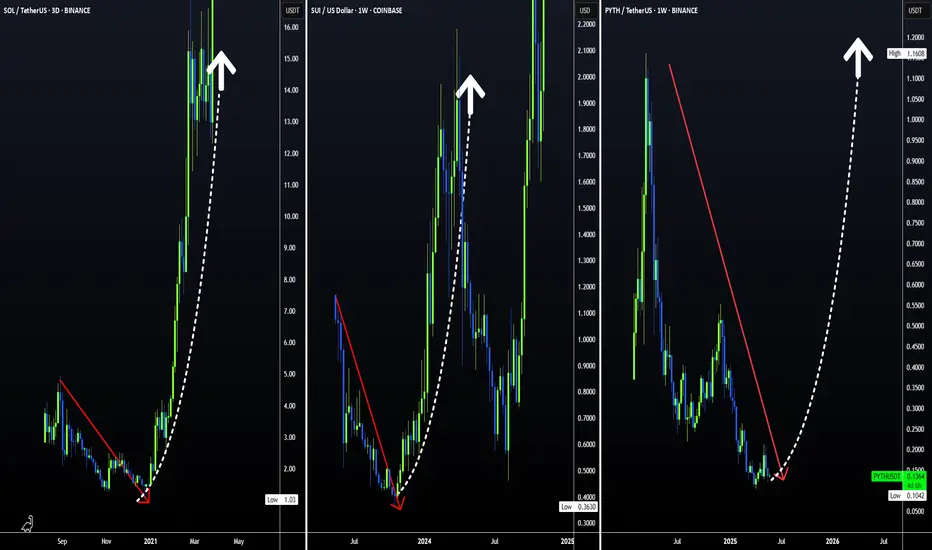
HUGE INCREASES Possible on PYT | Here's WhyPython is a fairly new altcoin with big upside.
From the earlier two charts on the left, we see that initial downturns shouldn't be feared. Historically, SOL and SUI started with downtrends and transitioned into massive upside alts.
Python might especially see parabolic increases, once ETH starts to move towards a new ATH. This will be due to the rotation of liquidity between altcoins in terms of larger and smaller market caps.
Don't miss yesterdays update on ETH!
____________________________
BINANCE:SOLUSDT
COINBASE:SUIUSD
BINANCE:PYTHUSDT
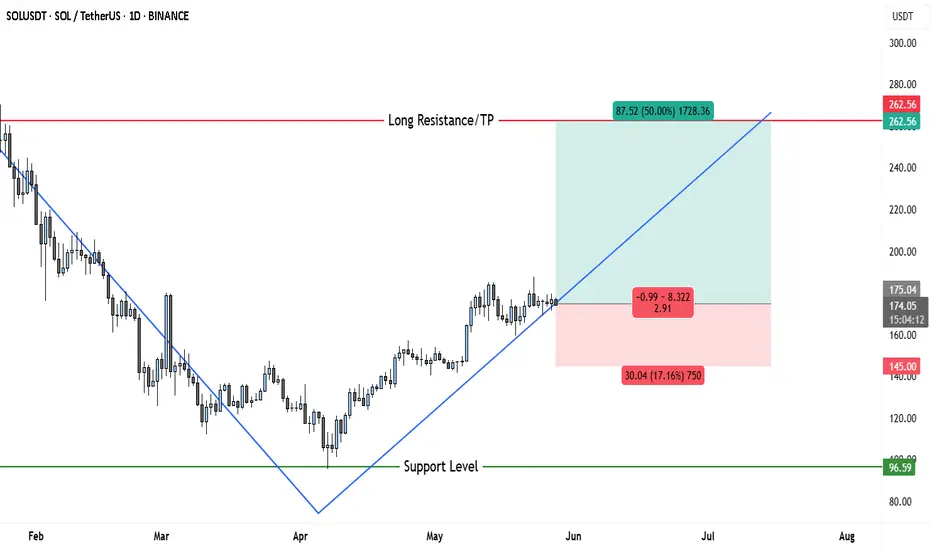
$145 Stop, $262 Target — SOL Bullish Breakout Looks UnstoppableThe chart presents a clean bullish reversal from the previous downtrend observed between February and early April. After breaking the long-term descending trendline, Solana (SOL) flipped structure and has been printing higher highs and higher lows, signaling a transition into an uptrend.
This is reinforced by the ascending blue trendline that currently acts as a dynamic support. Each price correction respects this trendline, showing that buyers are defending higher levels.
✅ Key Technical Justifications for Bullish Bias
1. Break of Downtrend
The long-term descending trendline from the February highs was broken decisively.
This signifies a trend reversal, which has since seen SOL push into a new bullish channel.
2. Strong Higher Lows
Price has been consistently making higher lows, respecting the blue uptrend line.
This price behavior confirms increasing bullish momentum.
3. Support Level Holding
The horizontal support around $96.59 was respected during the reversal.
This base forms the foundation of the bullish wave we’re seeing now.
4. Bullish Price Compression
After a strong impulsive rally, SOL has entered a consolidation just above the trendline.
This resembles a bullish flag or pennant, typically a continuation pattern.
5. No Major Resistance Until $260+
The nearest strong resistance sits around $262.56, which aligns with a previous breakdown zone and coincides with your take-profit (TP) zone.
With no serious resistance in the $200–$250 range, price can climb smoothly once bullish continuation triggers.
📊 Trade Setup (Long Position)
• Entry: Around $174.30 (current market zone as per chart)
• Stop Loss (SL): $145.00 (Below recent swing low and dynamic support — gives the trade breathing room)
• Take Profit (TP): $262.56 (Aligned with horizontal resistance and measured move target)
Risk-to-Reward Ratio: 2.91
Potential Reward: +50%
Potential Risk: -17%
This trade setup is not only favorable from a risk/reward standpoint but also follows price structure, trend, and technical confirmation.
🧠 Final Thoughts
Solana (SOL) on the daily chart has shifted into a clearly bullish phase after a textbook breakout from its multi-month downtrend. The current setup shows a healthy trend structure, room for price expansion, and favorable technicals across the board. The next key breakout will likely occur above $180, and that can send SOL quickly into the $240–$260 range. If you're looking to ride a swing position into Q2-Q3, this is one of the cleaner long setups currently on major altcoins.
Not clear path to SOLBTC but sqeeze higher more probableIt needs to break above 18000 for this to fulfill. Current QE scenario will help

BITCOIN SIGNALS (DON'T MISS)Hello friends
Given the good price growth we had, you can see that the price has entered a correction and has provided us with a good opportunity to buy in steps in the specified support areas (of course with capital management)
The targets have also been specified...
*Trade safely with us*

SOL Crypto Futures Trade Plan 2025-05-26SOL Crypto Analysis Summary (2025-05-26)
Model Summaries
Grok/xAI Report
Technical: Price $176.77 above 20/50-day MAs but below 200-day SMA. RSI 60.6 (neutral-bullish). MACD shows slight bearish divergence. Bollinger bands suggest price near upper band. Sentiment: Limited positive news impact from luxury watch integration. Neutral funding rate. View: Moderately Bullish (75% confidence). Trade: Long at $177.50, SL $171.00, TP $183.00, 50× leverage, 1% equity position.
Claude/Anthropic Report
Technical: Similar MA and RSI readings; below 200-day SMA. Bollinger bands point to moderate volatility. Sentiment: Balanced funding rate; positive branding news but limited price impact. View: Moderately Bullish. Confidence 72%, below threshold—no trade recommended.
Llama/Meta Report
Technical & Sentiment: Aligns with Grok on MAs, RSI, Bollinger. Neutral overall market backdrop. View: Moderately Bullish (80% confidence). Trade: Long at $176.77, SL $171.74, TP $186.48, 75× leverage, 0.5% equity.
Gemini/Google Report
Technical: Bullish on short-term MAs and RSI but MACD bearish crossover and resistance at 200-day SMA. Sentiment: Neutral funding, niche positive news. View: Moderately Bearish short term (75% confidence). Trade: Short at $176.77, SL $179.50, TP $169.00, high leverage, size 1.
DeepSeek Report
Technical & Sentiment: Highlights 200-day SMA resistance and MACD divergence after 18.5% monthly rally. View: Bearish (75% confidence). Trade: Short at $176.77, SL $181.00, TP $171.74, size 1. Areas of Agreement and Disagreement
Agreement
Price is above the 20/50-day moving averages. RSI (~60) indicates healthy, not overbought conditions. Key resistance near the 200-day SMA (~$181) and upper Bollinger Band (~$186.5). Funding rates are neutral; no extreme positioning. Luxury watch news is a mild positive but not a strong market mover.
Disagreement
Directional bias: Three models lean moderately bullish (Grok, Claude, Llama), two bearish (Gemini, DeepSeek). Trade triggers: Bullish models target breakouts above current price; bearish models emphasize MACD crossover and 200-day SMA rejection. Position sizing and risk thresholds vary widely (1% equity vs. 0.5% vs. full contract). Conclusion
Overall Market Direction Consensus: Moderately Bullish Recommended Trade: Long SOL futures
Entry Range: 177.50 (to confirm continued upside momentum) Stop Loss: 171.00 (just below 20-day SMA) Take Profit: 183.00 (near upper Bollinger Band resistance) Position Size: 1 contract (≈1% of equity at 50× leverage) Confidence Level: 73% Key Risks and Considerations: MACD bearish divergence could trigger a short-term pullback. Strong resistance at the 200-day SMA (~$181) and upper Bollinger band. Correlation with BTC/ETH and broader crypto market swings. Volatility spikes can induce slippage—strict risk management required. TRADE_DETAILS (JSON Format)
{ "instrument": "SOL", "direction": "long", "entry_price": 177.50, "stop_loss": 171.00, "take_profit": 183.00, "size": 1, "confidence": 0.73, "entry_timing": "market_open" }
📊 TRADE DETAILS 📊 🎯 Instrument: SOL 📈 Direction: LONG 💰 Entry Price: 177.5 🛑 Stop Loss: 171.0 🎯 Take Profit: 183.0 📊 Size: 1 💪 Confidence: 73% ⏰ Entry Timing: market_open
Disclaimer: This newsletter is not trading or investment advice but for general informational purposes only. This newsletter represents my personal opinions based on proprietary research which I am sharing publicly as my personal blog. Futures, stocks, and options trading of any kind involves a lot of risk. No guarantee of any profit whatsoever is made. In fact, you may lose everything you have. So be very careful. I guarantee no profit whatsoever, You assume the entire cost and risk of any trading or investing activities you choose to undertake. You are solely responsible for making your own investment decisions. Owners/authors of this newsletter, its representatives, its principals, its moderators, and its members, are NOT registered as securities broker-dealers or investment advisors either with the U.S. Securities and Exchange Commission, CFTC, or with any other securities/regulatory authority. Consult with a registered investment advisor, broker-dealer, and/or financial advisor. By reading and using this newsletter or any of my publications, you are agreeing to these terms. Any screenshots used here are courtesy of TradingView. I am just an end user with no affiliations with them. Information and quotes shared in this blog can be 100% wrong. Markets are risky and can go to 0 at any time. Furthermore, you will not share or copy any content in this blog as it is the authors' IP. By reading this blog, you accept these terms of conditions and acknowledge I am sharing this blog as my personal trading journal, nothing more.

Solana(based on NEowave)I consider this as a triangle but under the price zone which is 139 it tells us its going to make a diamond diametrical.

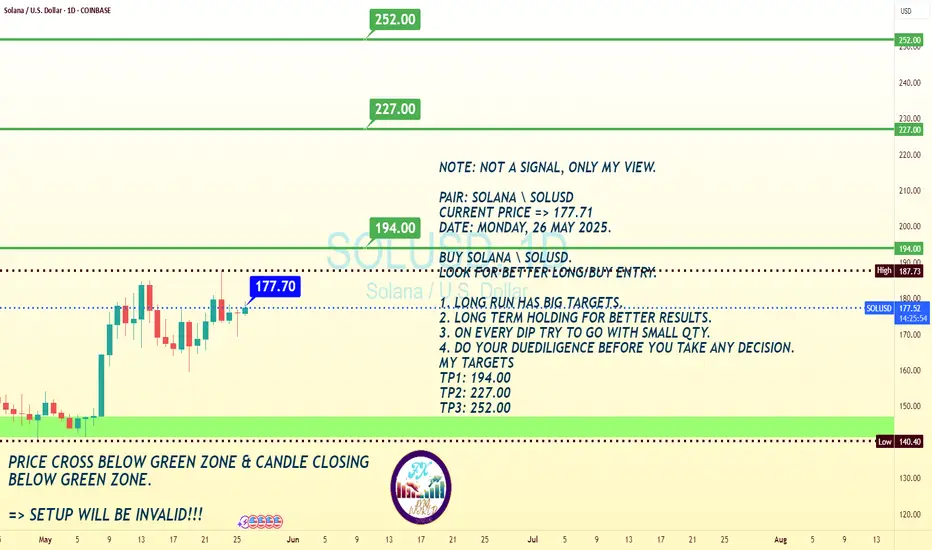
SOLUSD Trend Analysis DAY TF BUY The provided chart and analysis outline a bullish outlook for SOL/USD (Solana against the US Dollar) as of May 26, 2025. The current price is noted at **177.71**,
with a strong recommendation to look for long/buy entries, particularly on dips. The analysis emphasizes long-term holding for optimal results, with three key profit targets: **TP1: 194.00, TP2: 227.00, and TP3: 252.00**.
**Key Observations from the Chart**
1. **Long-Term Bullish Trend**: The analysis highlights that Solana’s long-run trajectory has significant upside potential. The suggested strategy involves accumulating positions gradually, especially during price retracements, to maximize gains over time.
2. **Green Zone as Critical Support**: The chart indicates a "green zone," which acts as a crucial support area. If the price crosses below this zone and closes a candle beneath it, the bullish setup becomes invalid, signaling a potential trend reversal or deeper correction.
3. **Risk Management**: Traders are advised to exercise caution by using smaller quantities on each dip and conducting due diligence before entering trades. This approach minimizes risk while capitalizing on upward momentum.
Solana's fate: pump or dump ?Hello friends
You see that Solana, after its good growth, got stuck in a range and is gathering strength. Now, considering the strong upward trend of this currency, it can be said that this force can push the price upwards, but everything is possible in the market, so observe capital management and trade with your will and wisdom.
*Trade safely with us*
where to buy ?Hello friends
Given the good growth of this currency, we are witnessing a price correction and this is an opportunity to buy in the price correction in the support areas and move with it to the specified goals, of course with capital and risk management.
*Trade safely with us*


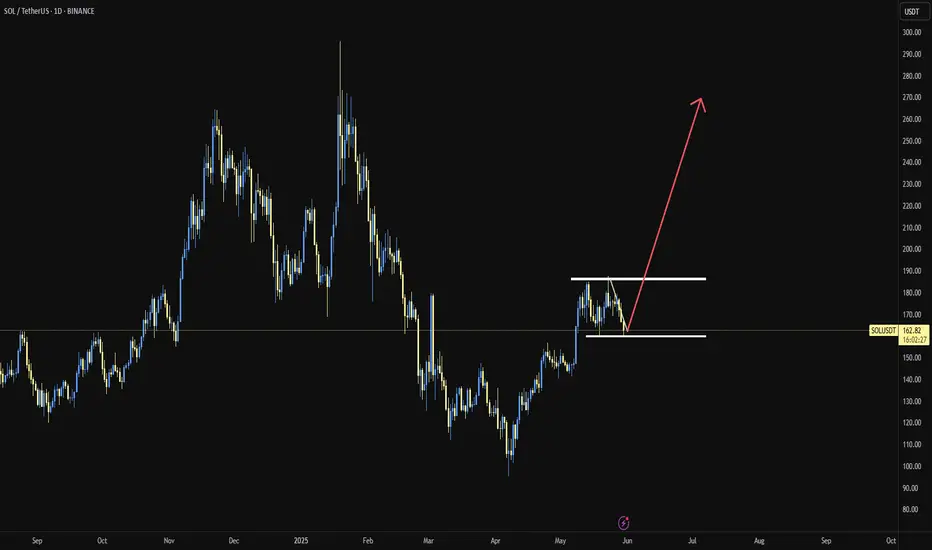
Solana | SOL spot TRADE SETUP +65%Firstly, let's look at the SOL chart from a larger view to confirm the agreement for a bullish setup.
What we see above is a clear bullish bottom, followed by a sharp V-Shaped recovery in the daily timeframe.
From here, the ideal entry could be within this zone, either dollar-cost average or just one spot buy:
With the STOP-LOSS around here:
And THREE TP (take profit) points:
1️⃣
2️⃣
3️⃣
Naturally with the timeframe of your HOLD increasing as your target moves higher.
_________________________
BINANCE:SOLUSDT
Solana, Consider The Bigger Picture —$420 Isn't The Final TargetThe day before yesterday, based on session close, 23-May, marks a strong rejection from resistance, a mild resistance I should say but, this doesn't change much or anything when it comes to the bigger picture and what we expect in the coming weeks and months.
Good evening my fellow Cryptocurrency trader, I know it is Saturday night but still, it is fun to work.
When in doubt, zoom out... What happens if there is no doubt?
Well, when there is no doubt, rest easy and buy more. Hold easy and profits will come.
Notice the blue line on the chart. This line marks the low from 19-May. While we had a rejection 23-May there is absolutely no bearish action on this chart. The following day, yesterday, was neutral and we will see what the market does today.
The action is happening pretty high compared to the 19-May low. This low is the main support zone and also the baseline of our rounded bottom. $160. You can say that Solana is truly bullish above this level. If it moves below, nothing happens because this isn't likely to happen but if it happens it simply means a market shakeout or bear-trap is taking place. Why? Because we are bullish now, the bullish bias has been confirmed and we will see growth long-term.
Are you aware that interest rates, by the FED (USA), will be lowered next month? This will be used as the catalyst for the Cryptocurrency market to produce astounding growth. When this event happens, you should be fully invested, "buy like is the end of the world" remember?
That's the situation in which we are now. Prices are still low.
Prices are not low as in trading at $100 or $110. But you will consider them super low when Solana starts trading at $300 or higher.
Here is the thing, when the rise happens it will be so sudden and so strong, that you will be wondering, "why didn't I buy when prices were low?" "Master Ananda told me so many times, so many charts..."
It is not too late. Cryptocurrency is set to grow. Long-term.
Thanks a lot for your continued support.
Namaste.
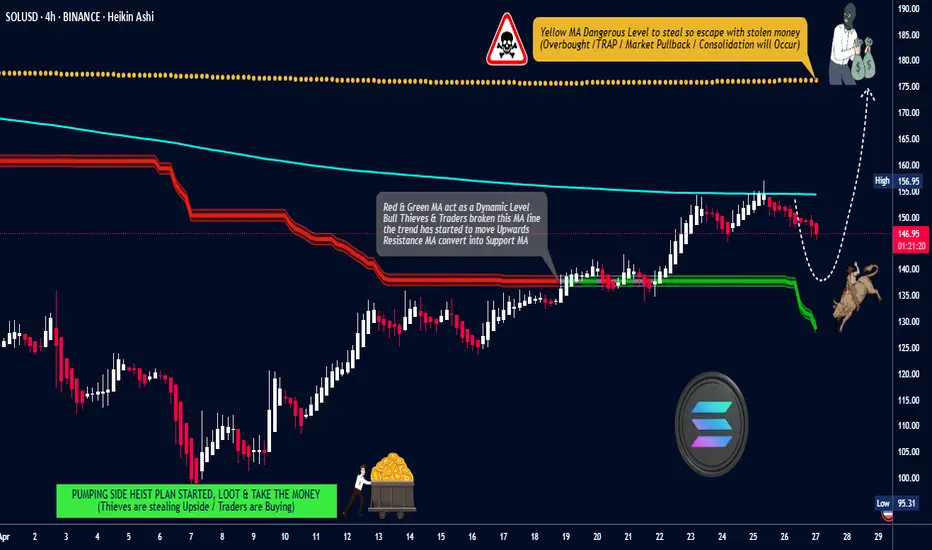
SOL/USD "Solana vs U.S Dollar" Crypto Heist Plan (Day/Swing)🌟Hi! Hola! Ola! Bonjour! Hallo! Marhaba!🌟
Dear Money Makers & Robbers, 🤑 💰💸✈️
Based on 🔥Thief Trading style technical and fundamental analysis🔥, here is our master plan to heist the SOL/USD "Solana vs U.S Dollar" Crypto Market. Please adhere to the strategy I've outlined in the chart, which emphasizes long entry. Our aim is to escape near the high-risk Yellow MA Zone. Risky level, overbought market, consolidation, trend reversal, trap at the level where traders and bearish robbers are stronger. 🏆💸"Take profit and treat yourself, traders. You deserve it!💪🏆🎉
Entry 📈 : "The heist is on! Wait for the MA breakout (156.00) then make your move - Bullish profits await!"
however I advise to Place Buy stop orders above the Moving average (or) Place buy limit orders within a 15 or 30 minute timeframe most recent or swing, low or high level for Pullback entries.
📌I strongly advise you to set an "alert (Alarm)" on your chart so you can see when the breakout entry occurs.
Stop Loss 🛑: "🔊 Yo, listen up! 🗣️ If you're lookin' to get in on a buy stop order, don't even think about settin' that stop loss till after the breakout 🚀. You feel me? Now, if you're smart, you'll place that stop loss where I told you to 📍, but if you're a rebel, you can put it wherever you like 🤪 - just don't say I didn't warn you ⚠️. You're playin' with fire 🔥, and it's your risk, not mine 👊."
📍 Thief SL placed at the nearest/swing low level Using the 4H timeframe (130.00) Day / Swing trade basis.
📍 SL is based on your risk of the trade, lot size and how many multiple orders you have to take.
🏴☠️Target 🎯: 175.00 (or) Escape Before the Target
🧲Scalpers, take note 👀 : only scalp on the Long side. If you have a lot of money, you can go straight away; if not, you can join swing traders and carry out the robbery plan. Use trailing SL to safeguard your money 💰.
💰💵💸SOL/USD "Solana vs U.S Dollar" Crypto Market Heist Plan (Swing/Day) is currently experiencing a bullishness,., driven by several key factors. .☝☝☝
📰🗞️Get & Read the Fundamental, Macro, COT Report, On Chain Analysis, Sentimental Outlook, Intermarket Analysis, Future trend targets... go ahead to check 👉👉👉🔗🔗🔗
⚠️Trading Alert : News Releases and Position Management 📰🗞️🚫🚏
As a reminder, news releases can have a significant impact on market prices and volatility. To minimize potential losses and protect your running positions,
we recommend the following:
Avoid taking new trades during news releases
Use trailing stop-loss orders to protect your running positions and lock in profits
💖Supporting our robbery plan 💥Hit the Boost Button💥 will enable us to effortlessly make and steal money 💰💵. Boost the strength of our robbery team. Every day in this market make money with ease by using the Thief Trading Style.🏆💪🤝❤️🎉🚀
I'll see you soon with another heist plan, so stay tuned 🤑🐱👤🤗🤩
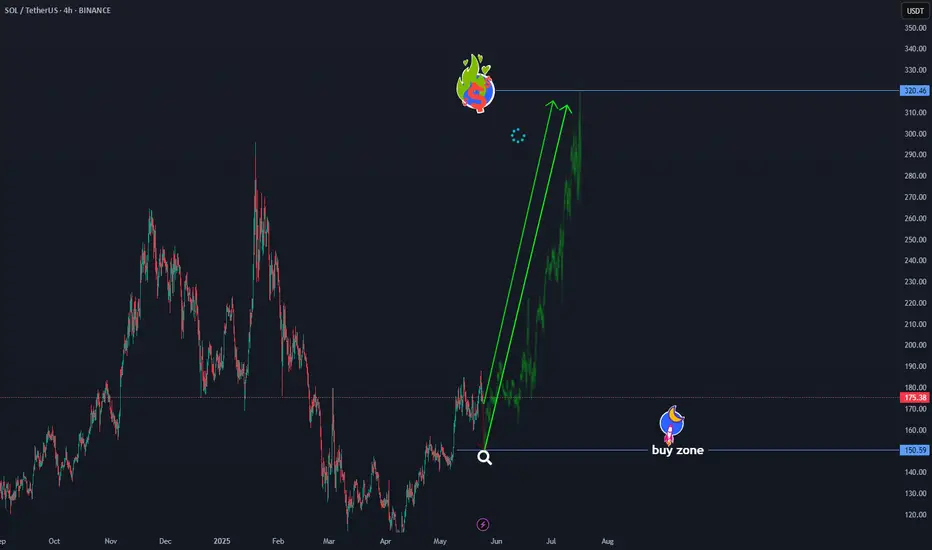
solusdt will go to towards 320$solusdt BINANCE:SOLUSDT will go towards $320
In the current area, a downward correction to $150.5 is possible, but ultimately the final destination is $320,
Market geometry doesn't lie.
$320 is an index for this symbol.
SOL showing strength despite the orange swan event. SOL will either break out or consolidate into a tradable structure. The orange swan event sell-off leading into the weekend is not a good time to enter fresh trades. However, preparing appropriately for what is coming next is a valid strategy.
Full TA: Link in the BIO

SOL/USDTHello, I hope you are well. I left you the analysis of Solana. Tell me your opinion. I saw that it is bullish and it may reach the target I set. If the white area breaks, we can buy again and go up.
