SolanaSol usdt Daily analysis
2 strategy for Solana
Red and green
Sol will break 259$ , fall down to 250 AMEX:AREA and rise up to 290 area
Solusdt

SolanaSol usdt Daily analysis
2 strategy for Solana
Red and green
Sol will break 259$ , fall down to 250 AMEX:AREA and rise up to 290 area

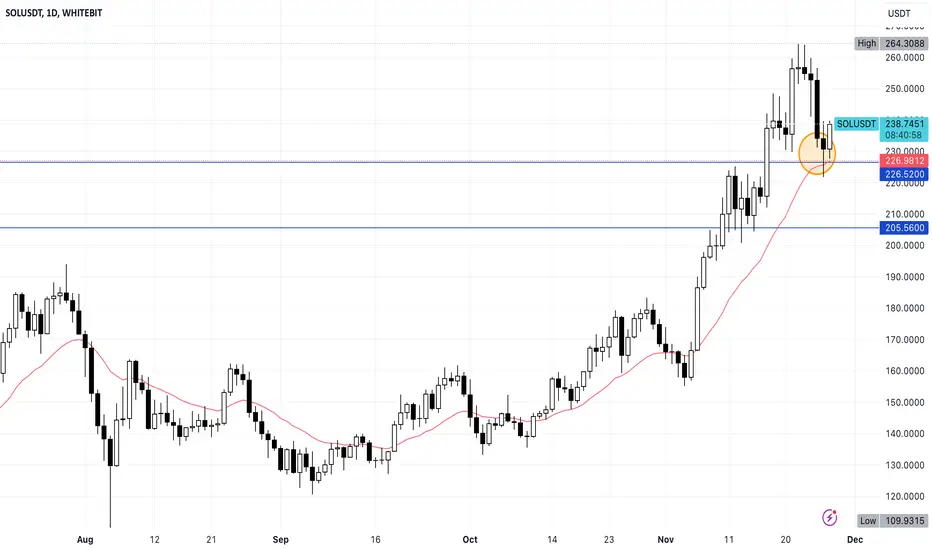
Solana faces $6 billion short bet as price drops 12% from peakSolana (SOL) has faced increased selling pressure since it climbed to an all-time high of $264.63 on November 24. Exchanging hands at $232.72 at press time, the coin’s value has since dropped by 12%.
With waning bullish sentiment in the broader cryptocurrency market, this downward trend has prompted a surge in short positions, with traders betting on a further SOL price drop.
According to Coinglass, over the past 24 hours, the total value of Solana short positions has reached $6 billion, significantly outpacing long positions at $5.38 billion. This indicates a strong bearish sentiment among traders.
On the daily chart, SOL’s price is poised to break below its 20-day Exponential Moving Average (EMA). This indicator tracks the asset’s average price over 20 days, giving more weight to recent prices.
Since October 11, it has consistently served as a dynamic support level for SOL. Currently, the 20-day EMA provides support at $226.52, and a decisive break below this level would confirm the shift toward bearish momentum. If this happens, the SOL price drop may reach $205.56.
On the other hand, if market sentiment becomes more bullish, SOL’s price may rally toward its all-time high of $264.63.
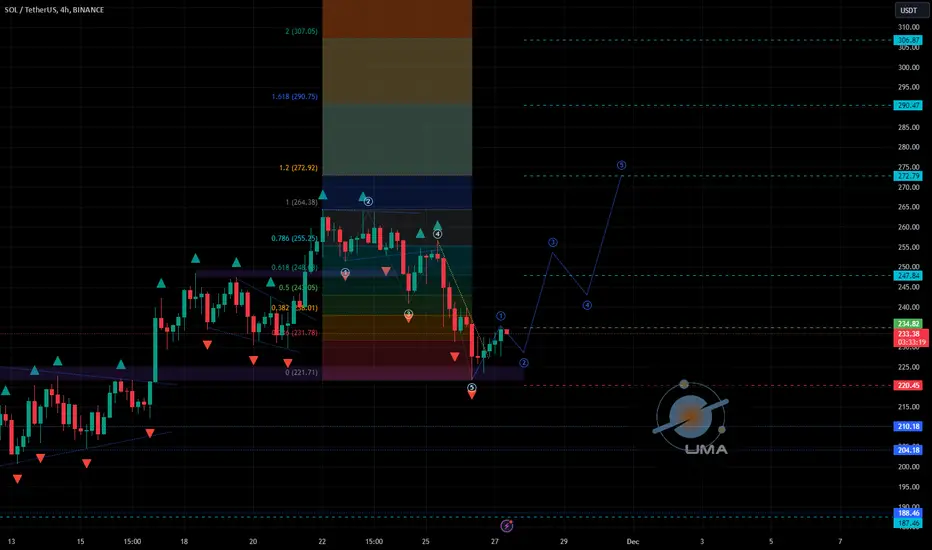
SOLUSDT - UniverseMetta - Signal#SOLUSDT - UniverseMetta - Signal
D1 - Potential retest of the support level, in continuation of the upward movement.
H4 - Fixation behind the trend line after the 5th wave correction. You can consider entering from these levels or wait for the formation of the 3rd wave. Stop behind the minimum.
Entry: 234.82
TP: 247.84 - 272.79 - 290.47 - 306.87
Stop: 220.45
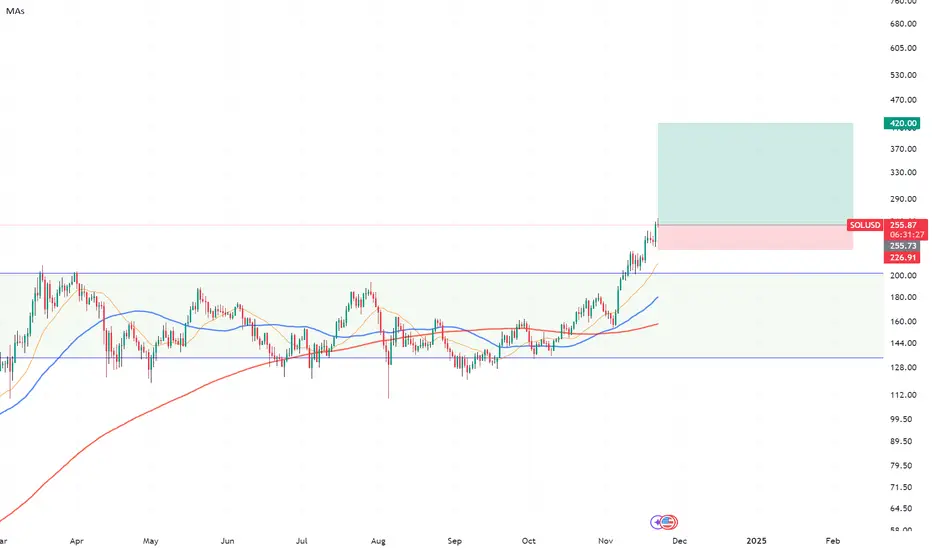
SOLANA $SOLUSD should continue rally after pullback endsSolana COINBASE:SOLUSD already confirmed bullish sequence by confirming higher high above March-2024 high. Since August-2024 low, it ended 3 of (3) at last peak and expect pullback in 4, which soon will end before it should continue rally in 5 of (3).

Most bullish asset on the planetGo and take a look at SOLBTC chart and tell me if you rather be in Solana or Bitcoin.
Sol is usable, something that ETH lost when it became expensive and elitist...
SOL - What To Expect NextMartyBoots here , I have been trading for 17 years and sharing my thoughts on SOL.
SOL is looking good still , into a huge level
Very similar to BTC which moved up hard from this level
Do not miss out on SOL as this is a great opportunity
Watch video for more details


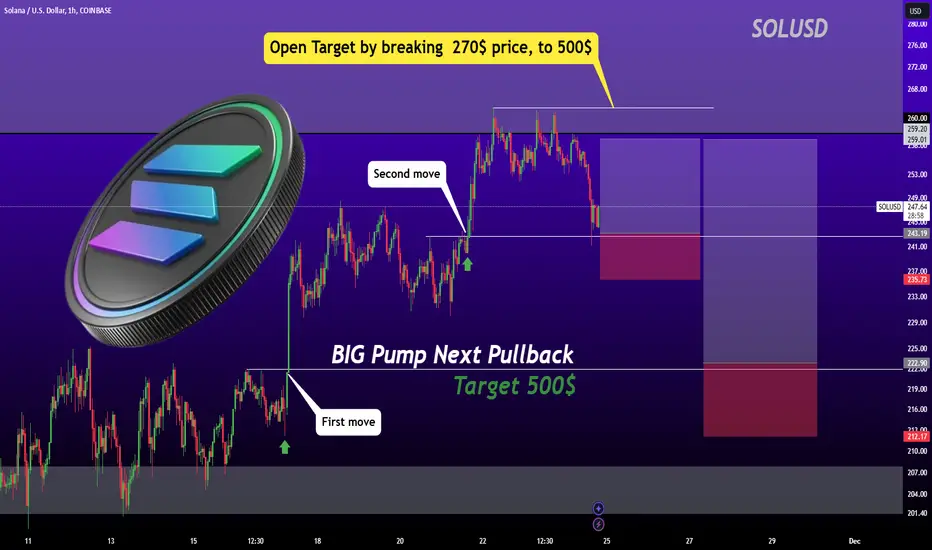
SOL to mooooon 500$📌SOLANA signal:
Signal 1: Bullish Confirmation with Key Breakout 🚀
Solana has showcased a strong first pump followed by consolidation and another breakout at the second move. The chart suggests the potential for continuation to higher levels. A critical pullback entry zone lies between $235–$237, offering a safer opportunity for buyers to join the trend. Targeting $270 and beyond is now a bullish outlook! 🎯
Signal 2: Target Open Beyond $270 💰
The breakout above $270 could signal the next leg up toward the $500 target. Current price action suggests a healthy pullback structure, aligning with the big pump setup. Keep your stop-loss tight around $212–$222 to protect against market volatility. 📈✨
🔥 Plan your entries carefully and ride the wave toward $500! 🚀
SOL/USDT BULLBACK BUY ZONESOL/USDT has huge buying volume. Now as I have marked a Sell side liquidity line below the previous low. When price will go down to grab that liquidity loop then we will buy in marked Demand Zone.

SOL DUMPBased on recent pullback expecting SOL to test the waters of $196 or lower in the coming days.
Let's see how it goes

Solana 26 Nov 2024 Bullish and Bearish ZoneBullish zone 241
Bearish zone 227.5
Note: This is not a buy/sell call. Use stop loss whenever trade.

SOL Breaks Out: Bullish Momentum Building SOL has been consolidating within a channel but has successfully broken out, signaling potential bullish momentum and the likelihood of further upward movement.

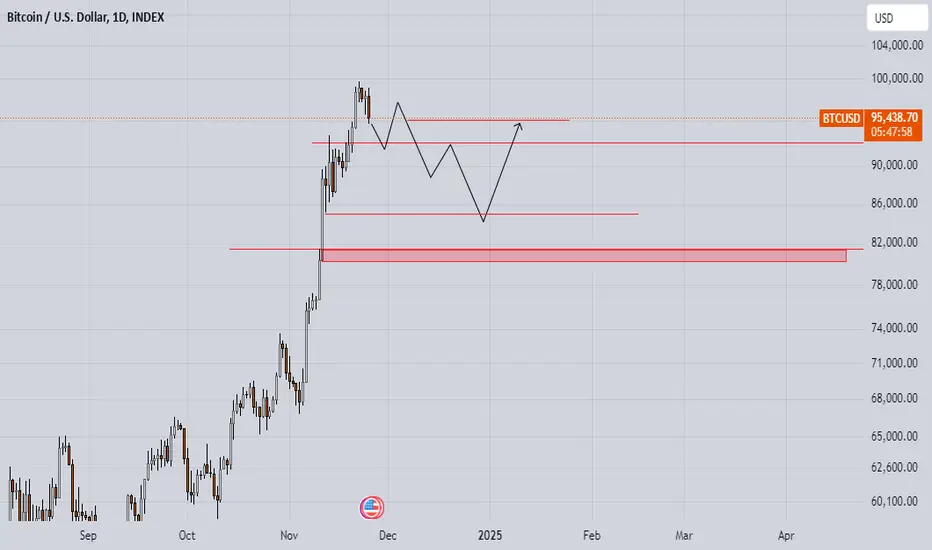
btcusdtLet's not skip the possibilities
The country's budget deficit and rampant inflation are such that even Elon Musk admitted that America is going bankrupt. Be careful in your transactions.
Solana may be set for the recovery. Here's why:Data from Coinglass reveals that Solana’s Long/Short ratio on the 1-hour timeframe has climbed to 1.17. A ratio above 1 suggests a higher number of traders betting on a price increase compared to those anticipating a decline.
Currently, 54% of Solana traders hold long positions, while 46.17% expect a drop below $255.
On the weekly chart, Solana’s price has surged above the 20 and 50 Exponential Moving Averages (EMAs), key indicators that measure trends.
With SOL currently priced at $255, above both EMAs, the altcoin seems poised to continue its upward direction. The formation of a bull flag further supports this bullish outlook.
As long as the price remains above the upper trendline of the consolidation phase, it could rise toward $325. However, if selling pressure takes hold, this bullish scenario could shift. In that case, SOL might fall below $200.

Elon just Retweeted Official DogeGov Twitter... Send it!Elon Musk just retweeted the official DogeGov twitter account at 11:00am ET on 11/25.
Expect this one to go much higher much earlier than anticipated as Elon will likely continue to interact with the DogeGov community.
x.com

#SOL/USDT Ready to take off upwards#SOL
The price is moving in a descending channel on the 1-hour frame and sticking to it well
We have a bounce from the lower limit of the descending channel, this support is at a price of 244
We have a downtrend, the RSI indicator is about to break, which supports the rise
We have a trend to stabilize above the moving average 100
Entry price 254
First target 261
Second target 269
Third target 278

Why is SOLANA expected to reach $300 soon?Hello and greetings to all the crypto enthusiasts, ✌
In several of my previous analyses, I have accurately identified and hit all of the gain targets. In this analysis, I aim to provide you with a comprehensive overview of the future price potential for SOLANA, 📚💡
In addressing the query posed in the heading, Solana has demonstrated a consistent ability to outperform Ethereum in numerous key performance metrics over the past few months. This is further complemented by its highly proficient development team, which has implemented several strategic updates, positioning Solana at the forefront of blockchain technology with state-of-the-art innovations. 📚🎇
Given the project's robust fundamentals, a price target of $300, along with an anticipated 17% price appreciation, appears well within reach. 📚🐋
Moreover, the technical analysis corroborates this optimistic projection, reinforcing the likelihood of continued upward momentum. 📚✨
🧨 Our team's main opinion is Solana has outperformed Ethereum, backed by strategic updates, a strong development team, and solid fundamentals, with a $300 price target and 17% increase expected, supported by technical analysis. 🧨
Thank you for your attention. If you have any questions or comments, I’m here to respond to you. 🐋💡

Weekly Crypto Facts: What to expect next?Hello traders and investors!
Last week saw several interesting developments in crypto assets that may influence the situation in the coming days.
BTC : The breakout impulse from the range on the weekly timeframe continues. This marks the fourth weekly consecutive bullish candle, with declining volume (!) compared to the previous three. This could indicate a lack of interest from both buyers and sellers at these price levels. We might see a consolidation period. A similar situation occurred recently on the daily timeframe, where consolidation lasted for six days before a new buying impulse formed (see the post from November 15). Note that the key candle for the breakout is now from November 11.
DOT : The price formed a buyer's impulse on the weekly timeframe, surpassing 6.611 (the starting level of the last seller's impulse on the weekly chart). The volume and spread of the weekly candle are impressive. It’s possible that the price may rise further without a correction. If there is a pullback to 7.775–8 and the buyer resumes, it could present a buying opportunity.
OP : The price broke out above the range’s upper boundary on the weekly timeframe (1.989). The weekly candle’s volume and spread are impressive. On the daily chart, the price has been consolidating above 1.989 for three days. We are watching for the price’s reaction to 1.989—whether the buyer will defend the breakout from the range. The key candle of the last buying impulse on the daily chart from November 21 crosses 1.989. If the seller pushes the price back into the range and defends this return (at 1.989), it could be an opportunity to look for short positions.
SOL : The price updated its all-time high at 259.9. The weekly candle’s volume is declining, which may indicate a lack of interest from both buyers and sellers at these levels. A consolidation period could be ahead. We will assess the seller's reaction by the end of this week.
TON : Factors have emerged favoring the realization of the buyer’s vector within the range on the weekly timeframe, with a target of 7.260.
Good luck with your trading and investments!

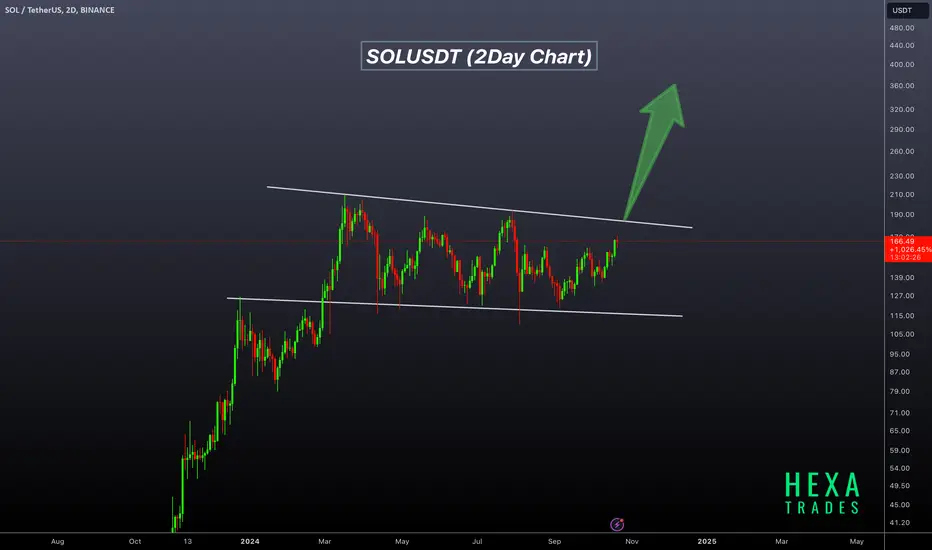
SOLUSDT Bullish Flag PatternSOLUSDT Technical analysis update
SOLUSDT has been forming a bullish flag pattern over the last 230 days. The price is now moving toward the flag resistance line for a potential breakout. Once the breakout occurs, we can expect a price move of 50% to 150%. Additionally, the price is trading above the 100 and 200 EMA on the daily chart.
Buy level: After confirmation of the breakout from the flag pattern.
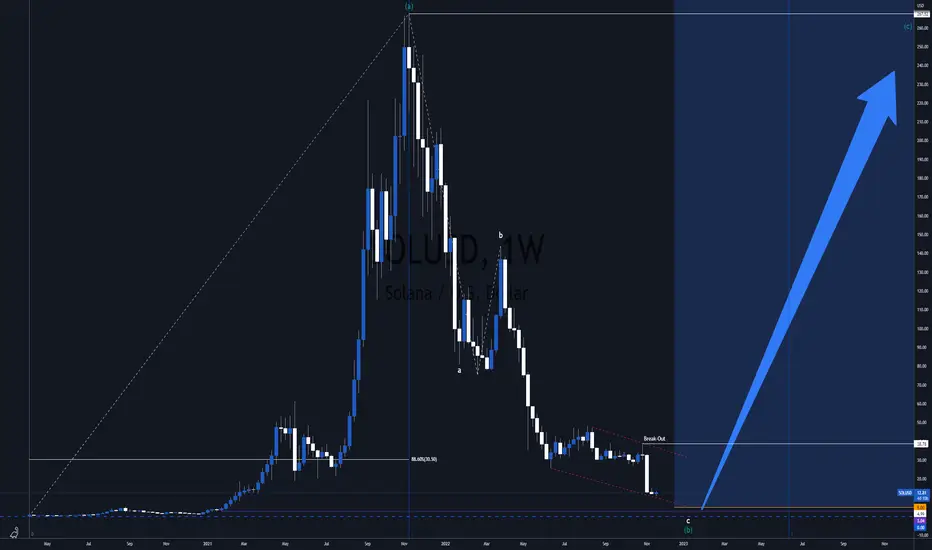
Solana to $750 - BUY & HODLSolana will not go bust, it's too big for that.
SOL ( SOLUSDT , SOLUSD , SOLBUSD ) has great value behind it.
The project is amazing, and it's on SALE!
So, I am holding and adding even more @ $5 .
Yeah... when people are panicking, I buy. :))))
My Technicals:
* Elliott Wave A-B-C Pattern
* Double Bottom
* Demand Zone
* Double Bottom
* Fibonacci Retracements
The Fibonacci Time Zones point me to a Bull Market Cycle starting with '23.
Good luck getting rich! :D
Solana (SOL) Price Technical Analysis - Nov, 2024Solana SOL, priced at currently ($256.83) picked up momentum after breaking out of $249 on Nov. 21st and hit a new all-time high above $264 on Nov. 22nd, breaking from the previous high from 2021.
The new all-time high is a bullish sign as it shows solid demand for the asset from the bulls. With no overhead resistance above the region now, a new high clears the path for further gains. If buyers maintain the price above $248, the SOL/USDT pair is likely to skyrocket to $300.

SOL looks bullish againsol seems to have completed a diametric correction as the g wave is dwarfed another bullish trend is expected to form.
By maintaining the green range, it can move towards the targets.
Closing a daily candle below the invalidation level will violate this analysis.
For risk management, please don't forget stop loss and capital management
When we reach the first target, save some profit and then change the stop to entry
Comment if you have any questions
Thank You
