SOL/USD Chart AnalysisHello to all respected traders. This is my first ever chart analysis on trading view. I'm not sure if Solana will go according to analysis. Kindly write your valuable comments to my analysis.
Thank You
Solusdt

SOLANA has formed a Cup & Handle Pattern on the weekly/daily.SOLANA known for making some incredibly big moves over short periods of time. It is currently forming the handle of a large Cup & Handle formation, which could signal substantial price appreciation over the coming year or so.
Good luck, and always use a stop loss.

SOL Short Term CupThere's cup formation probability in the short term view of Solana.
When we look at the chart we can see it by looking at candle contacts easily.
Below $137 shows cup bottom area. If price can break it up it will reach to cup completion zone between $155 - $162.
For the succesful cup, price has to break $162 without any rejection and need retest after break out there.
First we need to see $137 breaking to consider long and safer move in my opinion. Then let's drive this cup!

SOLANA BULLISH SETUP (15m TF FVG Entry)BINANCE:SOLUSDT should hit the FVG area which can be seen in the 15m timeframe, and from there it should head up towards the 136-138 range (most probably a double top).
What do you think?

Is there enough juice for SOL?SOL trades around $132, just above 4HR 50MA, however, failing to stay above $135. If price stays within the current range and reclaims $135, that could be bullish. Otherwise, assuming the move to $135 was a fakeout, SOL could head back to $120.
SOL Trends Sol price was moving between white-blue uptrend channels since Dec. 2023. So there was a clean uptrend path in this direction.
But then, price broke white uptrend channel on August first time. Then it moved inside of it for few weeks before it drop below it.
Red downtrend channel working well as resistance for the price since Solana's $210 times. When the price reached this red channel it rejected there everytime so far. Now price is currently inside of it. If the price can break this channel up it can continue to white uptrend channel for the retest move. In this case, that retest would point $158- $160 in price.
Or this red downtrend channel will work as a resistance again and will push the price down.

Solana is going to $170. Here's why:In the weekly chart, the SOL price trend shows constant support from the 50% Fibonacci level at $129.87 and the 50 weekly EMA. Currently, the weekly chart reveals a consolidation phase between the 78.60% Fibonacci level at $198 with the bottom support of 50% Fibonacci level.
The lower high formation within the consolidation range reveals a weakness in the bullish momentum. However, the recent possibility of a morning star pattern near the crucial support teases a new bullish cycle.
The DMI indicator in the weekly chart reveals an indecisive trend between the VI lines. Further, a declining trend is visible in the ADX line during the SOL price consolidation phase.
Hence, the momentum is declining, but the trend still needs to be decided. A bullish cycle will reveal a positive alignment in the VI lines, and a potential uptick in the ADX line will help sustain the uptrend.
Using the trend-based Fibonacci level, the SOL price uptrend shows the next resistance at 23.60% at $173. The next resistance lies at the $200 ceiling and the $224 mark.
Meanwhile, a Solana whale recently scooped 34,807 SOL tokens, amounting to $4.52 million. This is part of a larger accumulation strategy, with the whale having withdrawn nearly 206,951 SOL tokens worth $29.3 million.
This puts Solana in the bullish spotlight for the next month.

Is Solana heading lower? SOL trades around $130, possibly testing 4HR 50MA as resistance. Reclaiming $130-$132 could lead to a retest of $135. Otherwise, a bearish signal at current price levels could lead to lower prices from $118 - $120.
SOLUSDT Trend continuation tradeSOLUSDT has been ranging between the 140 and 160 levels, but it has recently broken and closed below this range. This indicates a shift in market dynamics. The market might be heading to retest the area where we observed a bullish impulse leg previously. The break below the upward trendline suggests that the price has entered a consolidating phase, which was signaled by the price being above the trendline and showing bullish momentum. Given this context, the market is expected to push a little further down towards a key round number, which could act as a psychological level of support. The target is support level at 120

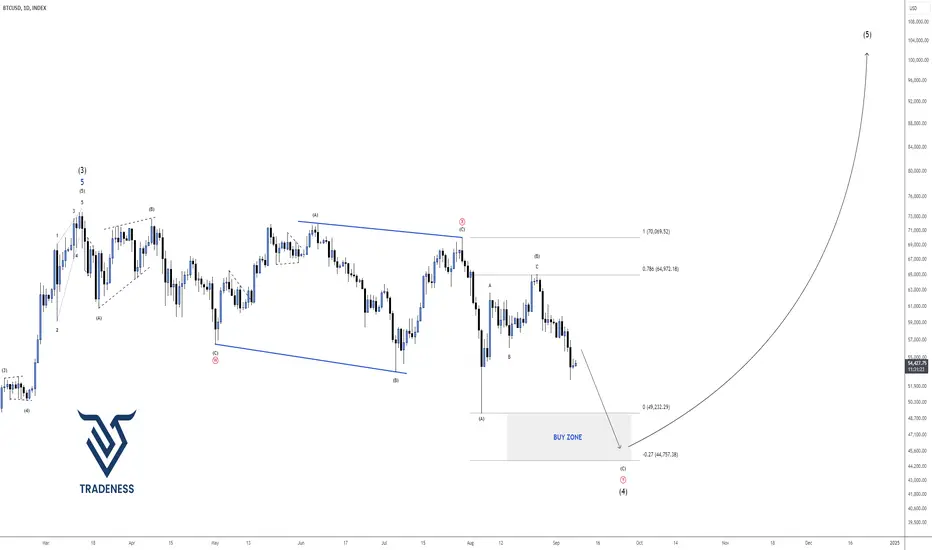
BITCOIN - BULL'S LAST CHANCE Bitcoin has been moving sideways for half a year creating a complex correction WXY( 3-3-3). Complex correction is made up of 3 waves were each wave is also made up of 3 waves ( in the form of ABC's ).
Wave W = Wave X = Wave Y = 3 waves
We are now in the last leg of wave Y. Expecting price to break the lows again and move upwards from our buy zone.
Looking for a strong bullish pressure at our buy zone. Will update the idea once we are there. But for now you can focus on selling targeting 49k level.
WXY Pattern
Goodluck and trade safe!
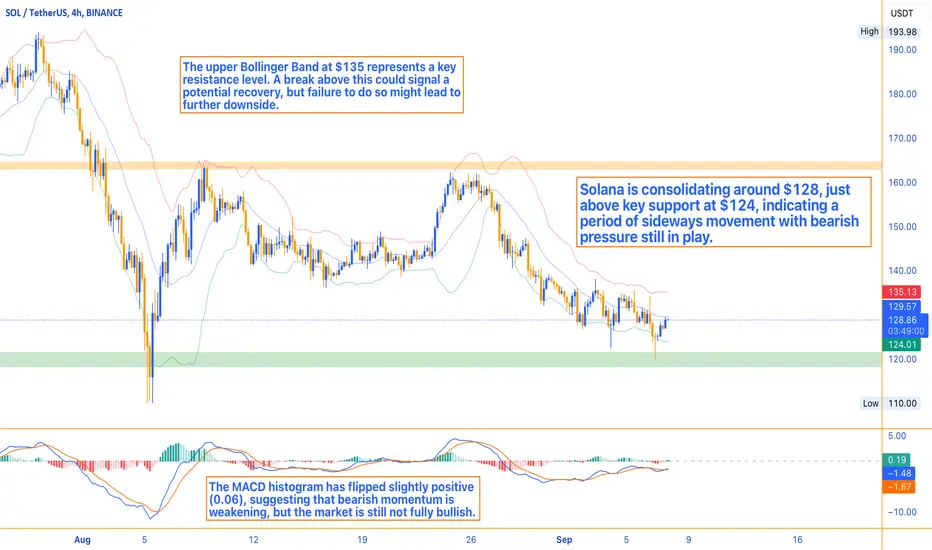
Solana Consolidates Near SupportSolana has faced mounting pressure throughout September 2024, as broader market dynamics continue to weigh on its performance. Much like other cryptocurrencies, SOL is reflecting the bearish sentiment that has characterized the market, with the price consolidating after a significant decline. This pattern of weakness aligns with broader trends in the crypto space, where macroeconomic factors such as liquidity outflows and general caution among institutional investors are impacting asset prices.
Currently, Solana is trading around $128, slightly above its lower support level of $124, as seen on the Bollinger Bands. The consolidation near this lower band reflects persistent bearish pressure, with SOL hovering between crucial support and resistance zones.
Bollinger Bands and Volatility: Solana is positioned near the lower Bollinger Band, indicating continued downside pressure. With a basis at $129.56 and upper resistance at $135.13, SOL remains in a tight consolidation range. The ATR (Average True Range) at 3.50 suggests moderate volatility, meaning sharp price movements are possible, but the current range-bound trading reflects caution.
Momentum Indicators:
The RSI (Relative Strength Index) is currently at 48.01, indicating neutral momentum. This level implies that while Solana isn't heavily oversold, it doesn't have significant buying momentum either, keeping the market in limbo.
The MACD (Moving Average Convergence Divergence), with the MACD line at -1.66 and the signal line at -1.72, suggests a potential weakening of bearish momentum. Although still in negative territory, the positive histogram reading of 0.06 indicates that selling pressure may be tapering off.
Parabolic SAR and Stochastic Oscillator: The Parabolic SAR sits above the price at $133.03, reinforcing the existing downtrend. Meanwhile, the Stochastic Oscillator, with %K at 57.77 and %D at 50.51, shows potential for a short-term upward movement, though it remains below overbought levels, signaling room for price gains.
Short-Term Outlook
Solana appears to be in a consolidation phase, trading between the support at $124 and resistance near $135. If SOL can break above the $135 resistance, it may signal the start of a recovery, particularly if volume and momentum support this move. However, failing to hold above the $127-level SMA could lead to further declines, testing support levels around $122.
Market Sentiment and Broader Trends
Sentiment around Solana remains cautious, particularly after $34.3 million in institutional outflows during August 2024, and this trend is likely to persist unless there are broader positive market shifts. The crypto market as a whole is contending with volatility, driven by global economic uncertainties and liquidity concerns. Solana’s price is particularly vulnerable due to its higher volatility compared to Bitcoin and Ethereum, reflecting the more speculative nature of its market position.
In terms of upcoming catalysts, the Solana Breakpoint 2024 event could provide some momentum if positive developments or partnerships are announced. Until then, the market is likely to remain in a wait-and-see mode, with key levels to watch being $124 for support and $135 for resistance.
Conclusion
Solana is reflecting broader market uncertainty, consolidating around key technical levels with mixed indicators. The $124-level acts as strong support, and a breakdown below could lead to further downside. Conversely, clearing $135 would be a bullish signal, potentially leading to a recovery. However, given the current sentiment and institutional outflows, traders should remain cautious and be prepared for continued volatility.
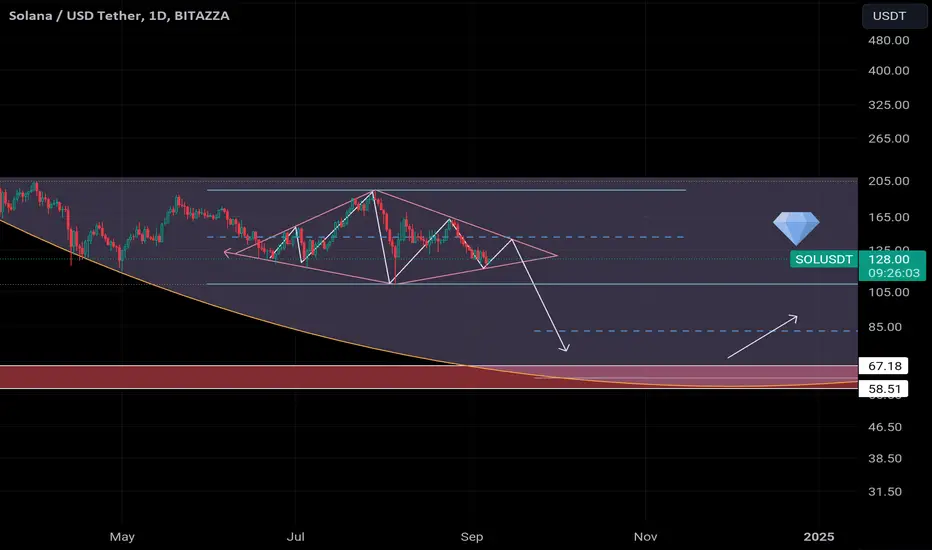
SOL Diamond and Cup FormationsA diamond structure is also appearing in Solana, similar to Bitcoin.
The mid level of the diamond formation points to $146. As long as the price doesn't stay above this level, the mid-term target is the lower red zone, which is in the $58-$67 range.
At the same time, the cup target is also in the same region and this level indicates the bottom area of the cup formation.
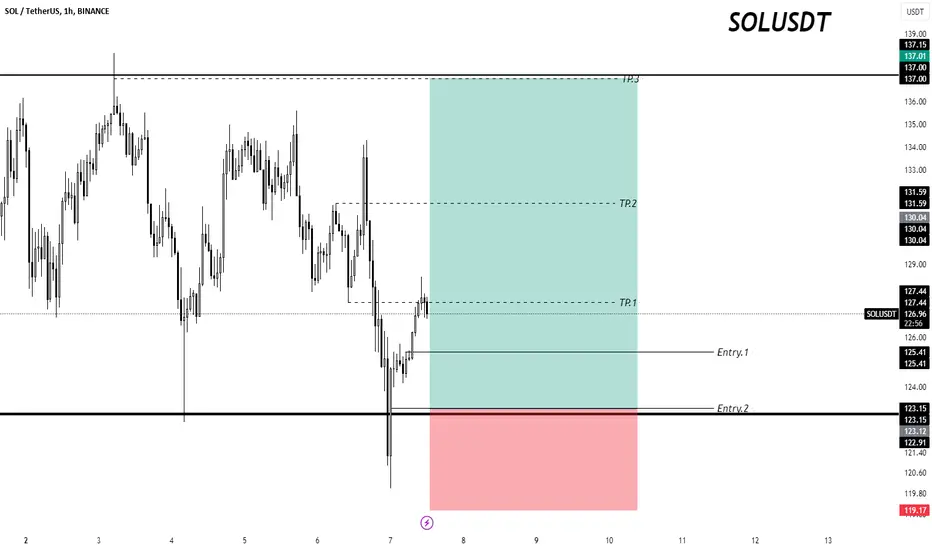
SOL buySOLUSDT Long Setup 🚀
Looking for a solid entry around 125.41* (Entry 1) and 123.12(Entry 2) 🔑. Key support levels in place, waiting for a bullish reversal to hit my targets:
- TP1: 127.44 🎯
- TP2: 130.04 📈
- TP3: 137.00 🏆
Stop Loss: 119.17 🔒
This setup focuses on price action, taking advantage of the pullback and targeting potential higher highs. Time to watch the market closely for confirmation! 👀💹
*Risk management is key!* 🛡️
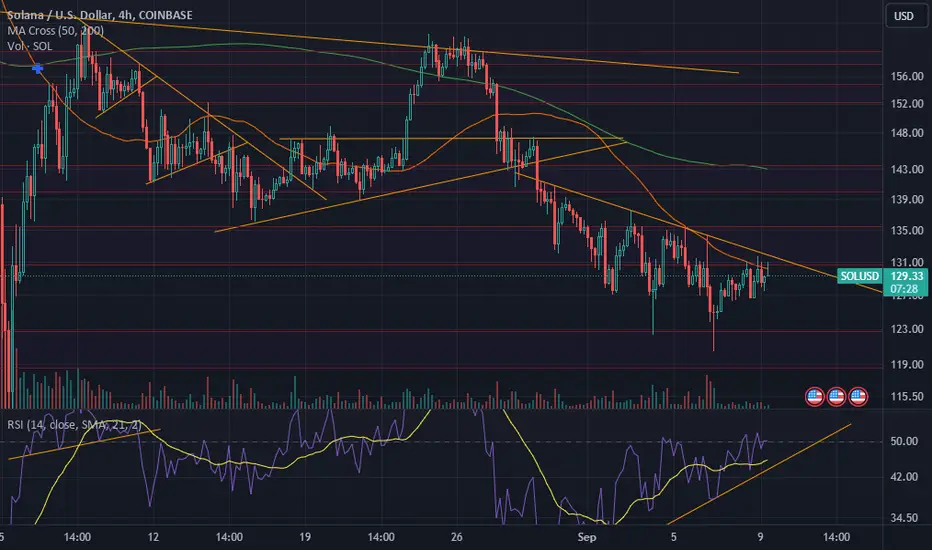
SOL Long Term FormationsNow i want to show what i see on sol long term chart. Let's start then.
- There's narrowing triangle between yellow and red channels.
- There's cup and handle and currently price seems like that it forming handle part of formation.
- There's ascending triangle between blue and yellow channels.
So i think Solana is still bullish for this cycle but it's not right time for that.

Massive Move Ahead #SOL's Next Bullish Breakout or Breakdown ? Yello, Paradisers! Could #SOL be on the brink of a major market move? Let's dive into the latest analysis!
💎#SOLUSDT is currently showing signs of a potential bullish continuation from a critical demand zone at $131.46. We've been closely monitoring #SOLANA as it follows a descending channel, and it recently broke above this formation, gaining momentum within this crucial demand area. If the price can maintain this upward momentum, a strong bullish move is highly probable.
💎For this bullish scenario to unfold, #SOL must break above the key resistance level at $134.95. A successful break of this resistance could trigger a significant rally, with the first target set at the internal resistance zone of $147.58.
💎However, caution remains essential! If the momentum falters at the demand zone, we might see a rebound from the lower support area around $127.98–$126.44. A daily close below this support zone would invalidate the bullish outlook and could pave the way for further declines.
Stay sharp, Paradisers! Keep a close eye on #SOLANA's price action as the next move could be a game-changer🥂
MyCryptoParadise
iFeel the success🌴

Is Solana poised for a reversal?Solana’s (SOL) price has faced notable volatility in recent weeks, struggling to overcome resistance at $160. After multiple failed attempts to breach this level, SOL experienced a significant 20% drawdown towards the end of August.
This decline has left many investors cautious, but recent shifts in behavior suggest a potential rebound. Key indicators now point to a possible resurgence in Solana’s price, raising optimism among traders and analysts.
A key factor in assessing Solana’s potential recovery is the recent negative turn in the funding rate. This metric, which tracks the cost of holding positions in the futuresmarket, often signals shifts in market sentiment.
Brian Quinlivan, Lead Analyst at Santiment, noted in an exclusive comment for BeInCrypto that the funding rate is turning negative. This indicates that the bearish sentiment may be reaching an extreme, which sets the stage for a rebound.
Furthermore, the Chaikin Money Flow (CMF) indicator, which measures the cumulative flow of money into and out of an asset, has established a notable pattern for SOL.
Currently, Solana’s price is trading at $132 after bouncing back from the support level of $126. For SOL to resume its upward trajectory, it must break through the local resistance at $137.
Achieving this would pave the way for a push towards the $160 mark. Historical data shows that Solana has experienced similar consolidation phases between $126 and $160, suggesting a rise to this level could be next.
The factors supporting this forecast are substantial, given that in the past, SOL around $126 has led to subsequent price increases. If SOL maintains its gradual upward momentum, the range-tested level of $137 could act as a springboard for further gains, making a rise to $160 possible.

SOL LONG TRADE IDEASol/Usdt has done MSS and turned into bullish after breaking bearish structure. As Market structure turned into bullish so we will look for longs. For taking entries most important factor is order block with fvg and also SSL above order block. And this OB+FVG+SSL combination has been marked onto the chart.

Long Setup on SOLUSDT / Setup SettingBINANCE:SOLUSDT
COINBASE:SOLUSD
SL1 ---> Low-risk status: 3x-4x Leverage
SL2 ---> Mid-risk status: 5x-8x Leverage
👾The setup is active but expect the uncertain phase as well.
➡️Entry Area:
Yellow zone
⚡️TP:
0.001276
142.00
144.20
147.14
150.3
154.19
🔴SL:
125.42
🧐The Alternate scenario:
If the price stabilizes below the trigger zone, the setup will be cancelled.

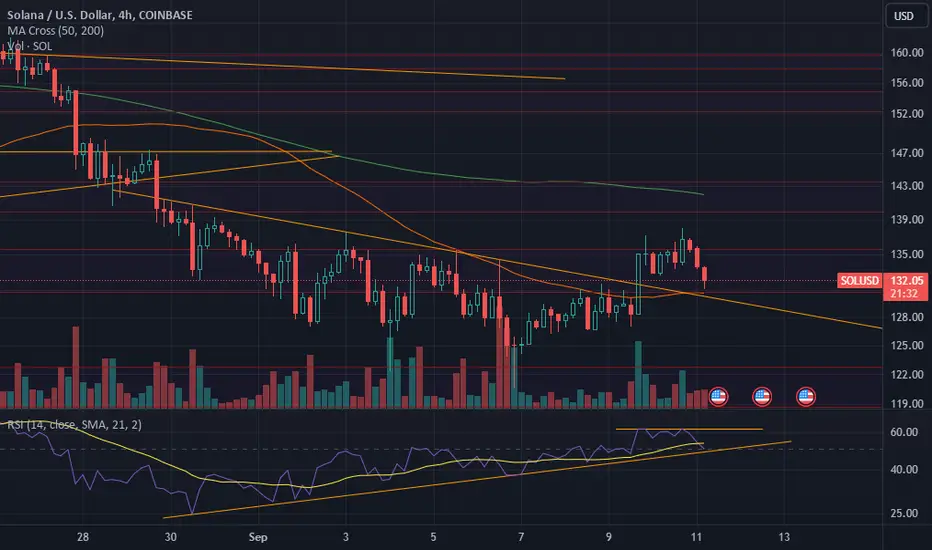
Solana might rebound from the current support levelSolana ( CRYPTOCAP:SOL ) price is currently close to a strong support level. COINBASE:SOLUSD
The $120-$125 support level was tested 7 times and SOL always rebounds.
Will it bounce up this time? I think there's a high chance it does it the macroeconomics this month help.
The numbers we need to pay attention to over the coming days are:
Sept. 6: unemployment rate
Sept. 11: inflation rate
Sept. 12: ECB interest rate decision
Sept. 19: FED interest rate decision

Solana's outperforming, but why is its price crashing?With a 19.14% drop last week, the price for the downtrend continues for Solana this week, with a 5.47% fall last night and breaking below the $130 mark. Further, the recent double-top reversal breaks the neckline at $138 near the 200-day EMA, and the SOL price tests the bottom support zone at $121.
The demand zone at $121 has provided multiple bounce-backs for Solana since the start of 2024. However, the recent double-top reversal warns of a breakdown rally.
Currently, the SOL price is trading at $127 with a Doji intraday candle following the bearish engulfing candle last night. With the long-tail formation, the underlying demand can result in a new bull cycle.
In case of a bearish breakdown, the neck support level is at the $110 low and the $100 psychological mark. However, a broader market impact can result in a new low formation at the $85-$80 demand zone.
On the flip side, based on the Fibonacci levels, a double-bottom reversal from $120 can find resistance at the 23.60% level at $140. A move above $140 can hint at an extended recovery for Solana.

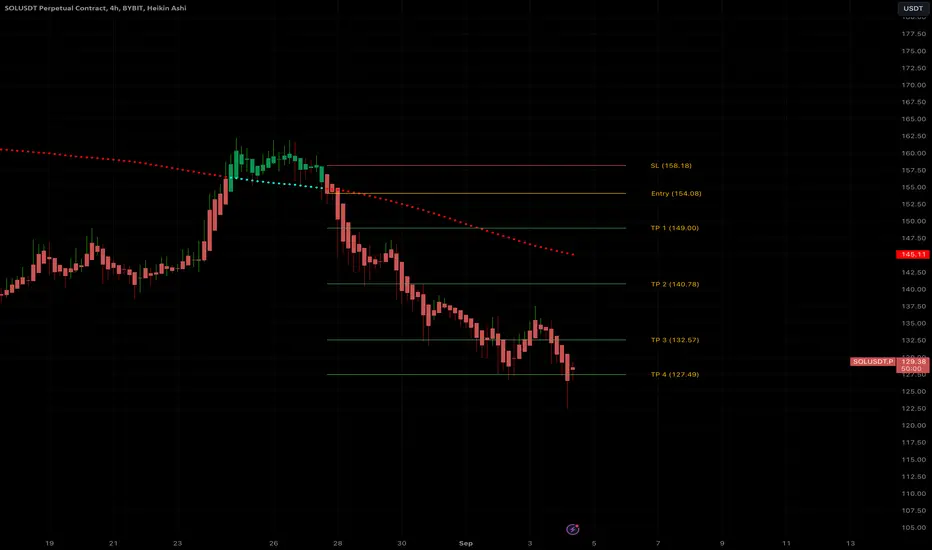
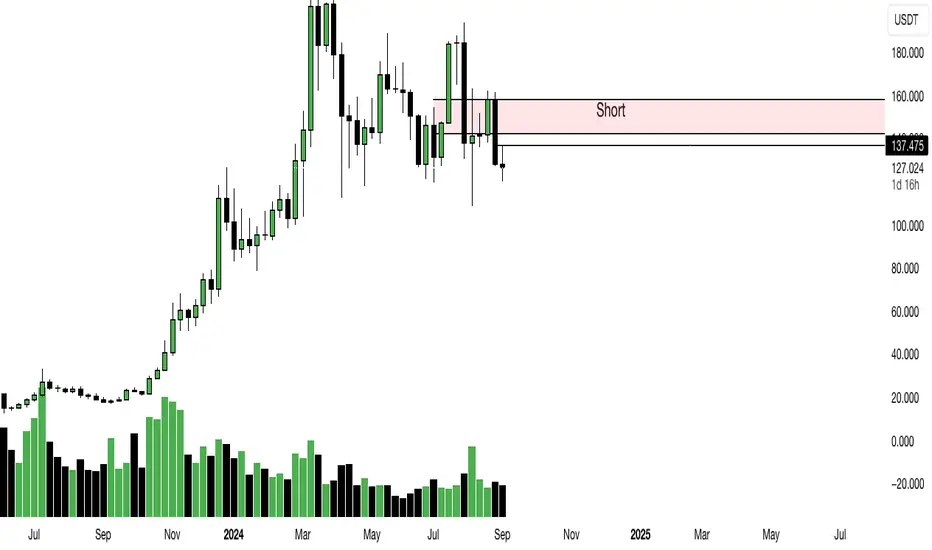
SOLANA (SOLUSD) 170% Profit - Price from $154 to $127SOLANA (SOLUSDT)
Short entry at $124 on 27 August, 2024
Profit target 4 reached on 4 Sep, 2024
At 10x lev, the total profit is 170%
The trailing stoploss for this trade is at $145, so if you are in profit, you can sell 50% and hold your short trade by setting the trailing stop loss at $145
Good luck and all the best.
Namaste!