Could SOL Break $200 and Fly 15% Higher Soon?Hello and greetings to all the crypto enthusiasts, ✌
All previous targets were nailed ✅! Now, let’s dive into a full analysis of the upcoming price potential for Solana 🔍📈.
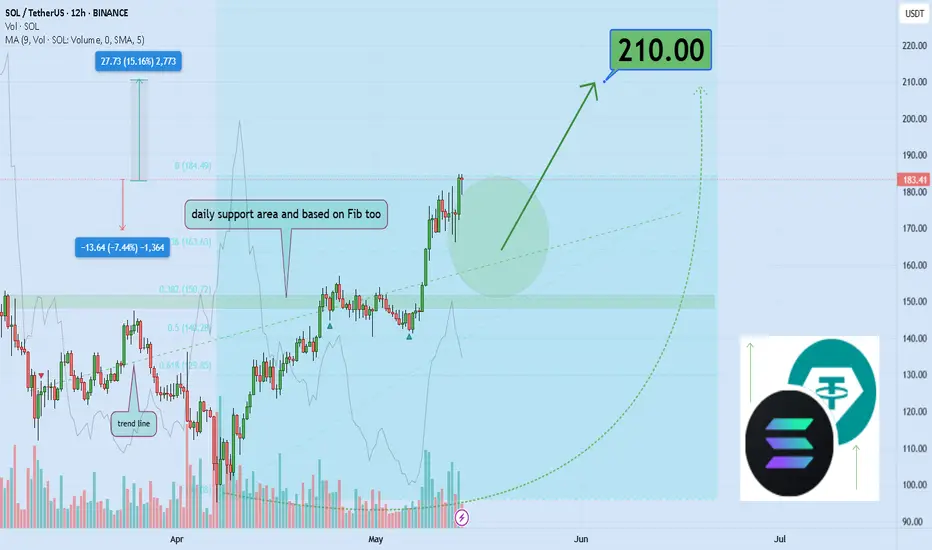
Solana has finally broken out 🚀 — signaling the potential start of a strong bullish leg. With solid confluence between the daily support, Fibonacci retracement, and a well-respected monthly trendline, I’m eyeing a move toward the $210 leve l. A clean break above the key psychological resistance at $200 could confirm this setup. Stay alert — SOL is showing real strength 🔍.
🧨 Our team's main opinion is: 🧨
Solana has kicked off a strong move, and I’m targeting a 15% upside with a main target at $210, once the key $200 psychological level breaks with momentum 🚀.
Give me some energy !!
✨We invest hours crafting valuable ideas, and your support means everything—feel free to ask questions in the comments! 😊💬
Cheers, Mad Whale. 🐋
Solusdt
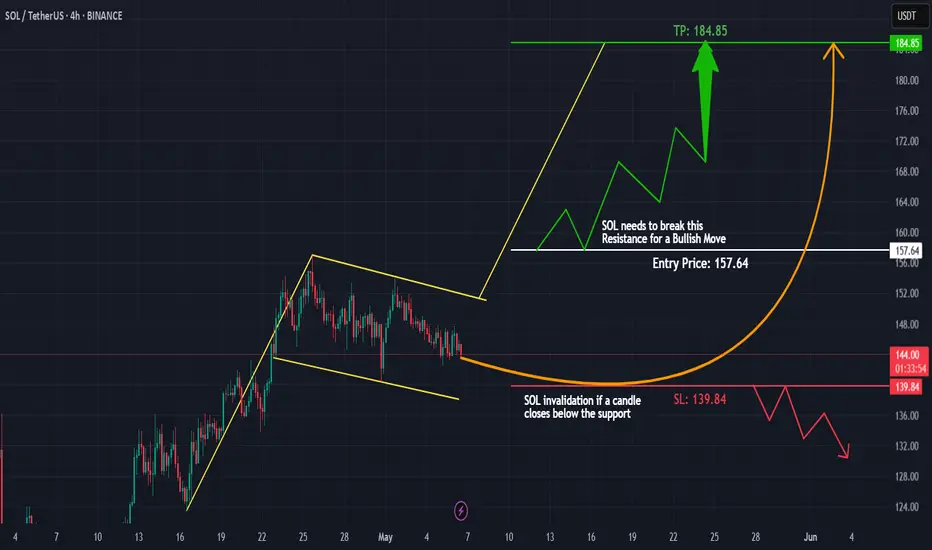
Solana Potential UpsidesHey Traders, in today's trading session we are monitoring SOL/USDT for a buying opportunity around 157 zone, Solana is trading in an uptrend and currently is in a correction phase in which it is approaching the trend at 157 support and resistance area.
Trade safe, Joe.
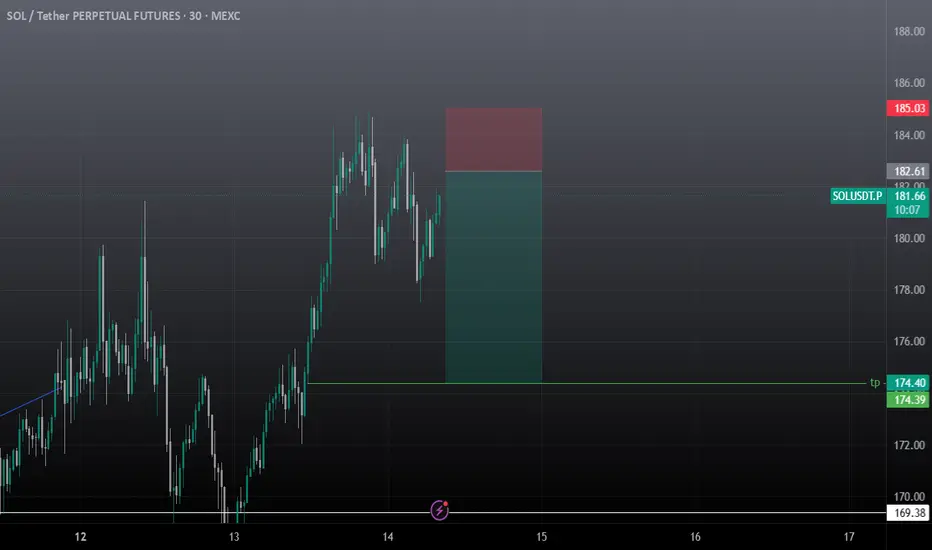
SOL SCALP SetupSOl can retrace to 175$ on ltf, must use sl before taking any trade. Market is too volatile now
If you're stuck, watch (full analysis)Hello friends
Given the high growth of this token, now that it has made a good correction, it makes sense to buy in stages and with capital management and move with it to the specified goals.
*Trade safely with us*
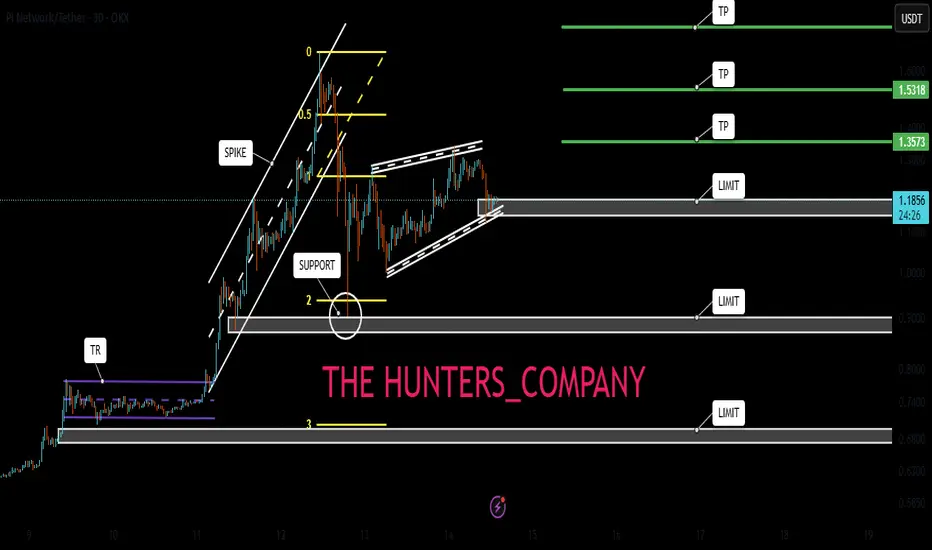
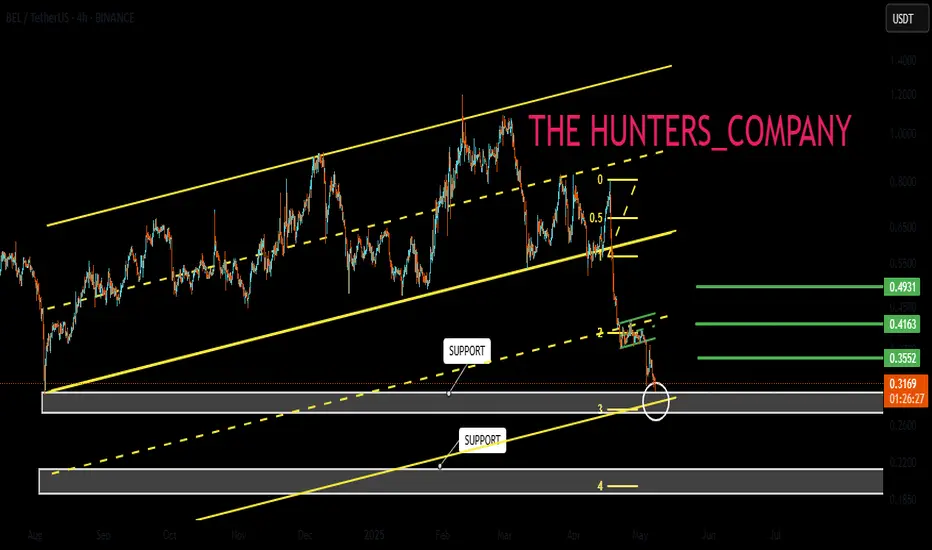
GOOD POINT Hello friends
As you can see, the price has fallen to the bottom of the next channel with the channel break and now the important point is to see if the price is supported considering reaching the bottom of the channel and the important Fibonacci support?
To solve this issue, we suggest you buy stepwise, of course with capital and risk management...
*Trade safely with us*
Solana Builds Bullish Case – Targeting $170 With 17% UpsideHello and greetings to all the crypto enthusiasts, ✌
All previous targets were nailed ✅! Now, let’s dive into a full analysis of the upcoming price potential for Solana 🔍📈.
Solana is showing strong accumulation within a tight range, with increasing volume suggesting strategic positioning by larger players. Price action is approaching a critical support zone, adding confluence to the bullish bias. A potential upside of at least 17% is in play, with the primary target set at $170. 📈
🧨 Our team's main opinion is: 🧨
Solana is consolidating near key support with strong whale activity—looking for at least **17% upside** toward the **\$170** target. 🚀
Give me some energy !!
✨We invest hours crafting valuable ideas, and your support means everything—feel free to ask questions in the comments! 😊💬
Cheers, Mad Whale. 🐋

SOLANA (SOL/USDT) – Bullish Flag Forming on 4H!Hey traders!
#SOLANA is currently consolidating sideways and printing a bullish flag pattern on the 4-hour timeframe – a classic continuation signal after a strong upward move! 🚀
Here's the plan:
Wait for a clean breakout above the flag's resistance
Enter on the retest of the breakout level to confirm support
Apply strict risk management and target the next major resistance zone
Watch for increasing volume to validate the move
Why this matters?
The bullish flag often leads to explosive moves when confirmed properly. Don’t chase the breakout — let price come to you. Patience = profits. 🧘♂️
Key Levels & Entry Plan marked on chart
Drop your thoughts below – do you agree with this setup or see it differently?
Like & Follow for more clean, no-hype trade ideas!
#Solana #SOL #CryptoTrading #BullishFlag #TradingView #TechnicalAnalysis #Altcoins #CryptoSetup #BreakoutTrade

Solana 1-Day Chart – Are We on the Brink of a $1,000 MOONSHOT?!Solana is absolutely on fire! On this 1-day chart, we’re witnessing a massive rising channel that’s been building since 2023. After a solid rebound from the $93 support, Solana has smashed through a fractal resistance line (check that arched arrow from mid-2023 to early 2024 top) . Now, it’s breaking out at a parallel resistance, hanging around $174 — and this could be the setup for a MASSIVE move upward!
I’m calling a potential target of $1,000 if SOLUSDT can muscle through the big resistances ahead: $200, the ATH at $270, and everything beyond. This breakout screams opportunity — Solana might just catch another wave of demand and go parabolic! The $93 support (marked "Back to Nothing Below This Line") looks rock-solid, giving us a strong foundation for this rally.
Key Levels to Watch:
Support: $93 (channel base)
Current Price: $174 (breakout zone)
Resistances: $200, $270 (ATH)
Target: $1,000 (if momentum holds)
Are you ready for this? I’m buzzing — I can’t believe this might actually happen!
Let’s hear your thoughts, traders! Are we heading to $1,000, or will resistance hold us back?

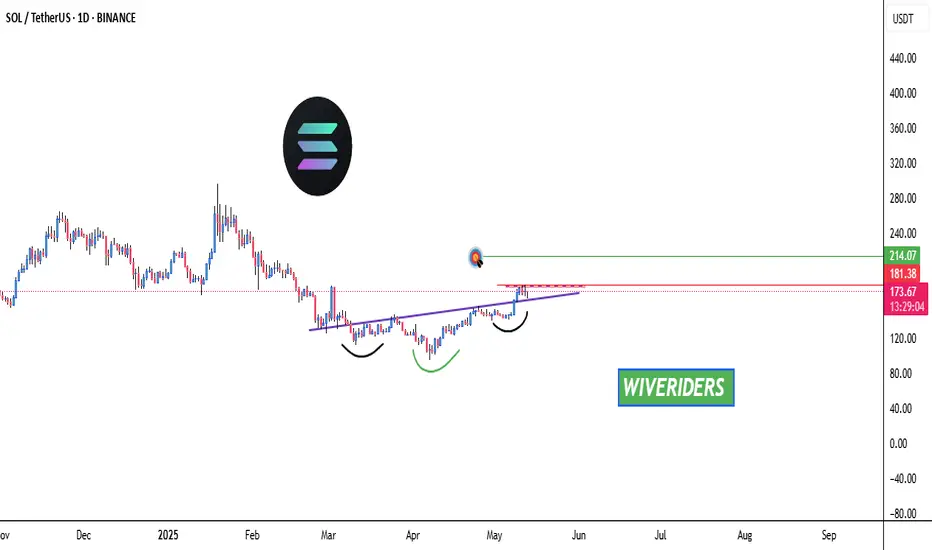
SOL Inverted Head and Shoulders – Breakout Potential!🚀 SOL Inverted Head and Shoulders – Breakout Potential! 📈
SOL has formed an inverted head and shoulders pattern and is now testing the red resistance zone. If the price breaks through this resistance, the first target could be the green line level! 📊
Let’s watch this breakout unfold! 💼💸
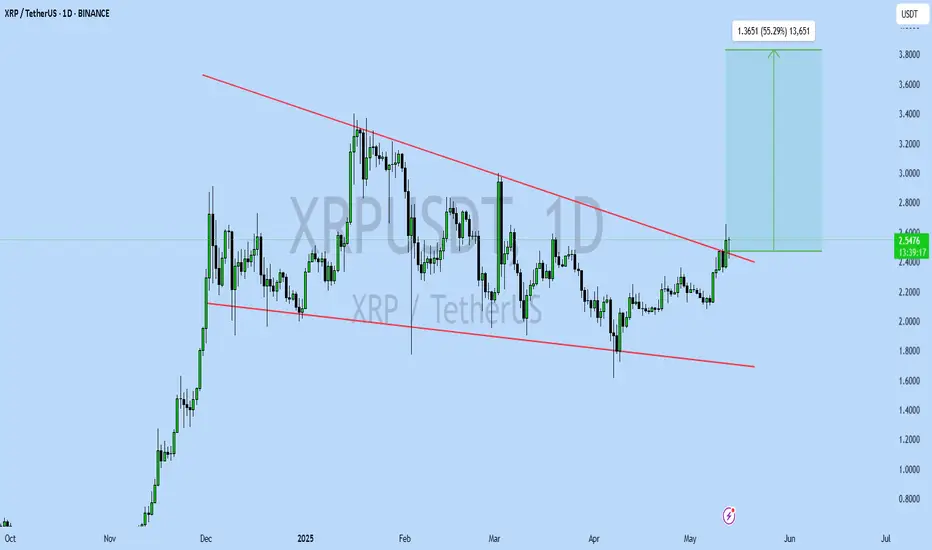
XRPUSDT UPDATE
Pattern: Falling Wedge Breakout
Current Price: \$2.5398
Target Price: \$3.90
Target % Gain: 55.29%
Technical Analysis: XRP has broken out of a falling wedge on the 1D chart with strong bullish momentum. The breakout is confirmed with a daily close above resistance and increased volume.
Time Frame: 1D
Risk Management Tip: Always use proper risk management.
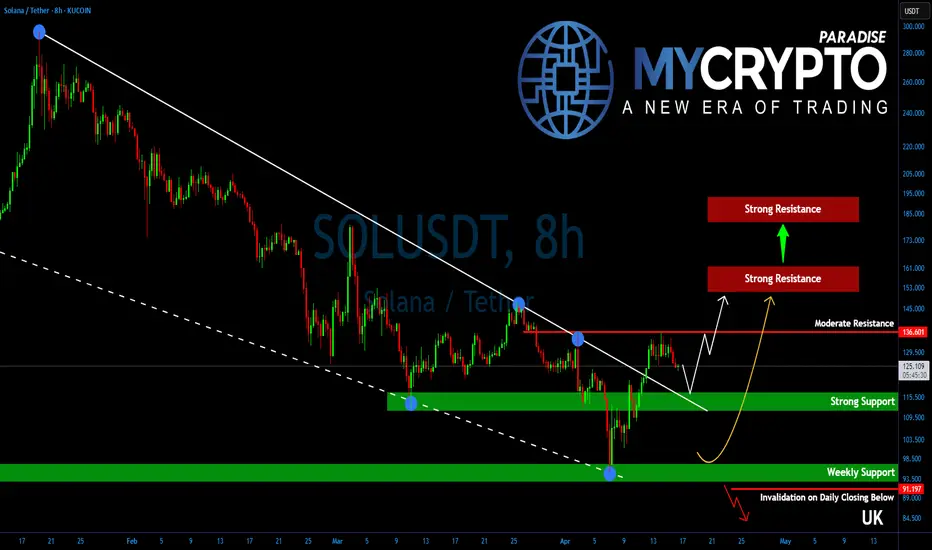
Solana Is One Breakout Away From a Bullish Explosion!Yello, Paradisers! Did you notice how #SOLUSD has been quietly positioning itself while the rest of the market remains uncertain? If you're not paying attention right now, you could be missing one of the cleanest setups on the charts.
💎After several weeks of downside grind and tight consolidation, Solana has just broken out of a falling wedge—a powerful bullish pattern that typically signals trend reversals or the start of a strong upside leg. This breakout wasn’t random either. It occurred after SOL successfully defended a key higher time frame support zone, signaling strength behind the move.
💎For #SOLUSDT, all eyes are on the $136.50 resistance level. This is a critical structural pivot. A clean break and close above this level would confirm a shift in higher time frame momentum from neutral to bullish. Until that happens, bulls still need to proceed with caution—but the setup is clearly developing in their favor.
💎Adding conviction to the idea of a bullish breakout are several supporting factors. Oscillators are showing bullish divergences, a classic sign that seller momentum is fading. At the same time, a golden cross formation on the 12-hour chart is getting closer which typically precedes sustained trend reversals and stronger moves to the upside.
💎If bulls succeed in reclaiming $136.50, the next price targets are $155–$160 as the initial strong resistance zone where some profit-taking could occur. If bulls hold strength, SOL is likely to head further higher and aim for $180–$190, which lines up with the target of the wedge pattern. This is a strong resistance zone and a level which could mark end of the corrective phase for Solana.
💎On the downside, immediate support lies between $110–$115. This is a well-defined range of demand and should offer strong buying interest if any short-term pullbacks occur.
Paradisers, strive for consistency, not quick profits. Treat the market as a businessman, not as a gambler.
MyCryptoParadise
iFeel the success🌴
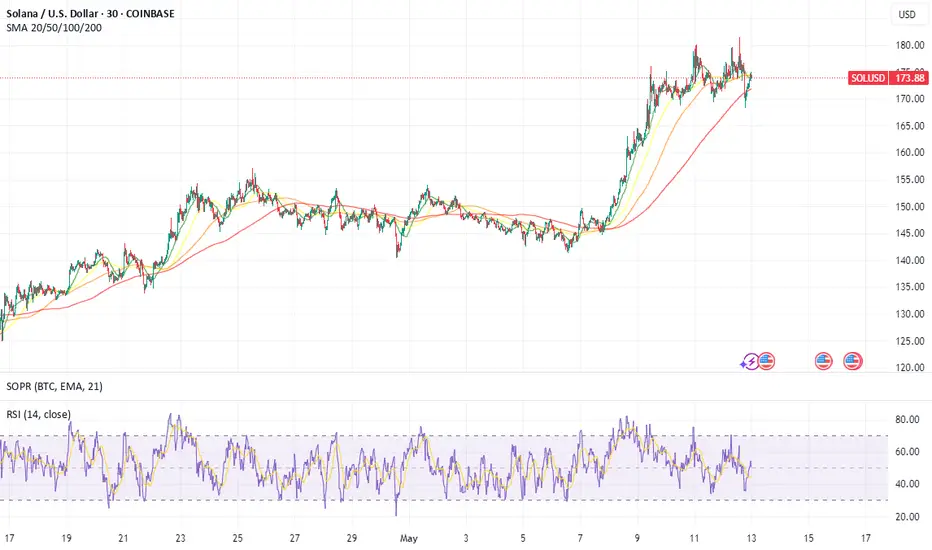
Solana (SOL) Rallies Above $162 Zone: Technical and FundamentalSolana (SOL) Rallies Above $162 Zone: A Technical and Fundamental Analysis of Its Path to $180 and Beyond
Solana (SOL), the high-performance blockchain network known for its lightning-fast transactions and scalable infrastructure, has once again captured the attention of cryptocurrency markets. After a fresh surge above the $162 psychological level, SOL price has entered a consolidation phase near $175, hinting at a potential breakout toward $180 and even $200. This article delves into the technical indicators, fundamental catalysts, and market sentiment driving Solana’s recent rally, while offering a balanced perspective on its short- and long-term prospects.
Technical Analysis: Rising Channel and Key Resistance Levels
1. Recent Price Action and Consolidation Phase
Solana’s price trajectory in recent weeks has been marked by volatility, but the broader trend remains bullish. On , SOL initiated a fresh upward move above the $155 and $162 zones, fueled by renewed investor confidence and macroeconomic tailwinds. The rally, however, faced resistance near $165, causing a temporary pullback.
SOL is trading near $175, consolidating gains after a 22% intraday surge. This consolidation phase aligns with the formation of a short-term rising channel on the hourly chart (data sourced from Kraken), with immediate support at $172. The channel’s upper boundary currently resides near $176, a critical resistance zone that, if breached, could trigger a fresh rally toward $180 and beyond.
2. Key Technical Indicators
• 100-Hourly Simple Moving Average (SMA): SOL price is currently trading below the 100-hour SMA, suggesting short-term bearish sentiment. However, a close above this level could signal a resumption of the uptrend.
• Relative Strength Index (RSI): The RSI on the hourly chart hovers near 50, indicating neutral momentum. A move above 60 would confirm bullish dominance.
• Volume Profile: Recent price spikes have been accompanied by elevated trading volumes, reinforcing the strength of the rally.
3. Bullish Scenario: Breaking $176 and Targeting $180
If Solana successfully clears the $176 resistance, the next immediate target would be the $180 psychological level, which coincides with the 200-day moving average. Analysts note that a sustained close above $180 could open the door to $200, driven by momentum traders and institutional inflows.
4. Bearish Scenario: Support at $172 and $165
Conversely, a breakdown below $172 would invalidate the rising channel pattern, exposing the $165 support zone. Further weakness could retest the $155 level, though this outcome appears less likely given the current bullish momentum.
________________________________________
Fundamental Drivers: 1inch Integration and Memecoin Frenzy
1. 1inch Network Integration: A Catalyst for Growth
One of the key fundamental catalysts behind Solana’s rally is its integration with 1inch Network, a decentralized exchange (DEX) aggregator and liquidity protocol. This partnership enhances Solana’s ecosystem by:
• Improving Liquidity: 1inch’s aggregation algorithms optimize trade execution on Solana-based DEXs, attracting traders and liquidity providers.
• Expanding Use Cases: The integration enables seamless cross-chain swaps, positioning Solana as a hub for multi-chain DeFi activity.
• Boosting Developer Activity: Increased infrastructure support could accelerate the launch of new decentralized applications (dApps) on Solana.
2. Memecoin Surge: The Role of Speculative Capital
Solana has emerged as a preferred platform for memecoin launches, driven by its low transaction fees and high throughput. Projects like SEED_DONKEYDAN_MARKET_CAP:BONK and NASDAQ:WEN have gained viral traction, drawing retail investors and creating a “fear of missing out” (FOMO). This speculative frenzy mirrors Ethereum’s memecoin boom in 2021–2022, with Solana’s faster and cheaper network offering a competitive edge.
3. Institutional and Retail Adoption
• Institutional Interest: Grayscale and other asset managers have added Solana to their crypto investment products, signaling growing institutional confidence.
• Retail Participation: On-chain data reveals a surge in small-cap wallet creations, indicating grassroots retail adoption.
________________________________________
Market Sentiment and Analyst Predictions
1. Bullish Outlook from Analysts
Technical analysts and on-chain experts have highlighted several factors supporting Solana’s bullish case:
• Accumulation by Whales: On-chain analytics firm Santiment reported a spike in large whale transactions, suggesting institutional accumulation.
• Network Activity Metrics: Solana’s daily active addresses and transaction volume have surged to 3-month highs, reflecting heightened network usage.
• Rare Chart Pattern: A “cup-and-handle” pattern on the daily chart implies potential for a 30–40% rally if resistance at $180 is cleared.
2. Skepticism and Risks
Critics argue that Solana’s rally is overextended, citing:
• Overbought RSI on Weekly Charts: The RSI currently resides near 75, signaling overbought conditions that could precede a correction.
• Competitive Pressure: Ethereum’s Layer 2 solutions (e.g., Arbitrum, Optimism) and rivals like Sui and Aptos continue to challenge Solana’s market share.
• Regulatory Risks: The SEC’s ongoing crackdown on crypto exchanges and tokens could dampen investor sentiment across the sector.
________________________________________
Future Projections: Path to $200 and Beyond
1. Short-Term Target: $180–$200
If Solana sustains its rally above $176, the next resistance zones to monitor are:
• $180: Psychological barrier and 200-day SMA.
• $190: Fibonacci extension level from the recent rally.
• $200: Historical resistance-turned-support from late 2023.
2. Long-Term Potential: $300+ in Q4 2024
Bullish scenarios envision SOL reaching $250–$300 by year-end, driven by:
• Spot SOL ETF Approvals: Regulatory greenlights in the U.S. could unlock billions in institutional inflows.
• AI and Web3 Integration: Solana’s partnership with AI projects (e.g., ChatGPT integration on Solana-based apps) could drive mainstream adoption.
• Bitcoin’s Bull Run: A broader crypto market rally, spurred by Bitcoin’s potential breakout above $80,000, would likely lift Solana’s price.
________________________________________
Risks and Challenges
1. Market-Wide Volatility
Cryptocurrencies remain highly correlated with macroeconomic factors, including U.S. interest rates and equity market performance. A sudden Federal Reserve pivot toward hawkish policy or a stock market crash could trigger a sector-wide sell-off.
2. Network Downtime and Security Risks
Solana has experienced periodic network outages and congestion during high demand. While the team has addressed these issues through upgrades, any future disruptions could erode trust.
3. Regulatory Uncertainty
The SEC’s classification of SOL as a security (vs. commodity) remains unresolved. Adverse regulatory rulings could impose restrictions on trading and staking.
________________________________________
Conclusion: Is Solana a Buy Ahead of the Next Leg Up?
Solana’s recent rally above $162 and consolidation near $175 underscores its resilience and growing appeal among traders and developers. Technical indicators, coupled with fundamental catalysts like 1inch integration and memecoin adoption, paint a bullish picture for SOL’s trajectory toward $180 and $200. However, investors must remain cautious of overbought conditions, competitive pressures, and regulatory risks.
For those considering exposure, a dollar-cost averaging (DCA) strategy could mitigate volatility risks, while close monitoring of on-chain metrics and macroeconomic trends will be critical. As with all investments in crypto, thorough research and risk management are paramount.
Disclaimer: This article is for informational purposes only and does not constitute financial advice. Cryptocurrency markets are highly volatile and speculative. Always consult a qualified professional before making investment decisions.
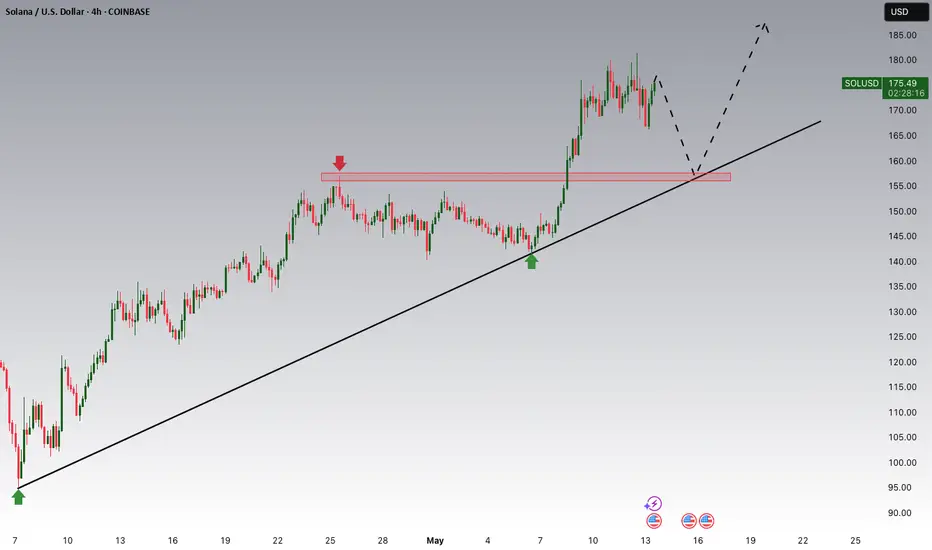
SOL Hits Major Resistance — Patience Over FOMOOne of the most common mistakes traders make—especially in fast-moving markets—is jumping into trades impulsively at major resistance. It feels exciting when price is surging, but ironically, this is often where risk is highest and reward is most limited.
Why? Because historical resistance zones—like the $175–$183 region on SOL—tend to attract heavy sell pressure. These are levels where many past buyers look to exit, where smart money hunts liquidity, and where false breakouts are most common. Without volume confirmation and a proper retest, breakouts through such zones often fail.
That’s why experienced traders wait. The smarter approach is to let the market come to you, and only act when one of two things happens:
A pullback into a well-defined, confluence-rich support zone
A clean breakout above resistance, followed by a retest and confirmation
SOL has respected structure beautifully, but now is not the time to chase. Either wait for a healthy correction into support, or let price prove its strength through a confirmed breakout. No trade is also a trade — and capital preservation is the foundation of long-term success.
Patience isn’t passive — it’s a strategy. Let the market come to your desired levels. You don't need to catch every move, only the high-probability trades and there aren’t born from impulse — they’re built on patience, structure, and right timing. 💎
Technical Breakdown
SOL has entered a major resistance zone between $175 and $183 — a historically significant level respected for over a year.
Within this zone lie two key highs:
$179.85: Recently swept with a clean Swing Failure Pattern (SFP)
$180.52: Still untested — if broken, it would confirm a strong bullish continuation
Breaking through such a well-established resistance on the first attempt is uncommon — it typically requires momentum and structure. A rejection here would suggest that SOL needs a healthy correction before mustering the strength for a true breakout.
📉 Elliott Wave Count
Looking at the structure, we’ve completed a 5-wave sequence — signaling the potential end of this impulse leg. According to Elliott Wave Theory, a corrective phase is now expected before continuation.
📐 Additional Confluence: Fib Speed Fan
The 0.618 Fib Speed Fan — drawn from the all-time high at $295.83 to the swing low at $95.26 — aligns perfectly with this resistance zone, adding more weight to the idea of a potential rejection or pause.
🟢 Long Setup: The Next High-Probability Entry Zone
We now shift our focus to where the next long opportunity could arise. Here’s the technical confluence:
Anchored VWAP from the recent low at $141.41 sits at $164.70
4H bullish order block around $164.46
0.382 Fib retracement of the full 5-wave impulse: $165.42
0.412 Fib retracement: $164.25
All these levels converge in a tight band, providing a solid long entry zone between:
Long Entry Zone: $165.50 to $164.25
Stop-Loss: Below $160 (to protect against any deep wick)
Targets:
TP1: $171.75 (Point of Control from the range)
TP2: $180.00 (resistance retest)
TP3: $200.00 (psychological level)
Estimated R:R: ~6:1 — High-conviction setup
Bonus: If price returns to this $165 zone within 24 hours, it will also be supported by the 0.618 Speed Fan — adding one more layer of support.
🔴 Short Setup: Reversal Play at $200
For those watching from the sidelines or looking to fade the rally, the psychological level at $200 presents a strong short opportunity — but only on confirmation (e.g., SFP or bearish engulfing).
Short Entry: On rejection at $200
Stop-Loss: $206.10
Target: $187.00
Estimated R:R: ~2:1
🧠 Summary:
Completed 5-wave structure → potential correction phase underway
Strong resistance at $175–$183 with SFP and speed fan alignment
High-probability long setup at $165.5–$164.25 with multi-layered confluence
Potential short at $200 on confirmation
⚠️ Key Takeaway: Don’t Chase the Highs
This is where many traders slip — FOMOing into trades at major resistance. Please, don’t do it. Instead, wait for:
A pullback into well-defined support (like the $165 zone), or
A clean breakout above $180, followed by a confirmed retest
____________________________________
If you found this helpful, leave a like and comment below! Got requests for the next technical analysis? Let me know.

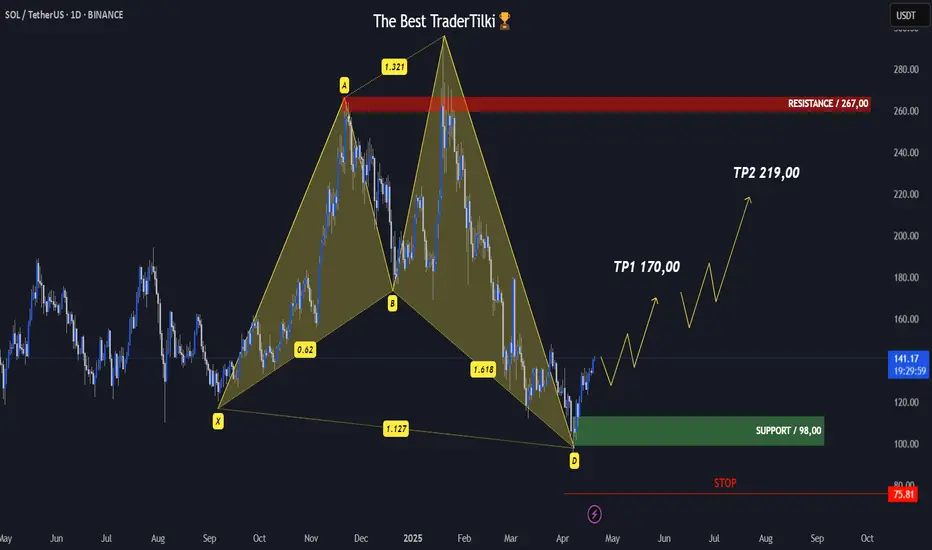
SOLUSDT | 1 DAY | SWING TRADING Hey friends!
I’ve put together a detailed analysis on Solana just for you. The harmonic pattern has completed, and we’ve already seen some strong buying from that exact zone. 📈
Now, I’ve got two targets for you:
🎯 Target 1: 170.00
🎯 Target 2: 219.00
🔴 STOP: 75,81
"Just a heads-up — since this is a swing trade, the target might take some time to hit. Good to keep that in mind."
Remember, the more love and likes I get from you, the more motivated I am to keep sharing these analyses. All I ask is for a simple like to show your support. 💙
Huge thanks to everyone supporting with their likes — I truly appreciate it!
#SOL/USDT#SOL
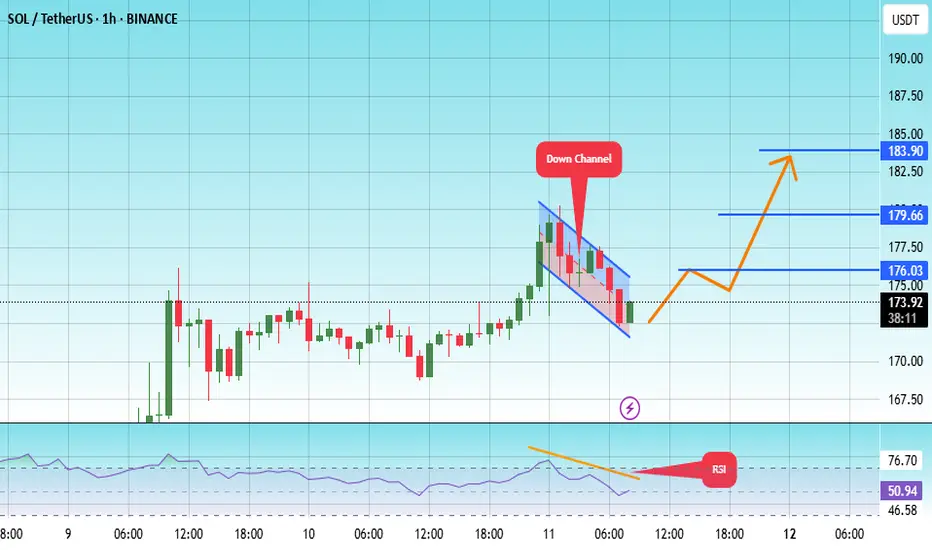
The price is moving within a descending channel on the 1-hour frame, adhering well to it, and is on its way to breaking it strongly upwards and retesting it.
We are seeing a bounce from the lower boundary of the descending channel, this support is at 172.
We have a downtrend on the RSI indicator that is about to break and retest, which supports the upward trend.
We are looking for stability above the 100 moving average.
Entry price: 173
First target: 176
Second target: 180
Third target: 183
$SOL just confirmed a perfect cup & handle breakout near $176.SOLANA: Best Setup Alert 🚨
CRYPTOCAP:SOL just confirmed a perfect cup & handle breakout near $176.
If history repeats, this could be the start of a massive rally.
Targeting $350–$500+ in the coming months.
Don’t sleep on this. ⚡📈

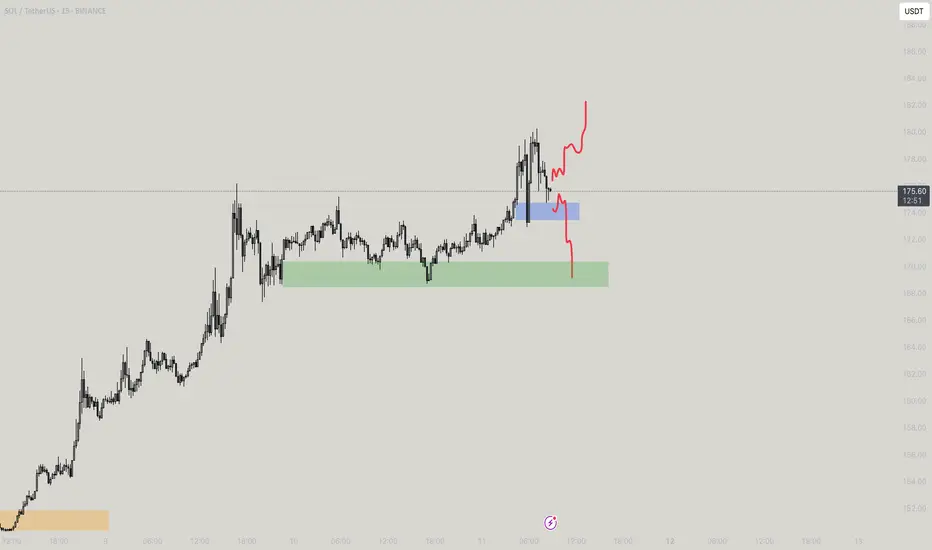
SOUL for a SOL - Part 1Hey Guys! This is M-Prof of SOL
The 4H SVP chart of SOL/USDT shows a clean bullish continuation with strong volume acceptance at higher levels. After consolidating around the $166–$170 range where the POC and VAL stacked tightly, Solana broke out impulsively, forming a fresh profile with value clearly migrating higher. The new POC and VAH are now centered near $174–$176, confirming that buyers are comfortably accepting higher prices. The thin tail below $171 shows rejection of lower prices, suggesting a strong demand zone now sits between $171 and $173. As long as SOL holds above this value area, any dip into that range offers a good risk-reward long opportunity. If the price accepts above $176.5, it could trigger further upside targeting $180+. Bias remains bullish above $171.
Coming to my doodle - Breaking the blue box would drag to the green one, changing structure though the latter towards the top is most probable!
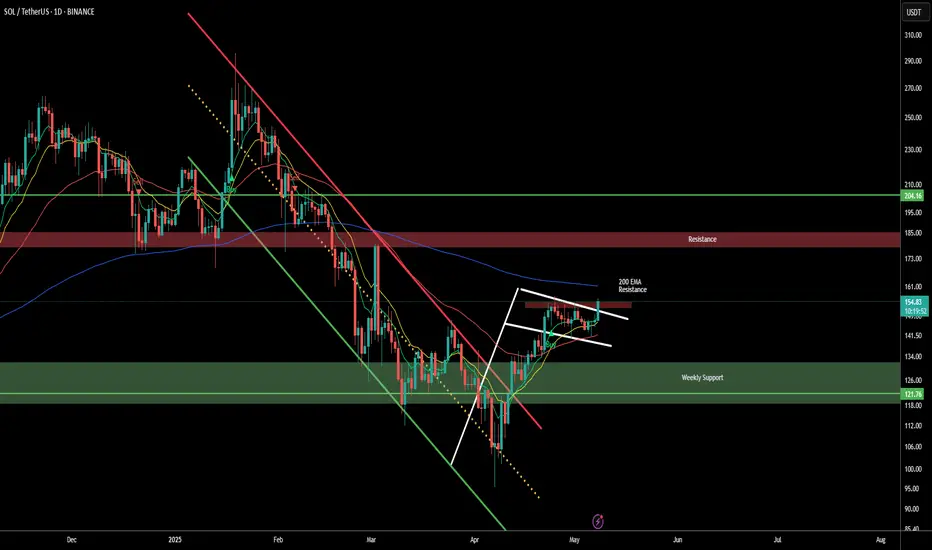
SOLUSDT – Bullish Flag Below 200 EMA | Breakout Coming?SOL broke out of the bearish trendline and flipped to a bullish structure. Since then, a bullish flag has formed in the daily timeframe.
The price is now just below the 200 EMA, which is acting as resistance. A clean breakout above this level could trigger the next leg up.
Dynamic EMA Crossing Indicator– which flashed a Buy signal recently, giving more confidence to the bullish setup.
If the flag breaks out and the price clears the 200 EMA, the next target is around the 180 zone (resistance).
#SOL Don't worry until 240 $.but after that, 60 $ is coming.#SOL Don't worry until 240 $.but after that, 60 $ is coming.
#SOL Crash. We already warned when SOL is Trading above 240 $ ..
Past Analysis also attached.

#SOL/USDT#SOL
The price is moving within a descending channel on the 1-hour frame, adhering well to it, and is on its way to breaking it strongly upwards and retesting it.
We are seeing a bounce from the lower boundary of the descending channel, this support is at 144.
We have a downtrend on the RSI indicator that is about to break and retest, which supports the upward trend.
We are looking for stability above the 100 moving average.
Entry price: 149
First target: 153
Second target: 156
Third target: 161

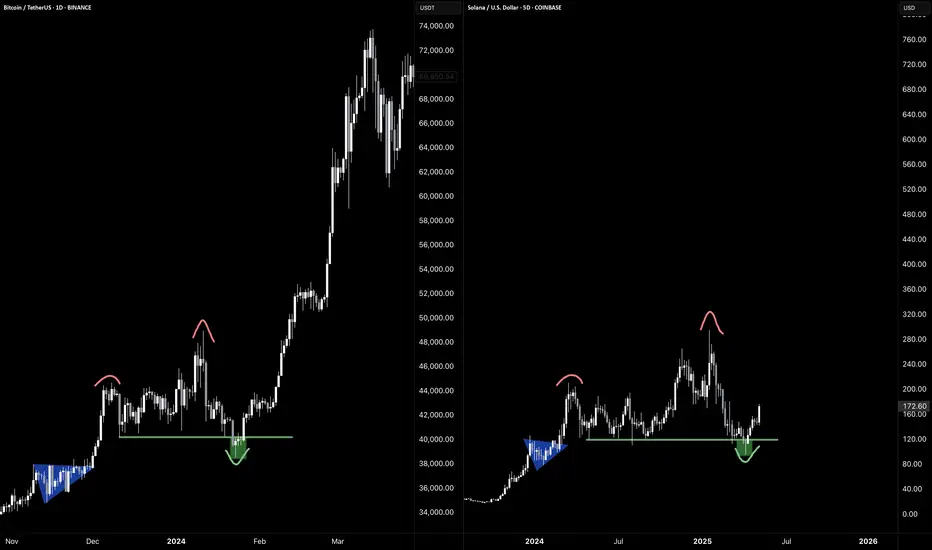
$SOL - Long FractalCRYPTOCAP:SOL Fractal compared with CRYPTOCAP:BTC from 2024.
Do not fade Solana.
My top pick this cycle.
-@CryptoCurb
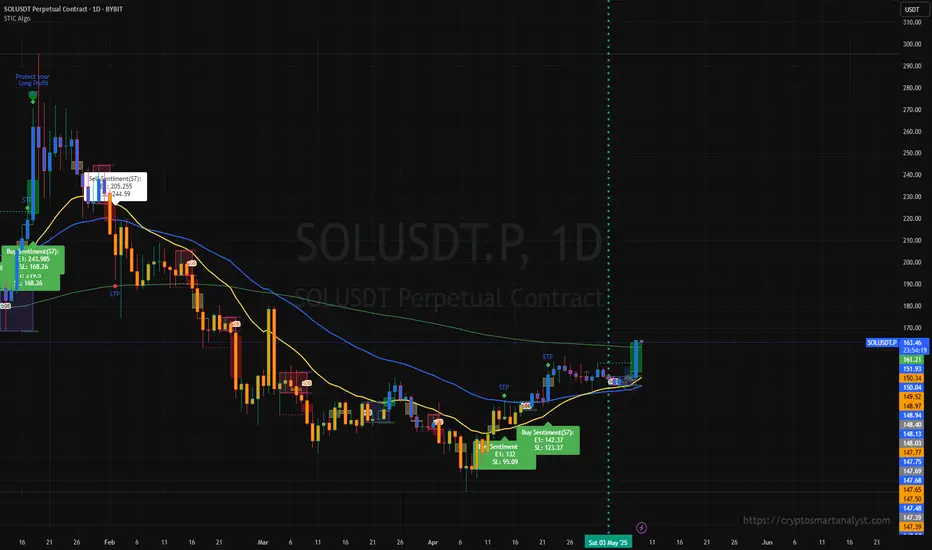
SOL breakout?Trading SOL on LTF was a good scalp; coming to the HTF, now this is looking good
Price action is still at exponential resistance, though. Fingercrossed, the bulls hold strong
Using STIC, i'm still bullish till otherwise.
#Tradesmartly