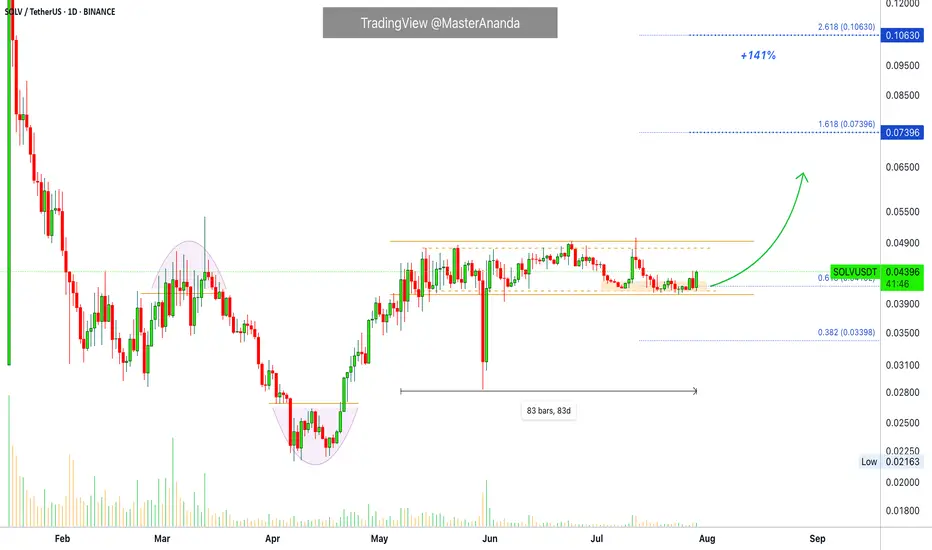
Solv Protocol · Bitcoin Staking · 140% Profits PotentialSolv Protocol has been sideways for 83 days, and it looks ready to rise. The market bottomed in April and afterward has been bullish ever since. It is nice to see how tight the trading range is.
This chart pattern is not very common. When a pair has a chart drawing that is not seen often, it means that it can move differently to others. It can go down while others are going up, but it can also go up while others go down.
The action is happening near the lower boundary of the range, perfect to buy as the action happens near support. When at resistance we can expect a drop; at support, a rise. And here SOLVUSDT seems eager to start rising.
With a close today above 0.04411, we get a strong signal for additional growth. The breakout can happen within a few days but the trend that follows can last for months. Catching the breakout can be nice and fun. Sometimes they reverse though to grow only after a few weeks.
Namaste.
SOLV
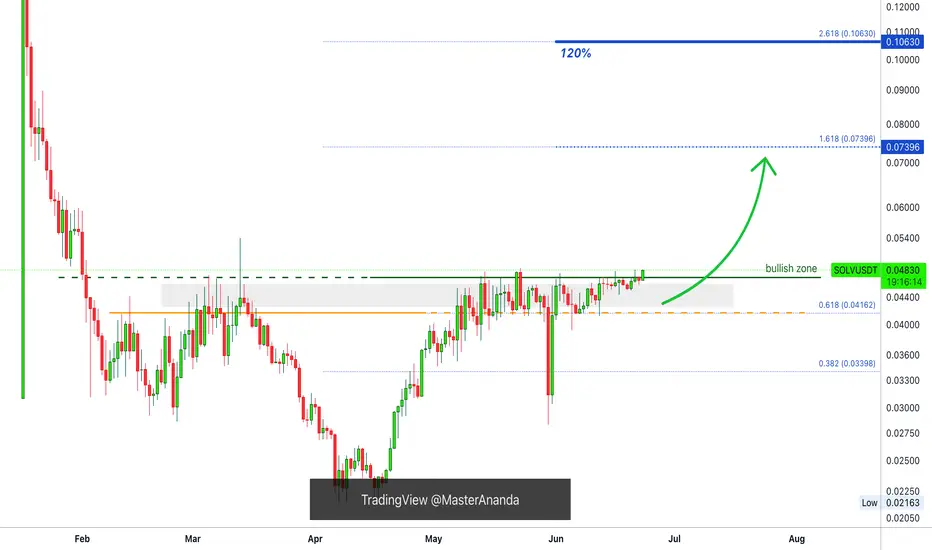
Solv Protocol Conquers Resistance, Easy 120%SOLVUSDT has been creeping higher slowly. It has been challenging resistance for weeks and finally, just today, the major resistance level on this chart breaks. It has been conquered.
SOLVUSDT is now in bullish territory and moving higher. The way I see it goes something like this: There will be a small time window for SOLV to develop bullish force. As soon as prices move higher, just a bit higher, say above 0.05000, bullish momentum will grow and there will be a major jump. The 120% target on the chart is intended for the short-term and should be an easy one.
This is another good chart for short-term profits. Everything altcoins will do great in the coming weeks and days. If you waited patiently, you will be rewarded. If you held through the final shakeout and market flush, you are about to get paid for doing a good job. You deserve all the best and more.
Thanks a lot for your continued support.
Namaste.
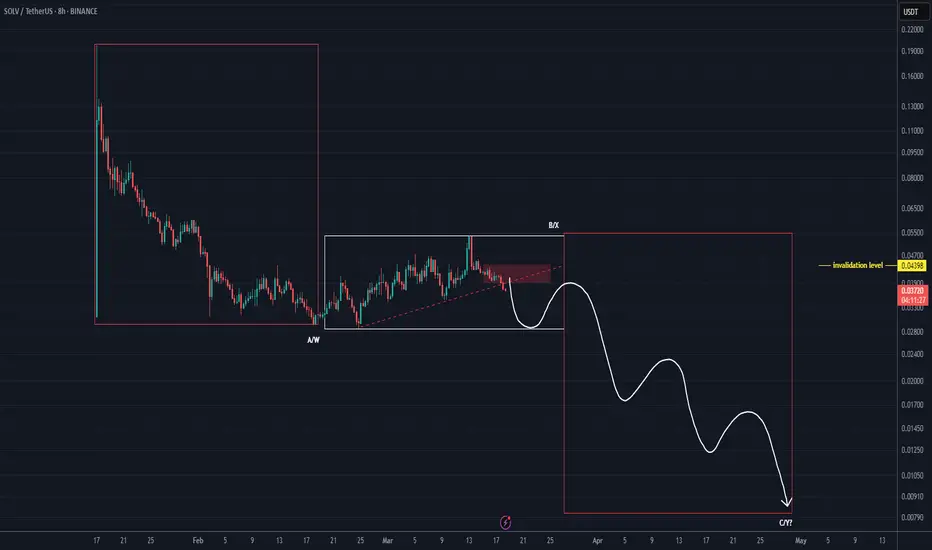
SOLV Looks Bearish (8H)SOLV appears to be completing an ABC or WXY pattern.
Recently, it lost a trendline, which is a significant bearish signal.
If it loses the white box, it could enter a heavy drop phase.
A daily candle closing above the invalidation level will invalidate this analysis.
For risk management, please don't forget stop loss and capital management
Comment if you have any questions
Thank You
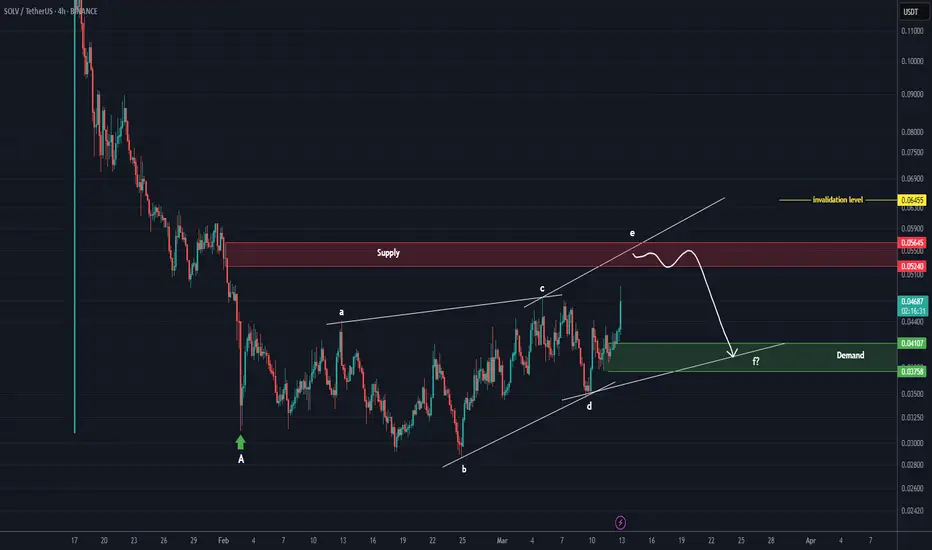
Will SOLV pump more? (4H)It seems that a wave A has completed, and wave B has started from the point where we placed the green arrow on the chart.
This wave appears to be a diametric, and we are currently in its wave e.
The red zone is a supply zone that is fresh and untouched. This zone could complete wave e of B, leading us into wave f of B.
A daily candle closing above the invalidation level will invalidate this analysis.
For risk management, please don't forget stop loss and capital management
Comment if you have any questions
Thank You