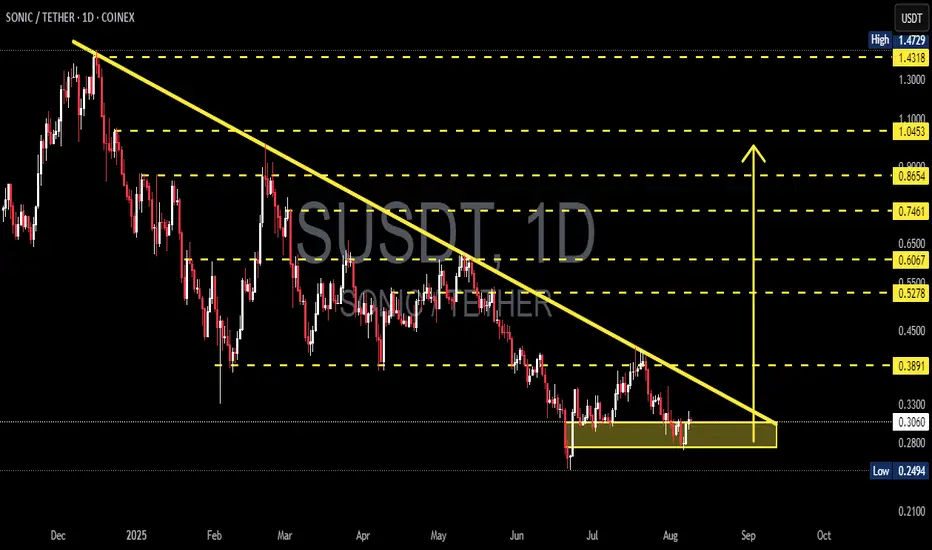
SONIC/USDT — Descending Triangle at Key Support!Overview
The daily chart shows a clear medium-term downtrend (well-defined descending trendline) meeting a strong horizontal support zone around 0.25–0.31 USDT (yellow box). Current price ≈ 0.3059 USDT. This structure forms a descending triangle or accumulation range, signaling that the market is in a decision phase — either a bullish breakout or a bearish continuation.
---
Key Levels
Current Price: 0.3059
Support Zone: 0.2494 – 0.305 (historical low at 0.2494)
Descending Trendline Resistance: ~0.33–0.35 (dynamic)
Next Resistances: 0.3891, 0.5278, 0.6067, 0.7461, 0.8654, 1.0453
Breakdown Measured Target: ~0.11 (if 0.2494 breaks)
Potential % moves from current price:
To 0.3891 ≈ +27.2%
To 0.5278 ≈ +72.5%
To 0.2494 ≈ −18.5%
To 0.11 ≈ −64%
---
Pattern & Interpretation
Main Pattern: Descending trendline + horizontal support = descending triangle (bearish bias unless broken to the upside).
Bearish Signal: Lower highs structure, price still under the descending trendline, supply pressure dominant. A daily close below 0.2494 with high volume = breakdown confirmation.
Bullish Signal: Daily close above the trendline (~0.33–0.35) with strong volume, followed by a successful retest = breakout confirmation. Extra confirmation if price breaks and holds above 0.3891.
---
Scenarios
Bullish
1. Break & daily close above trendline (~0.33–0.35) with rising volume.
2. Retest holds as support.
3. Targets: 0.3891 (+~27%), then 0.5278 (+~72%).
4. Stop-loss: below support box (~0.28 or safer < 0.2494).
Bearish
1. Daily close below 0.2494 with strong volume = breakdown.
2. Measured move target ≈ 0.11.
3. Conservative target: psychological zones 0.18–0.15.
4. Stop-loss for shorts: above 0.305–0.33.
---
Trading Notes
Conservative Long: Wait for breakout & retest above trendline.
Aggressive Long: Enter near support (0.26–0.30) with tight stop below 0.2494.
Short: Only after confirmed breakdown below 0.2494.
Always watch daily close + volume to avoid false signals.
---
Conclusion
Current trend is bearish, but the strong 0.25–0.31 support keeps the possibility of a short-term rebound alive.
Decision point: Breakout above 0.35 → bullish rally, Breakdown below 0.2494 → extended sell-off.
Risk management is key — use stop-losses and position sizing.
#SONIC #SONICUSDT #CryptoAnalysis #SupportResistance #DescendingTriangle #Breakout #Altcoin #RiskManagement
Sonicusdc
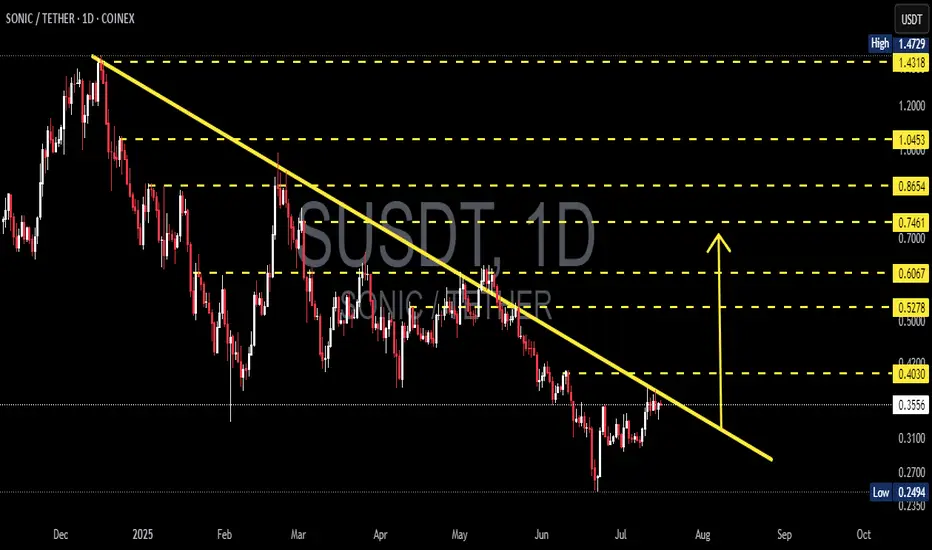
SONIC/USDT Breakout in Progress? Watch This Critical Level Close🧠 Technical Breakdown – Daily Chart (1D, Coinex)
The SONIC/USDT pair is currently exhibiting a textbook descending trendline breakout setup, formed over the past 7+ months. This long-term downtrend has been respected since late November 2024, connecting multiple lower highs and establishing a well-defined bearish structure.
However, recent price action shows a potential trend reversal as the pair consolidates tightly near the apex of the structure, with signs of breakout momentum building.
📐 Pattern Identification:
✅ Falling Wedge / Descending Triangle
✅ Continuous lower highs connected by a descending trendline
✅ Support held above $0.25 (strong demand zone)
✅ Price now testing the upper boundary of the trendline
This is a classic bullish reversal pattern—especially when price breaks out after long-term compression.
🚀 Bullish Scenario:
Should SONIC successfully break and close above the $0.4030 level (trendline + horizontal resistance), it could unlock a wave of bullish momentum. Here are the key upside targets based on Fibonacci retracement from the previous high ($1.4729) to the local low ($0.2494):
🎯 Resistance Level Significance
$0.5278 0.382 Fib – First major target post-breakout
$0.6067 Key confluence level – psychological barrier
$0.7461 0.618 Fib – Bullish continuation zone
$0.8654 High momentum extension
$1.0453 0.786 Fib – Reversal confirmation
$1.4318 Retest of the all-time high
If volume supports the breakout, we could see a sharp move toward these zones.
🧨 Bearish Scenario:
If price fails to break out and gets rejected from the trendline:
It could retrace back toward $0.3100 and $0.2700
A daily close below $0.2494 (previous low) would invalidate the bullish setup, signaling potential continuation of the downtrend
Traders should monitor RSI divergence and volume drop as warning signs
📌 Why This Setup Matters:
This is not just a short-term play. A successful breakout here signals the end of a multi-month downtrend and the potential start of a new macro uptrend. SONIC has been heavily compressed — and the tighter the coil, the bigger the move.
Smart money often enters before the breakout confirmation. Monitor for volume surges, candle structure changes, and key breakout retests.
✅ Summary:
🔄 Trendline breakout imminent
🟢 Watch for breakout confirmation above $0.4030
🔴 Breakdown below $0.2494 invalidates the bullish thesis
🧭 Fibonacci levels offer reliable target zones for profit-taking
This is a critical make-or-break zone for SONIC/USDT. Traders, be ready.
#SONICUSDT #BreakoutSetup #AltcoinAlert #CryptoAnalysis #TrendReversal #TechnicalAnalysis #CryptoTA #Altseason #FibonacciLevels #PriceAction
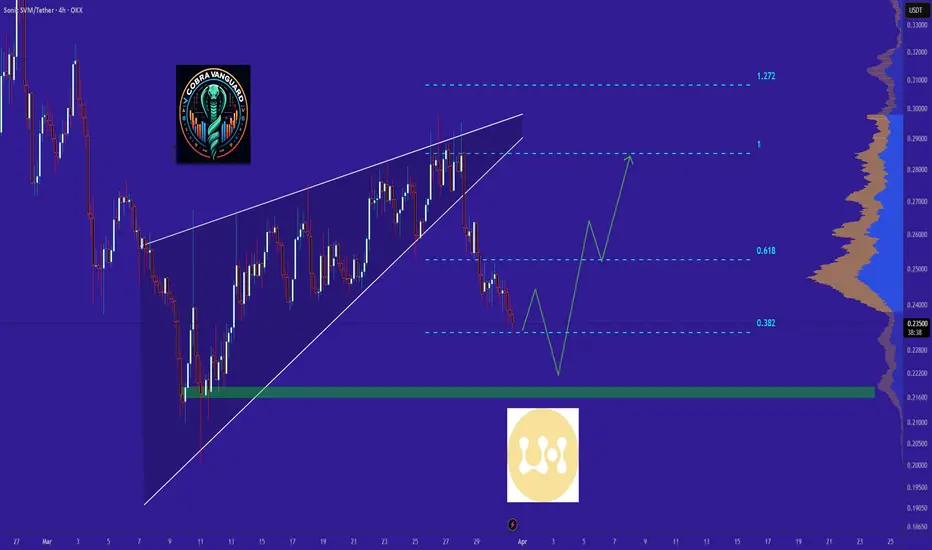
Sonic pull back - opportunity comingSonic - are we going for a deep pullback?!
If so...
We have confluence for a bonce - MA 200 (4h), Fib 0.618, Diagonal trendline.
I think Sonic cold respond nicely in the area 0.324-0.332 and after that move on for higher target (0.4).

SUSDT 1D AnalysisS ~ 1D Analysis
#S Buy back gradually from here if you still have confidence in this coin with a short term target of at least 15%+ from here.
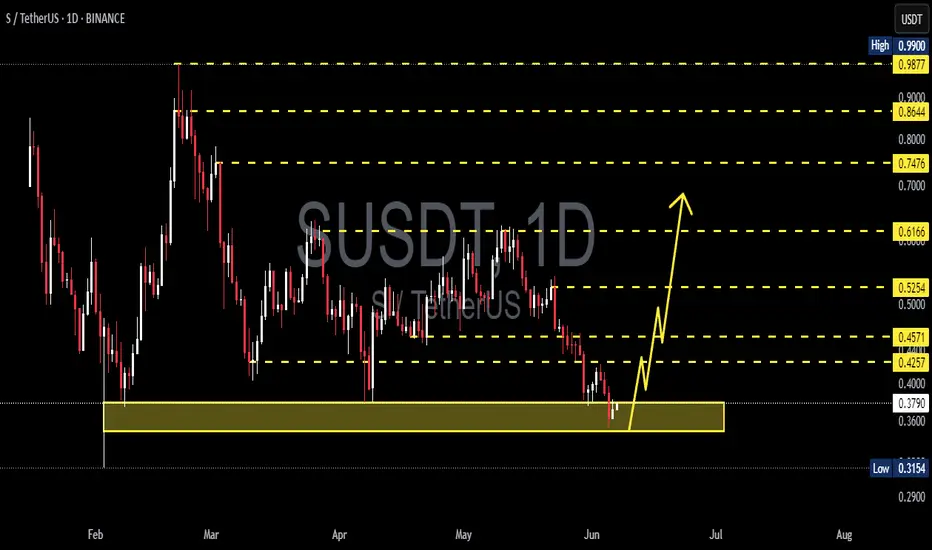
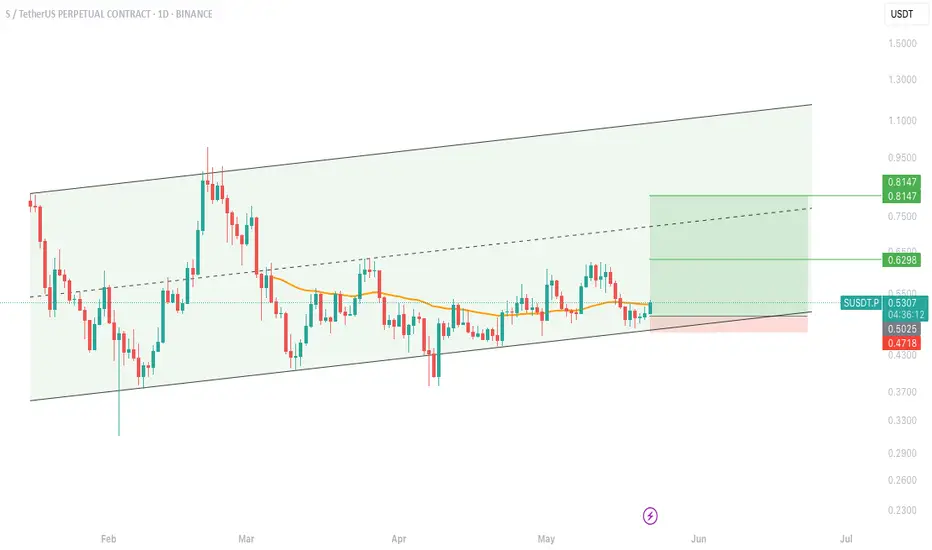
Long Trade set-up SUSDT:SonicUSDT: A clean bounce from the lower trendline of the ascending channel is showing strength! 📈
We’re seeing price reclaim the EMA support with strong structure holding.
🎯 Targets ahead:
• TP1: $0.6298
• TP2: $0.8147
🔒 SL below: $0.4718
Risk-managed and technically sound setup.
✅ Keep this one on your radar — or jump in if price retests near entry!
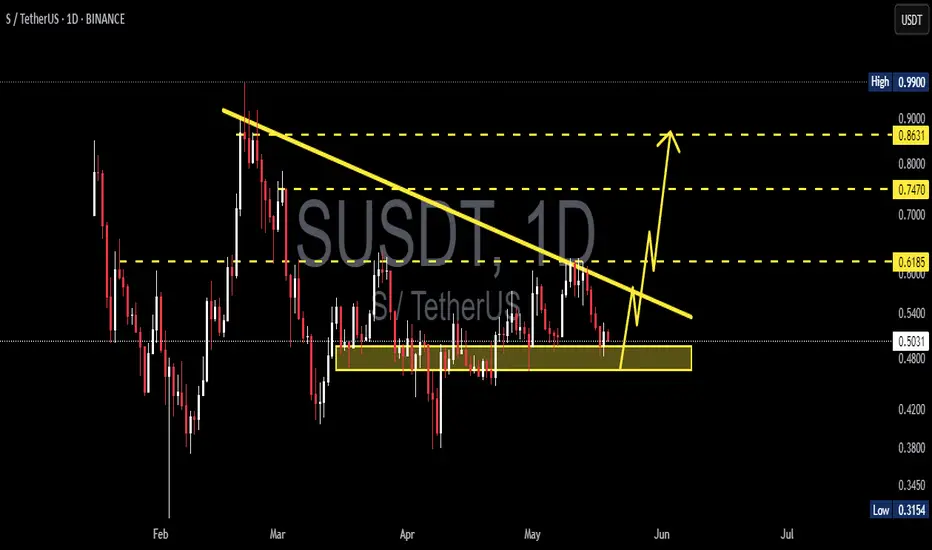
SONICUSDT 1D Analisis S / SET:SONIC ~ 1D Analisis
#S / #SONIC Buy gradually from here if you still have confidence in this coin with a short term target of at least 10%+ From here.
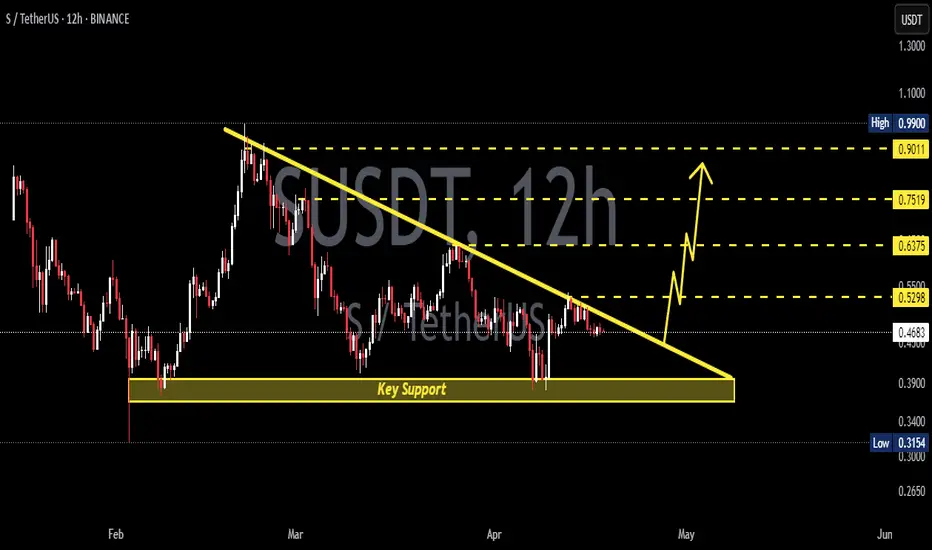
SONICUSDT 12HS / SET:SONIC ~ 12H Analysis
#S / #SONIC Buy after successfully penetrating this resistant line with a short -term target of at least 10%+ from here.
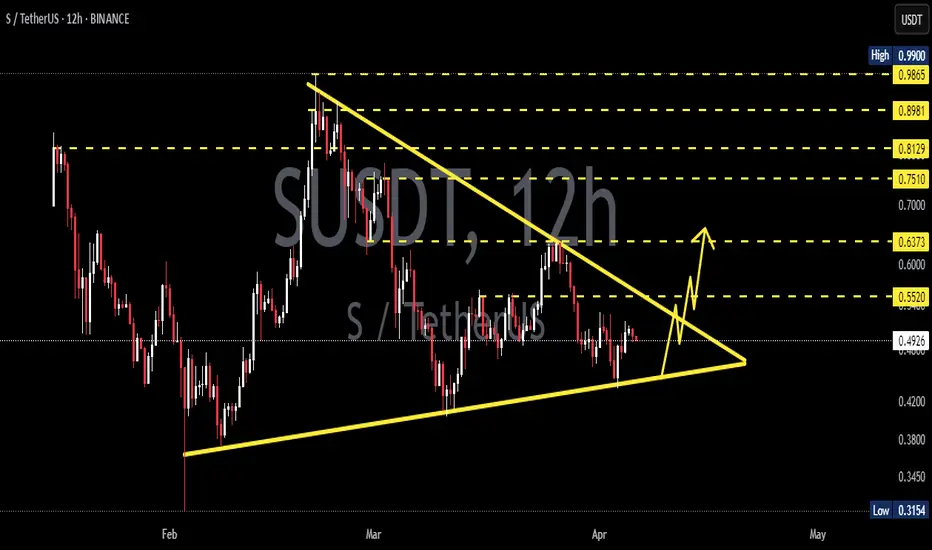
SUSDT 12HS ~ 12H Analysis
#S Buy gradually from here if you still have a Conviction on this coin with a short -term target of at least 10%+.
Be careful with SONIC !!!Finally, the price broke the wedge, and the price experienced a significant drop. I think now is the time for SONIC to rise again to 0.27 . STRONG SUPPORT 0.382=0.21 TO 0.23.
Give me some energy !!
✨We spend hours finding potential opportunities and writing useful ideas, we would be happy if you support us.
Best regards CobraVanguard.💚
_ _ _ _ __ _ _ _ _ _ _ _ _ _ _ _ _ _ _ _ _ _ _ _ _ _ _ _ _ _ _ _
✅Thank you, and for more ideas, hit ❤️Like❤️ and 🌟Follow🌟!
⚠️Things can change...
The markets are always changing and even with all these signals, the market changes tend to be strong and fast!!