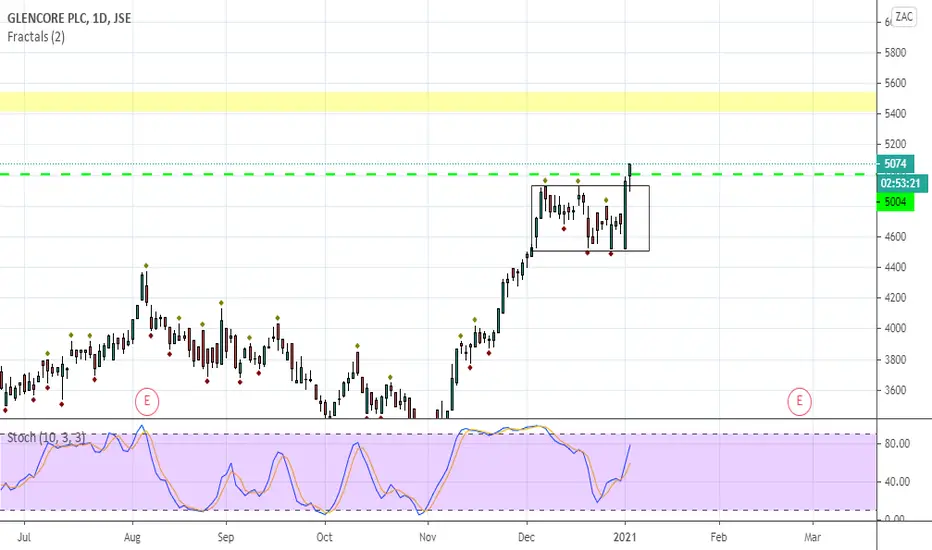
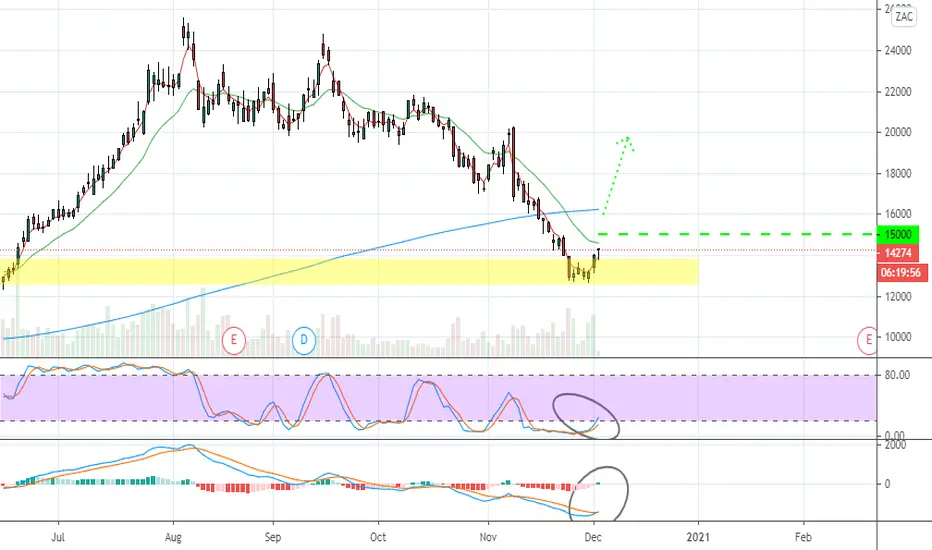
GLN - Broken through consolidation areaJSE:GLN has been trading in a somewhat sideways consolidation area since 3 December and with yesterday's large upward candle it has broken through the top as well as the 5000 level - this level is a strong level on the daily as well as the monthly chart and acts as a strong psychological level due to the round number. I think we could see a nice upward move from here possibly to at least around the resistance level between 5400 and 5500.
Southafrica
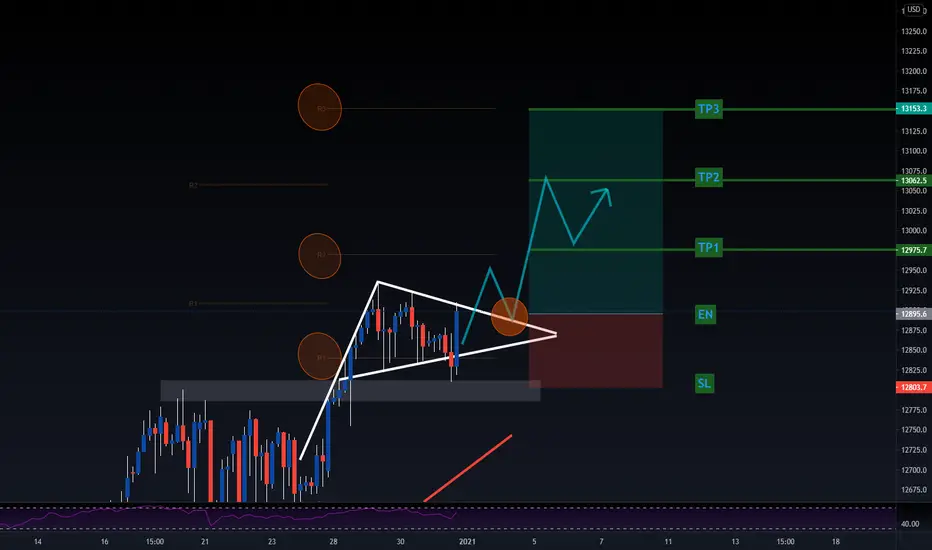
NASDAQ100/ US100 SIGNAL -BUY AT BREAK AND RETEST OF BULLISH FLAGTOPDOWN ANALYSIS: Shows Monthly uptrend and BULLISH FLAG PATTERN
ACTION PLAN: 1.) Wait for price to show a break above flag pattern and retest (then enter with a buy)
2.)As soon as market hits a 1:1 risk reward = move stop-loss to breakeven (as we near pivot point resistance) (capital preservation is key)
MAGIC IF: 1.)If market breaks downward with large momentum candles, might be a false breakout (therefore wait for a break in the flag and follow break and retest strategy)
Reasons/ Confluences:
.Clear strong uptrend since April 2020
.RSI Indicator not above the 80 upper band
.Pivots are still bullish and give clear markers for potential price targets (R1, R2, R3)
.Fundamental news showing bullish - as we get closer to containing the pandemic (vaccines e.t.c)
TIPS:
.Stocks are known for whiplash and false breakouts - therefore only take a trade when clear signs indicate an opportunity (in this case a break and retest and possible long wick rejection)
.Nasdaq is expected to rise so any sell opportunity will be short term (selling will also be against market long term trend)
.Make sure to look at the R1, R2, R3 pivot point lines - as price may bounce or consolidate on them
....................... !!! DONT FORGET TO LIKE AND SUBSCRIBE TO OUR CHANNEL FOR MORE FREE SIGNALS AND TURORIALS !!! ............................
GOLD IDEAHappy New Year .Thank you for your support. Here is my analysis on GOLD/XAUUSD .I hope it will help you to catch profitable trades (as always).
Please continue to like, share and comment.
NASDAQ ANALYSISHappy New Year .Thank you for your support. Here is my analysis on Nasdaq .I hope it will help you to catch profitable trades (as always).
Please continue to like, share and comment.
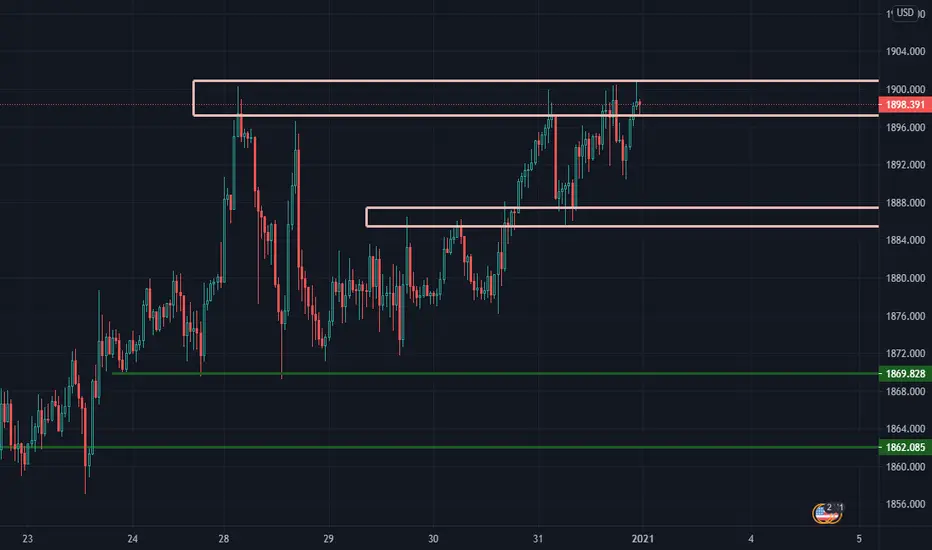
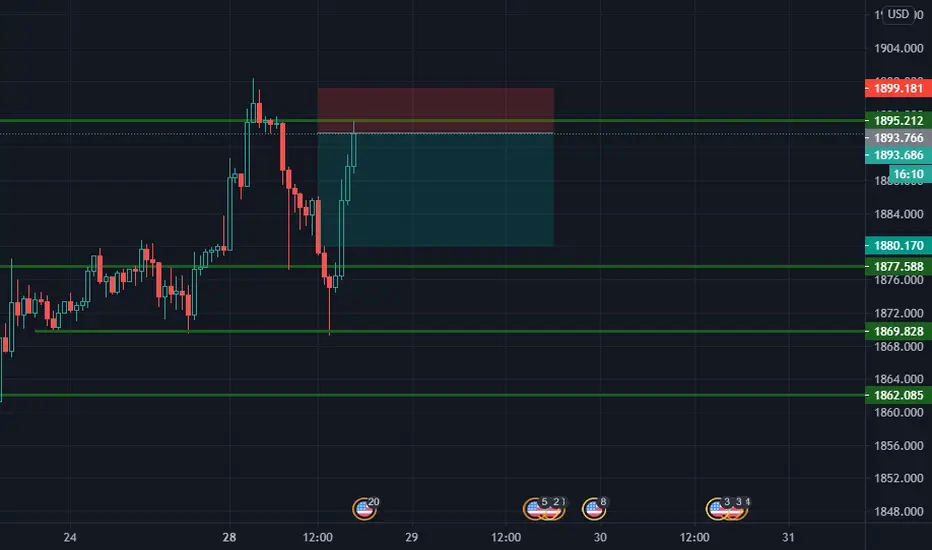
GOLD/XAUUSD SELL SIGNAL We are currently selling gold on the 45 min chart and we are looking to take profit @1880.00
Please like share and comment for more signals.
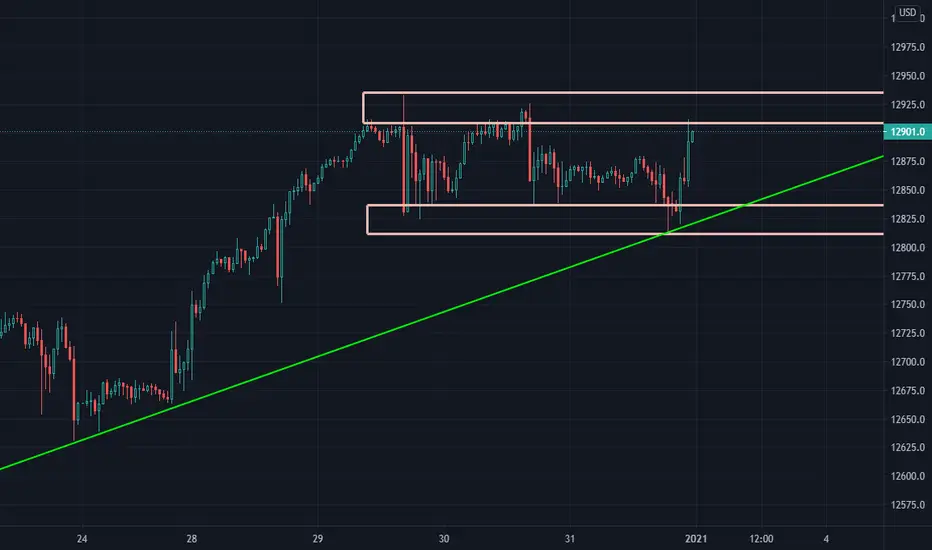
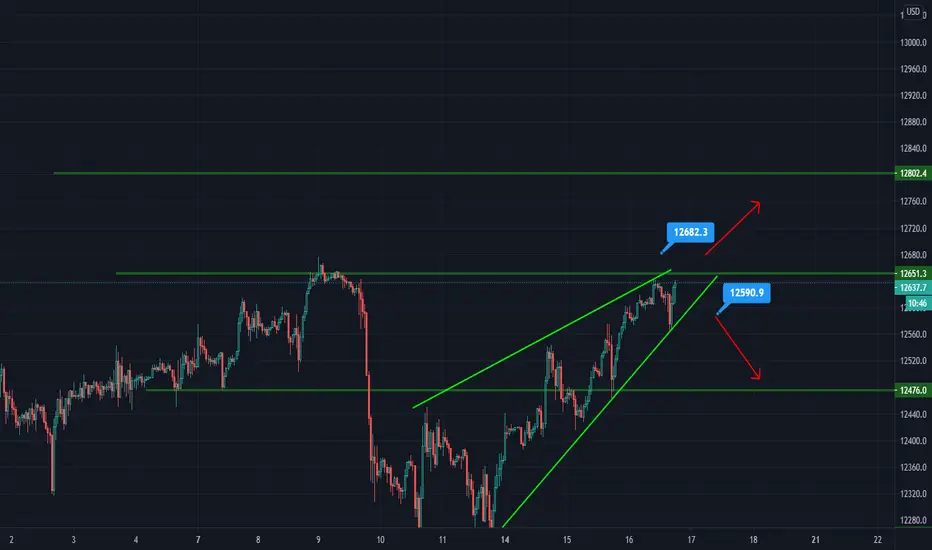
NAS100 /NASDAQ SIGNAL We will take trades when the 45HR candlestick breaks out in either way. Buy or Sell at highlighted prices .
BUY TP:12760.0
SELL TP:12476.0
Please LIKE, COMMENT AND FOLLOW FOR MORE CONTENT.#6ixpips
Possible reversal on GoldfieldsJSE:GFI has bounced off of a support level and looks like a upward move is a possibility. The stochastic and MACD are confirming this momentum. If the price moves up above the 15000 level I will consider a long position. Beware that it might find some resistance on the 200SMA, so if it breaks through that, it further confirms the move.
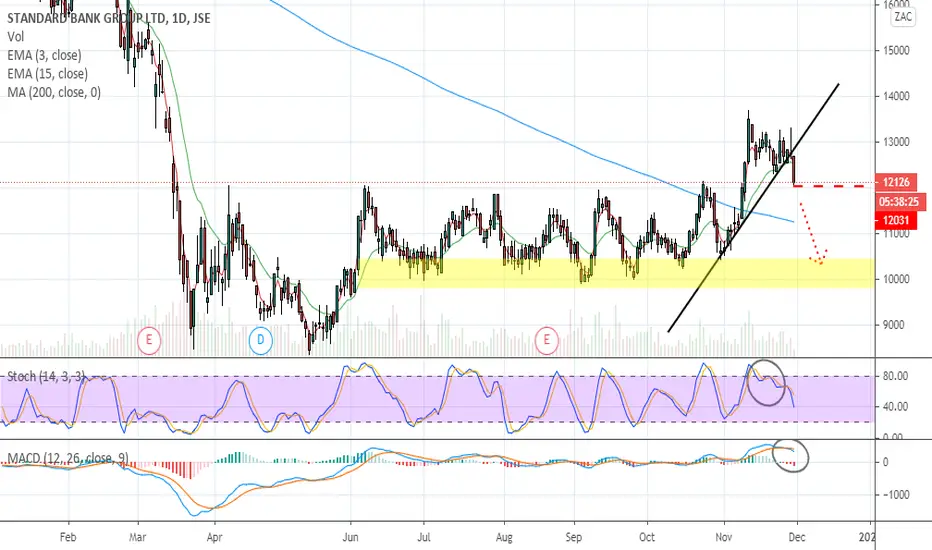
SBK - gaining downward momentumJSE:SBK has broken through an upward trendline that it has been obeying since end of October. Today's price action is showing some strong downward momentum. The stochastic and the MACD have also crossed downwards, confirming the signal for a short position.
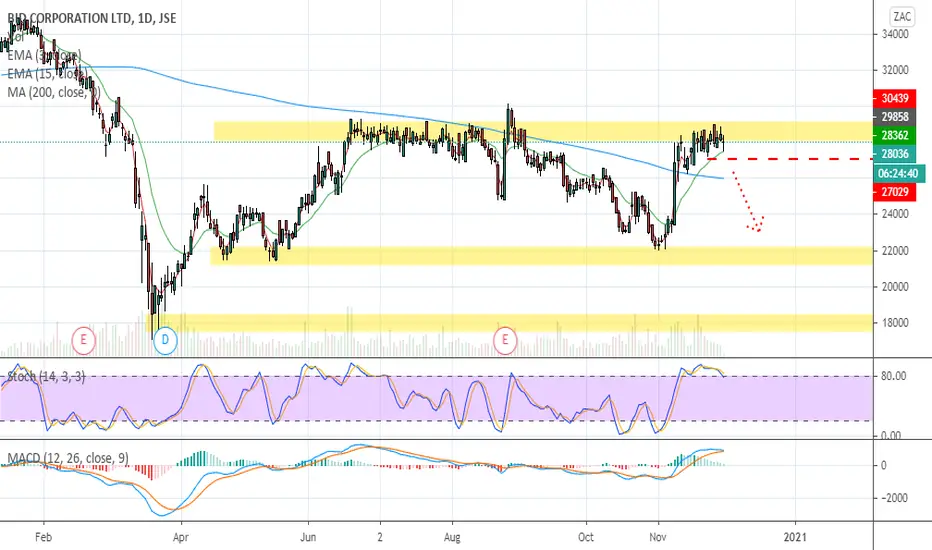
BID - potential loss of upward momentumJSE:BID is bouncing off a strong resistance level and is struggling to break higher. If it trades lower than 27000, I will consider a short position as the stochastic and the MACD are showing signs of a momentum change. If it trades lower, the two EMA's will also have crossed downwards signaling a momentum change.
AFRICAN RAINBOW CAP INV. Possible long opportunity coming.AIL offers disruptive banking solutions in South Africa.
With such a strong monthly downtrend, we will need some sideways consolidation in this range, in order for us to change the trend and ultimately move higher.
Given the current economic climate in emerging markets, this is one that I am putting on my watchlist.
If we were to see further consolidation at these level, while still holding support as seen on the chart. 220-225 range. We would then look for some expansion to the upside. that being said, a push in the fintech sector might break through some resitance levels, in which case we will look to get involved on a pullback.
** this would be a longer term play and one that needs some more time to play out. I will update as we progress.
Cup & Handle on MTNA Cup and Handle pattern has formed on JSE:MTN .
The Cup with Handle is a bullish continuation pattern and as its name implies, there are two parts to the pattern: the cup and the handle. The cup forms after an advance and looks like a bowl or rounding bottom. As the cup is completed, a trading range develops on the right-hand side and the handle is formed. A subsequent breakout from the handle's trading range signals a continuation of the prior advance.
I will look to enter long if it breaks above the high of 11 Nov with a optimistic target at the resistance around the 8800 level.

Bearish engulfing candle at resistance.After a few doji candles, JSE:MTN has developed a bearish engulfing candle at a resistance level. This is the sign of a possible reversal. I will keep an eye on this and if it breaks lower, I will consider a short position taking it all the way to either the 200SMA or the support level at around 5500.

SOL - Break above resistance could mean upward moveA small inverted head & shoulders pattern has formed on JSE:SOL in the recent past, but it is yet to make any significant upward move because of it. It came up and tested a strong resistance level on the 10th of Nov and then retraced back down. If it comes up again and breaks through that resistance line convincingly, I will consider entering a long position.

Possible short on CAPITECJSE:CPI is showing signs that it may retrace downwards for a bit before continuing up. The MACD and Stochastic are both showing downward momentum and if it trades lower than today, the EMA's will confirm a downward cross. Keep an eye on this one for a possible short move to around the 200 SMA support level.

Clicks downward momentumJSE:CLS has reached a level of resistance and is showing some downward momentum. The stochastic and MACD has both crossed downwards and the 2 EMA's have confirmed this momentum. I will look to go short if it trades lower.


OMU Bouncing of 200SMA with downward momentumJSE:OMU has found some resistance at the 200 Moving Average and could be heading for a downward move. The stochastic and the MACD are both starting to confirm this downward momentum.

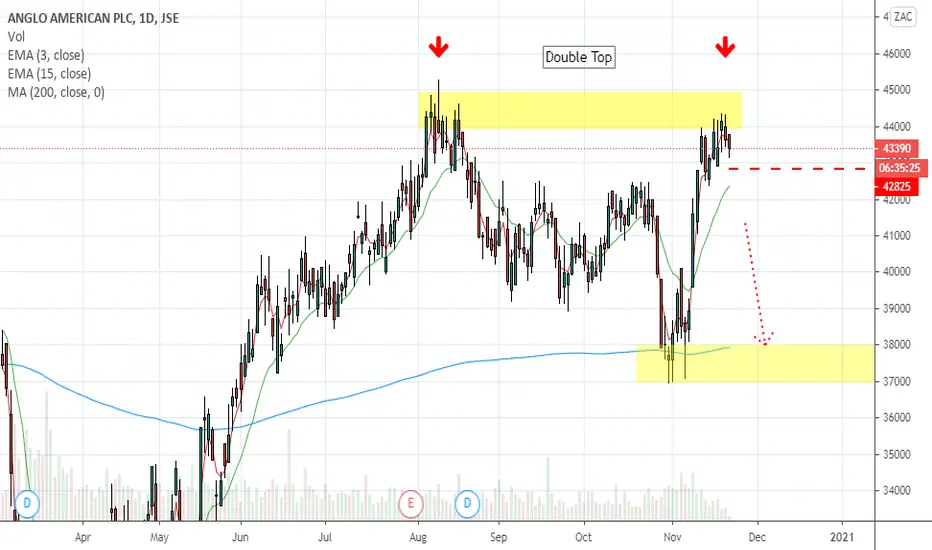
AGL - Double TopA double top has formed on JSE:AGL . I'll keep an eye on this for one for a break below 43000. If it confirms, we could be looking at a downward move for a short position.
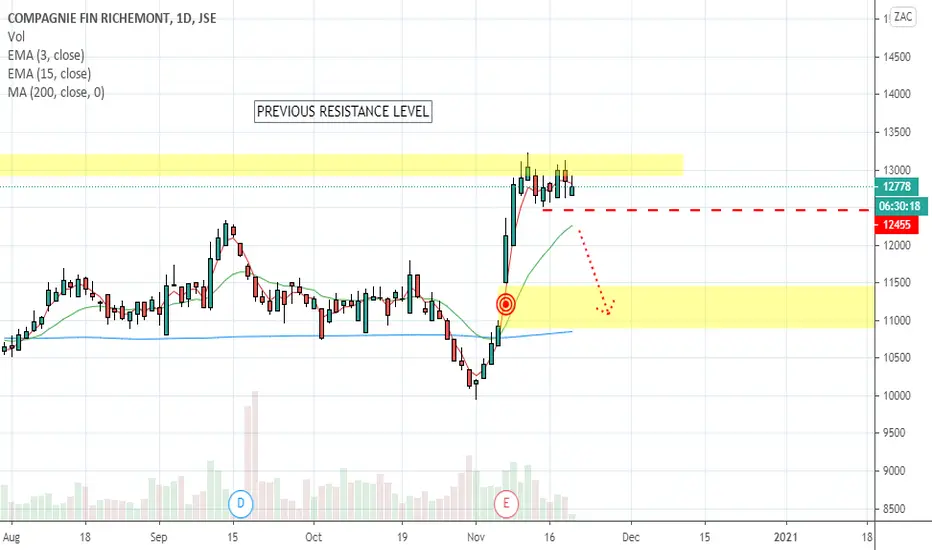
CFR - Struggling at ResistanceJSE:CFR seems to be struggling at a resistance level that it has traded at in August 2018 and November 2017. If it doesn't break through this level and creates lower lows, we can possibly be looking at a short position with a target at the gap from 5 November.
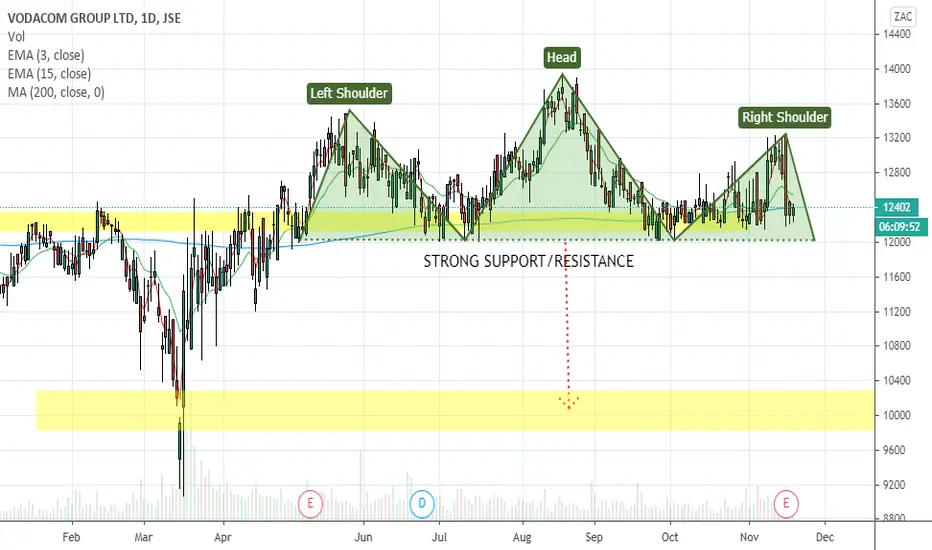
VODACOM - Break below support could mean a short move.A large Head & Shoulders has formed on JSE:VOD at quite a significant support level. If it breaks through the neckline which falls on the support level, we could see a move downwards towards the lows from mid-March.
SHP - Heading for gap closeApart from the double top that has formed, a massive bearish engulfing candle appeared yesterday with very strong downward momentum. If it continues down lower than the low of yesterday's engulfing, I will consider a short position with a target at the close of the gap from the 8th of September.

Sasol- New Chart Work with some changes... Update 1 Hey everyone...
We end the week with Sasol hitting R72 and R122 in one week and as of writing is at R105, We have seen a jump from R91 to R112 in less than an hour.
What a long a interesting week for the markets and Sasol...
I have just posted a revision of my one chart,
I will explain it through updates during the week. I just wanted to end the week of with as much foresight on Sasol as possible.
Please share and ask questions...
As mentioned above Detailed Explanation of the Analysis will follow, please like and share if possible and would really appreciate a follow and a comment and I promise to get back to you.
Kind Regards
Rudi Roelofse
