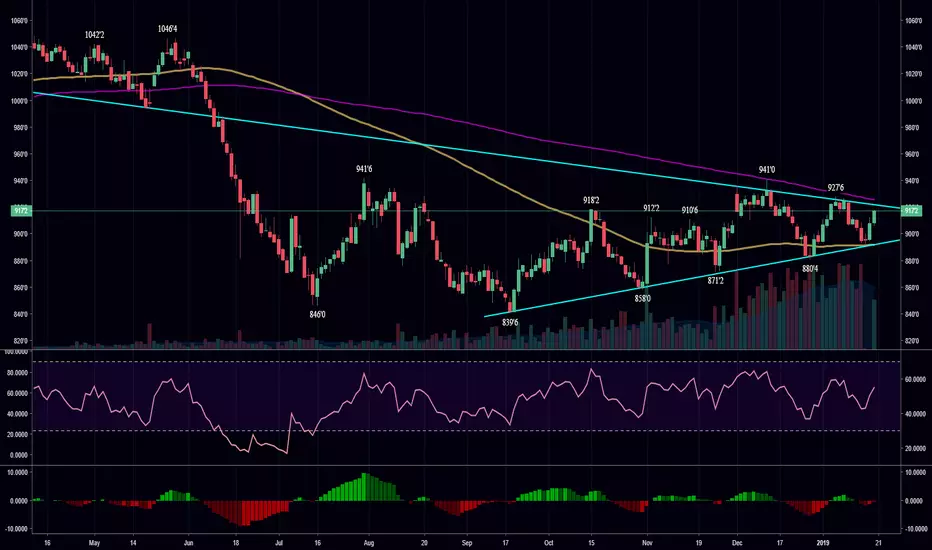
Soybeans Mar 2019 equilibrium patternDaily soybeans futures chart tightening up nicely and should give a good signal in either direction when it breaks. Purple line is 200MA; Yellow line is 100MA.
Soybeans
SOYBNUSD SELL FOR SHORT TERM, BUY FOR MEDIUM TERM.Hi there. Price is forming a continuation pattern to the upside. Wait for the price to complete the pattern and watch strong price action for sell. On bigger time frame, price is forming a continuation pattern to the upside. Wait for the price to hit the bottom of the pattern and watch strong price action for buy.

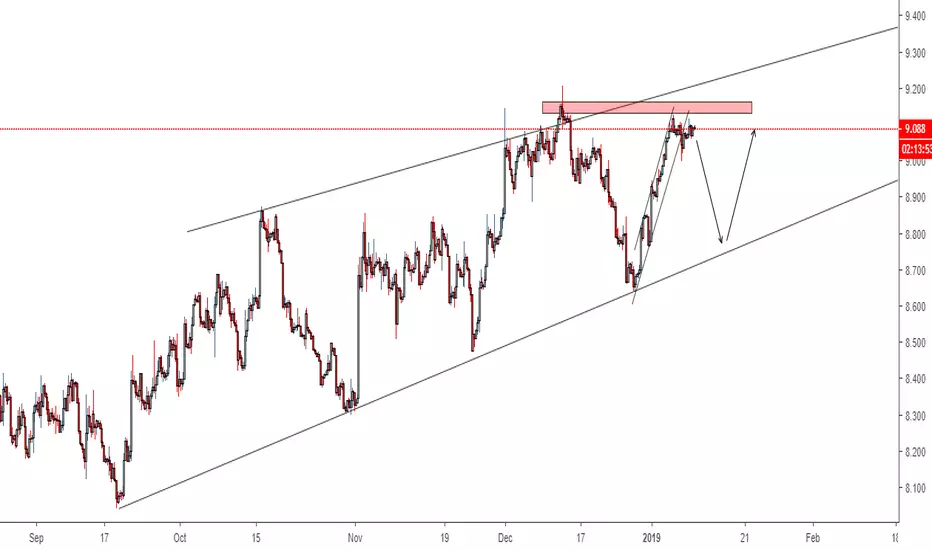
SOYBEAN (SOY/USD)The soybean market is moving in a gradual uptrend and forming a channel. However, there is an opportunity for a short position because of a bearish flag pattern forming and the fact that the price is nearing the channel resistance. Also, the price could form a double top pattern as suggested by the red rectangle forming a horizontal resistance zone.
SOYBEANS: WAVE COUNT / WXYXZ (TRIPLE THREE - BULLISH ) SOYBEANS: WAVE COUNT / WXYXZ (TRIPLE THREE - BULLISH ) OR WXY (DOUBLE THREE - BEARISH)

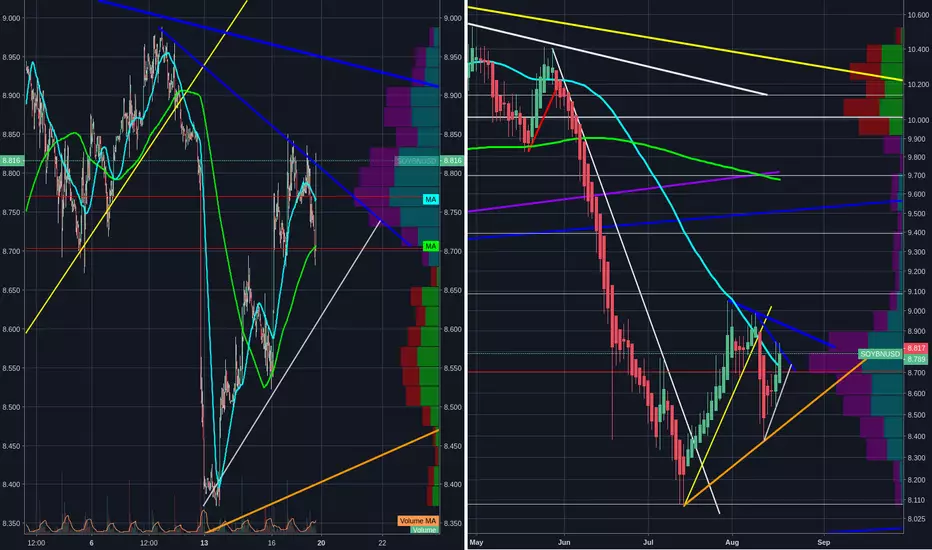
Soybeans Buy setup developing
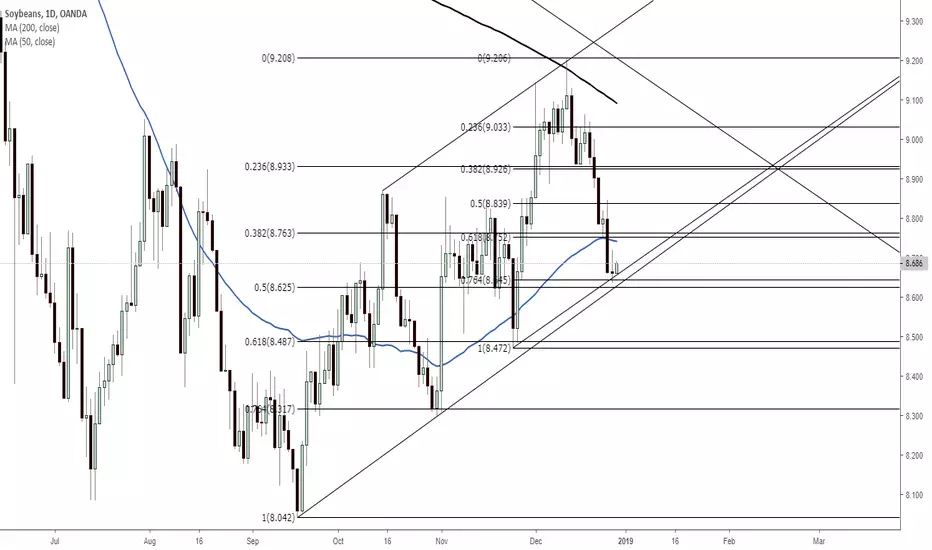
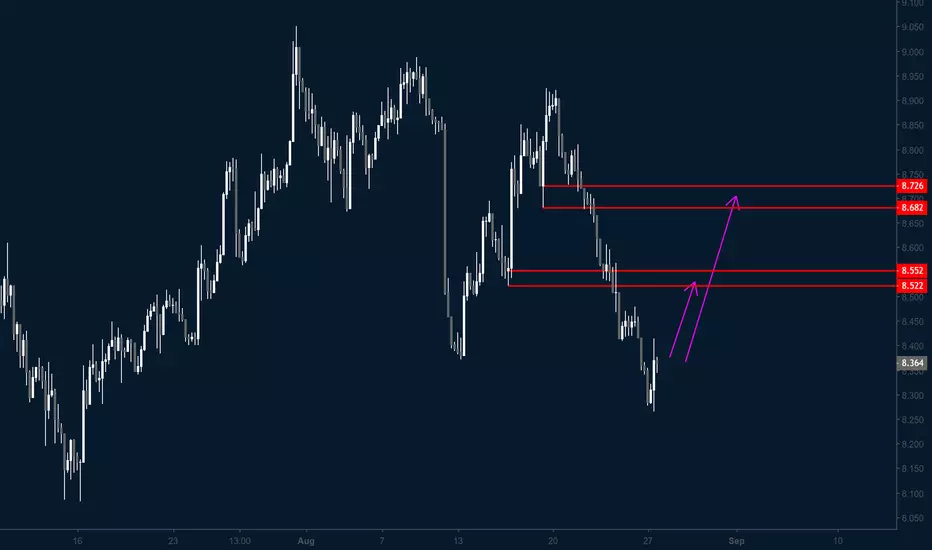
Soybeans recently broke out to a new high and managed to spend some time above the 9.00 mark before the 200 day moving average and the top of an ascending channel forced price back down. It is now stalled at confluence fibonacci support and a parallel of the lower trendline of the ascending channel, with the bottom of the channel very close below. An aggressive approach would be to buy in at the appearance of a positive closing candle. Otherwise a more conservative approach would be to wait for a daily close above the 50 day moving average. Given the time of year the conservative approach seems to be the more appropriate option. Initial target will be 9.00 and a break below the channels lower trendline would invalidate the bullish bias.
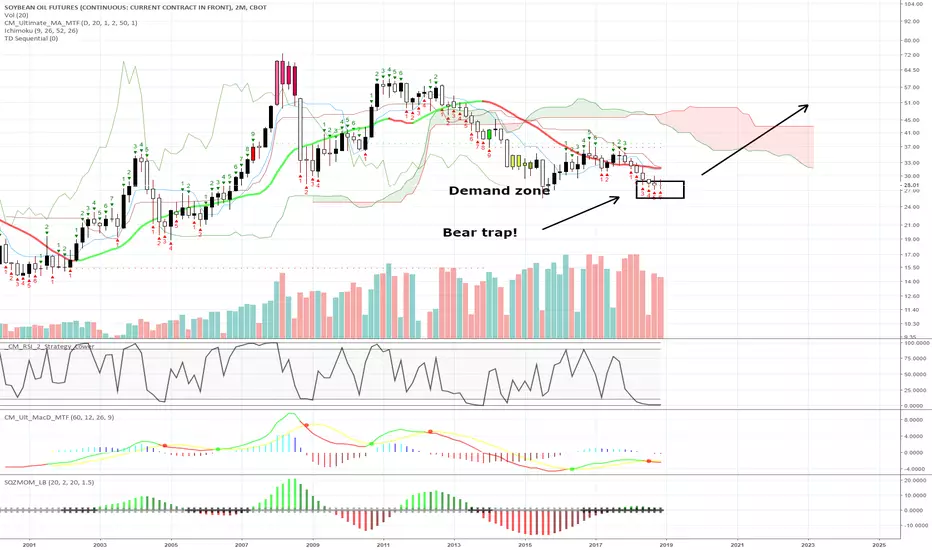
SOYBEAN OIL FUTURES LONGHey friends!
Doing these for fun. Soybean oil futures have bullish signals!
Good luck!

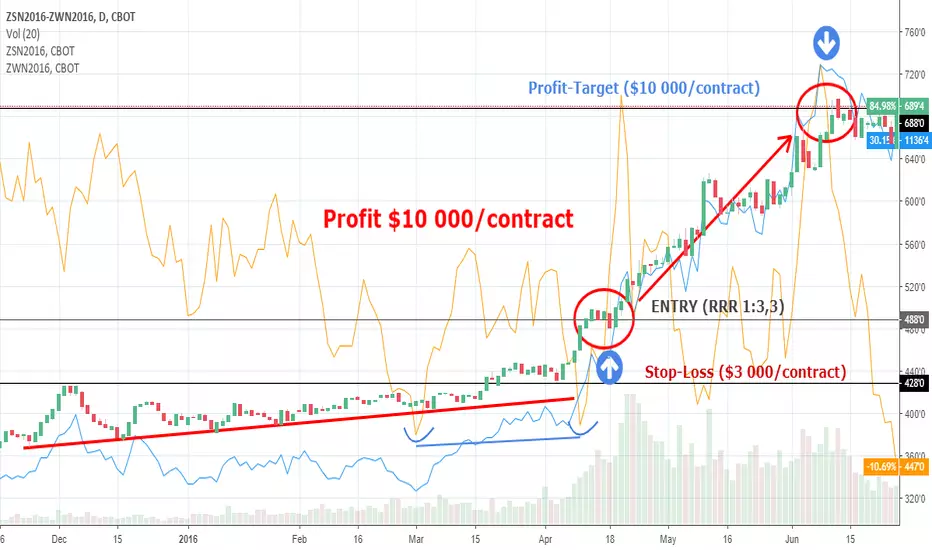
#ZS_F $ZS_F #Soybeans – BULL SPREADI built a bull spread ZSQ19-ZSU19. A possible Entry point could be around 0,0. SL -5,0 ($250/contract) and PT 10,0 ($500/contract).

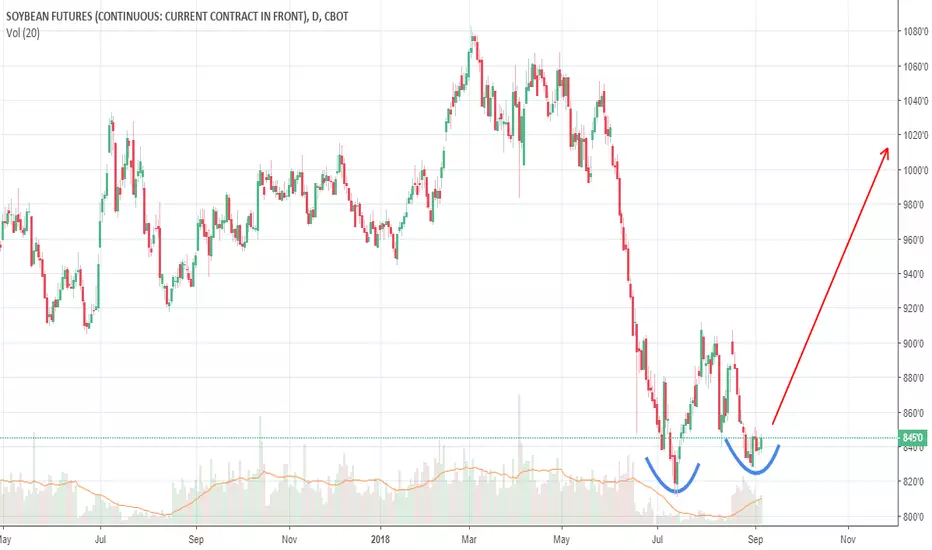
#ZS_F $ZS_F #Soybeans – LONGSoybeans market created a strong S/R zone around 900. If the price will go up over 900 then I see a good potential for reaching 1000 or more.

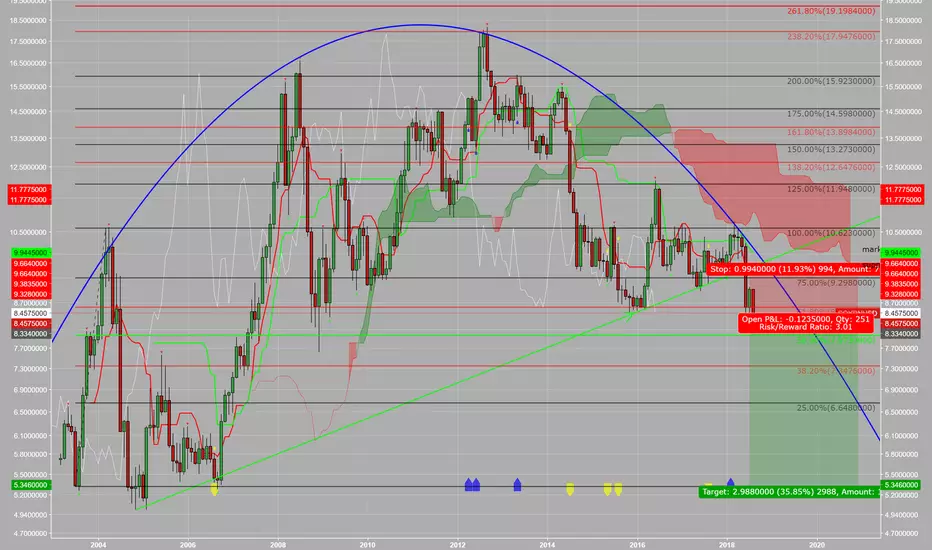
Long SoybeansHi guys ! I post a trading idea for long positions at ZS1! . Recent WASDE report had a price projection for soybeans for 2019 about 900-910. As wee see also in the recent political scene trade war talks at G20 there is a good possibility to go far beyond as from 910. From technical analysis view at the monthly chart is long with target 1056 , RSI is tend to swing to upper levels so I think is a good long signal and ADX now is tending to get a direction which is a further high price. Hope you find it usefull !

SOYBEANS BUY (SOYBEANS – US DOLLAR)Hi there. Price is forming a continuation pattern to the upside. Wait for the price to hit the bottom of the pattern and watch strong price action for buy.

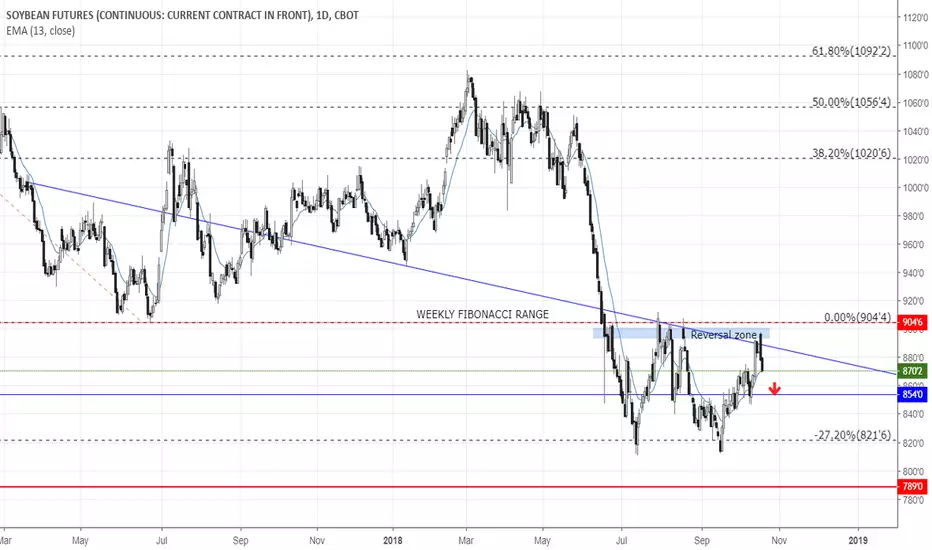
Soybean Futures Momentum BearishThis week price closed with strong bearish momentum after hitting the reversal zone.
With production estimated up, and uncertainty with China trade, the bearish momentum may push further to 854 - 820 level in coming weeks.
Looking to complete the downward range to -27.2% level of the weekly Fibonacci retracement range.
Rectangle Support tested. Reversing towards the Resistance. LongSoybeans (ZS1!) are consolidating (Highs/Lows = 0) near the 1D Rectangle's support (810 - 910). Based on this sideways pattern since late June, the price should now approach the 910 Resistance. We are long, TP = 900.

ZS SOYBEANS. SHORT SELLING OPPURTUNITYAssalamualaikum & Hai to all my trader friend.
ZS Soybeans will be in my watch list from now.
Sharing my trading idea for this market.
Expecting price to move lower to complete the last leg for this motive sequence.

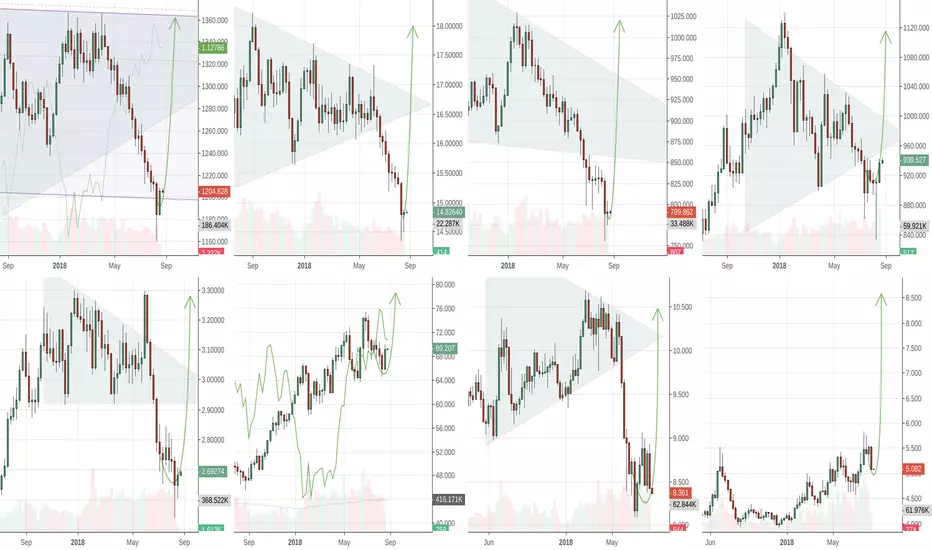
Commodities expected to rally up at triangle crashCommodities quoted as XXXUSD are expected to rally up at triangle crash of JPY, USD & CAD. Mainly because the prices are quoted in USD which is going to devalue hence any rate XXXUSD will go up.

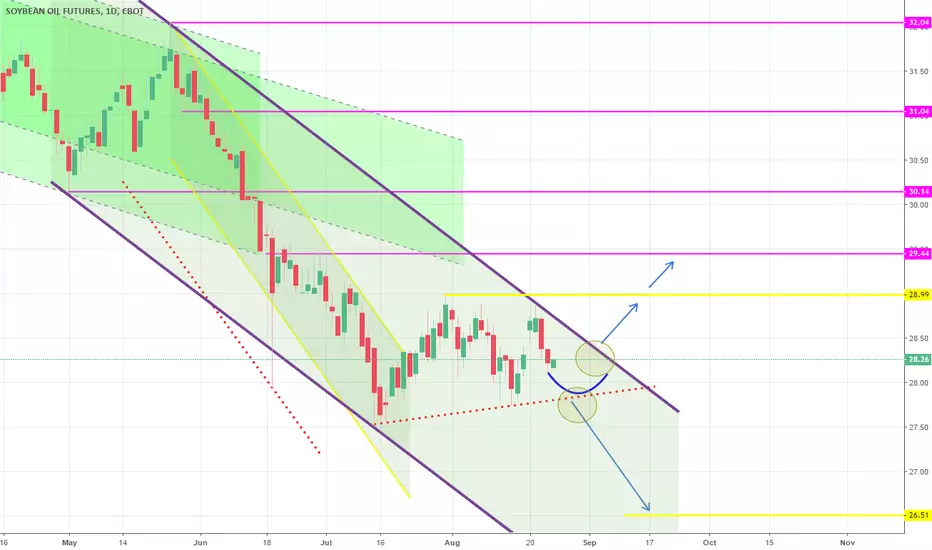
Targest hit. Wait for confirmation on breakout points.Both TP = 30.14 and 29.44 hit as the previous bearish Channel aggressively broke earlier and met the targets much earlier than I expected. Soybean Oil has now entered a new Channel Down on 1D, which is coming off a Lower High (hence Highs/Lows = 0, RSI = 51.334). We now need to wait for confirmation from the two break-out points (illustrated by the circles). If the upper point breaks then we will go long (TP = 28.99 and 29.44). If the lower point breaks then we will go short (TP = 26.51).
$SOYBNUSDwww.wsj.com
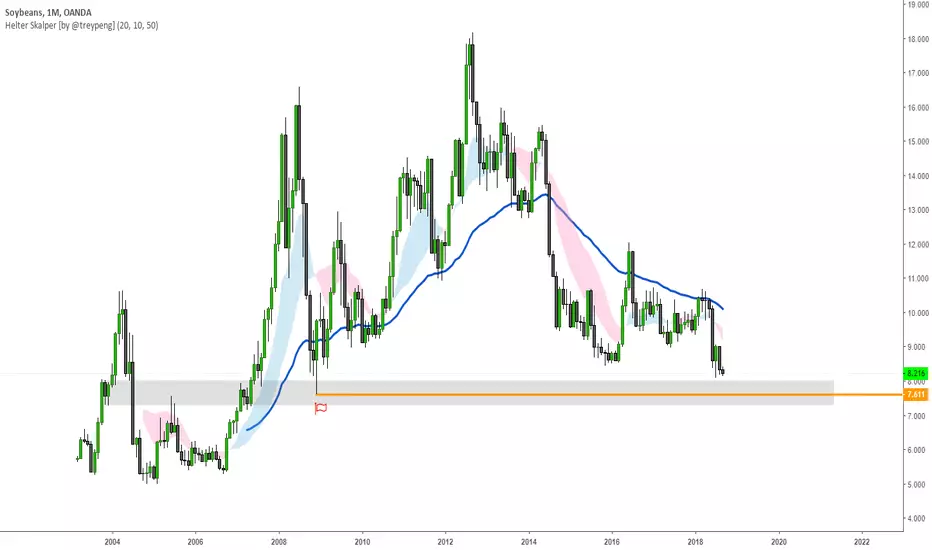
Record supply with lower demand... what do you expect?
manage your risk
gl hf
xoxo
snoop