S&P 500: Key Levels and Potential ScenariosThis analysis of S&P500 will explore both bullish and bearish scenarios, incorporating key levels and considering possible market and crowd psychology.
Bullish Scenario: Potential Uptrend Resumption
From a bullish perspective, if the S&P 500 maintains a position above the 5482 level, it could suggest a potential end to the current correction and a resumption of the major uptrend. A hold above 5482 might reinforce bullish sentiment, encouraging further buying activity, as traders may view this as confirmation of renewed strength. The index could then potentially retest the 5801 level, where it's possible that the index may encounter resistance on the first attempt. A successful break above 5801 would then open the path towards the 6135 zone, which represents a key upside target.
Bearish Scenario: Potential Retest of Support Zones
Conversely, if the S&P 500 fails to hold above the 5482 support level might trigger increased selling pressure, as traders liquidate positions. The index could then potentially retest the 5092 to 4833 support zone. This zone represents a critical area where buyers may step in, but a break below it would signal further weakness.
Concluding Remarks
In conclusion, the S&P 500's price action around the identified key levels will be crucial in determining its short- to medium-term direction. A sustained hold above 5482 could favor a bullish continuation towards 5801 and potentially 6135, while a break below 5482 might lead to a retest of the 5092 to 4833 support zone.
Sp500index

NVDA walkthrough. NDOG+SMT Divergence. Intermarket CorrelationNASDAQ:NVDA
Pairing the NVDA and NQ to understand the direction of the expansion. Although IOF is enough with ES. But if you want to trade the stocks primarily you can use this

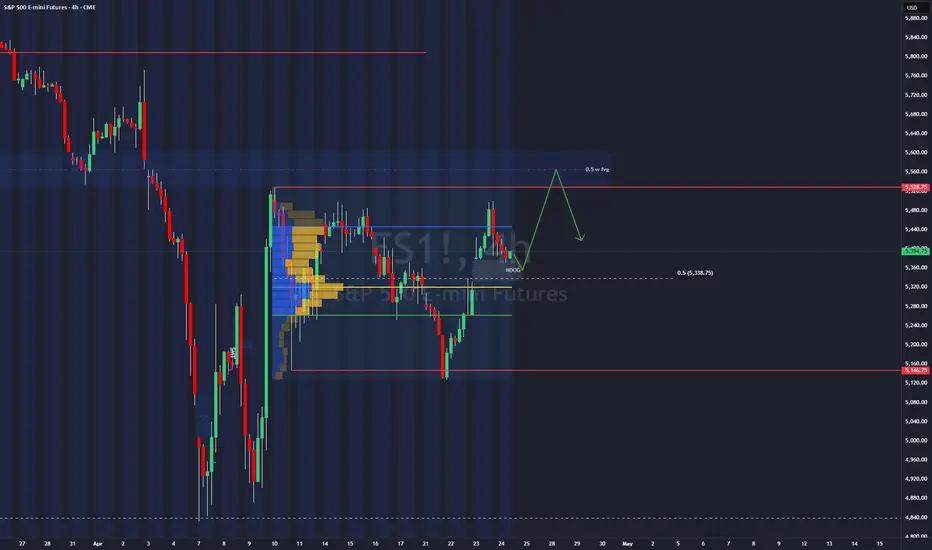
SP500 what to expect next?As a seasoned trader with over a decade of experience navigating the markets, I’ve been closely monitoring the S&P 500’s current price action. The index is presently confined within a well-defined range, with resistance at 5,528 and support at 5,146, based on recent price behavior. We’ve observed a notable deviation below the lower boundary of this range, which often signals a potential reversal or absorption of liquidity before a move higher.
My analysis suggests the next likely target is the upper boundary of the range at 5,528, coinciding with a weekly Fair Value Gap (FVG) that has yet to be filled. Should the price approach this zone, I anticipate a strong market reaction, potentially driven by aggressive order flow as participants defend or challenge this key level. If the weekly FVG is invalidated—meaning price sweeps through this area without significant rejection—the S&P 500 could be poised to break out and target new all-time highs from its current position.
GOOGLE: Attention!!! Bullish force assured!!Alphabet, Google's parent company, presented its results for the first quarter of the year this Thursday, in which it obtained a profit of $34.540 billion, representing a 46% increase compared to the $23.662 billion obtained in the same period of the previous year.
The company also exceeded expectations with its revenue figure, which stood at $90.234 billion, after registering a year-on-year increase of 12%, while the consensus expected it to be $89.120 billion. For its part, operating profit grew to $30.606 billion, with a margin of 34%.
In summary: VERY GOOD RESULTS, and if we add to this the favorable moment we are experiencing due to the TARIFF issue... it WILL go up, no doubt!
---> What is the technical aspect?
If we observe the H1 timeframe chart and its summary table, its trend was clearly bearish, but showing THE FIRST BULLISH SIGNALS. On Wednesday, the bullish force (Bull) signal appeared on the H1 chart, and yesterday, Thursday, it appeared on the H4 chart. Although its trend is still bearish, since its FORCE is now bullish, we can start thinking that its trend could change to BULLISH in the coming days if there are NO NEWS that get in the way.
---> Where do we make the entry?
As the results were published at the close of the American market, today it is most likely to open with a bullish GAP. Here we can do 2 things:
1) If the gap is small, enter at the opening.
2) If the gap is VERY LARGE, wait for a pullback during the day to enter at a better price.
--------------------------------------
Strategy to follow:
ENTRY: We will open 2 long positions in the current zone or taking advantage of a pullback in price (depending on the market gap).
POSITION 1 (TP1): We close the first position in the 183 zone (+12%)
--> Stop Loss at 148 (-8%).
POSITION 2 (TP2): We open a Trailing Stop type position.
--> Initial dynamic Stop Loss at (-8%) (coinciding with 148 of position 1).
--> We modify the dynamic Stop Loss to (-1%) when the price reaches TP1 (183).
-------------------------------------------
CLARIFICATIONS OF THE SETUP
*** How to know which 2 long positions to open? Let's take an example: If we want to invest 2,000 euros in the stock, what we do is divide that amount by 2, and instead of opening 1 position of 2,000, we will open 2 positions of 1,000 each.
*** What is Trailing Stop? A Trailing Stop allows a trade to continue gaining value when the market price moves in a favorable direction, but automatically closes the trade if the market price suddenly moves in an unfavorable direction by 1 a certain distance. That certain distance is the dynamic Stop Loss.
-->Example: If the dynamic Stop Loss is at -1%, it means that if the price makes a downward movement of -1%, the position will be closed. If the price goes up, the Stop Loss also goes up to maintain that -1% on the rises, therefore, the risk is increasingly lower until the position enters profits. In this way, very solid and stable trends in the price can be exploited, maximizing profits.

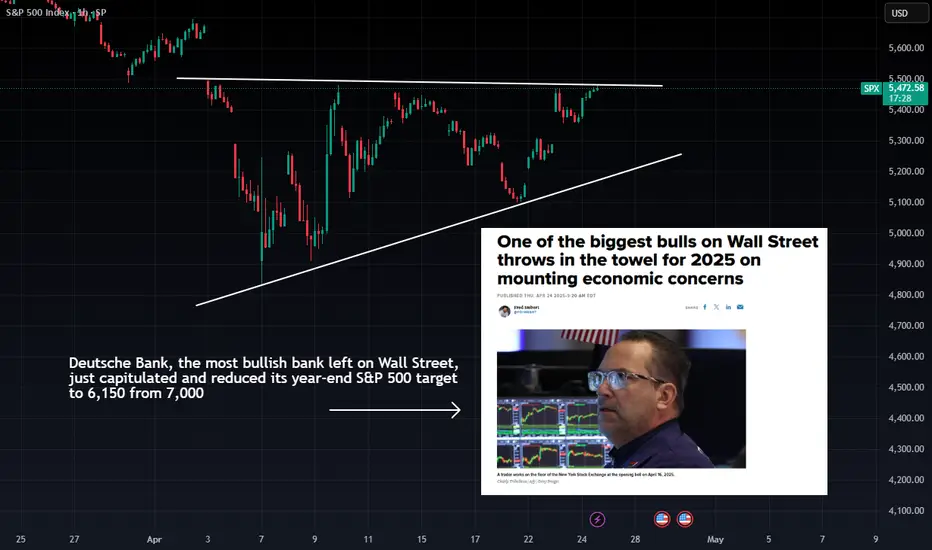
$SPX Bull/Bear Line in the Sand – Fireworks Ahead?The S&P 500 ( SP:SPX ) is sitting just below a clear resistance level—a true bull/bear line in the sand.
On the one hand, bulls are eyeing a potential breakout into the weekend that could ignite a short squeeze or continuation rally. 🎆 On the other, Deutsche Bank, the last of the major bulls, has thrown in the towel—cutting their year-end target from 7,000 to 6,150 amid economic concerns.
This is where things get interesting. If we break above this resistance with volume, expect upside momentum. If not… this could be the start of a deeper rollover.
👉 Watch that overhead line closely. It's the fuse. 💣
🟢 Breakout = bull party
🔴 Rejection = potential for bearish reversal
The SPX On Track To A New All-Time High In 2025 (6,958— Soon!)Do not let anybody distract you, do not allow yourself to be deceived. Know that the market is very resilient and this has been true for the longest time ever. The catastrophe that everybody is always expecting and is always due is never true. Ok, there was a correction, but that's it, from now on the market grows. That's just how it works.
Very, very strong bull markets, and the bear markets weak and short.
The S&P 500 Index (SPX) looks great right now and nothing can surpass the wisdom that comes from a chart. A chart cannot lie nor can mislead you in any way.
The charts have pure raw data, you can make your own interpretation of this data but there are no mistakes.
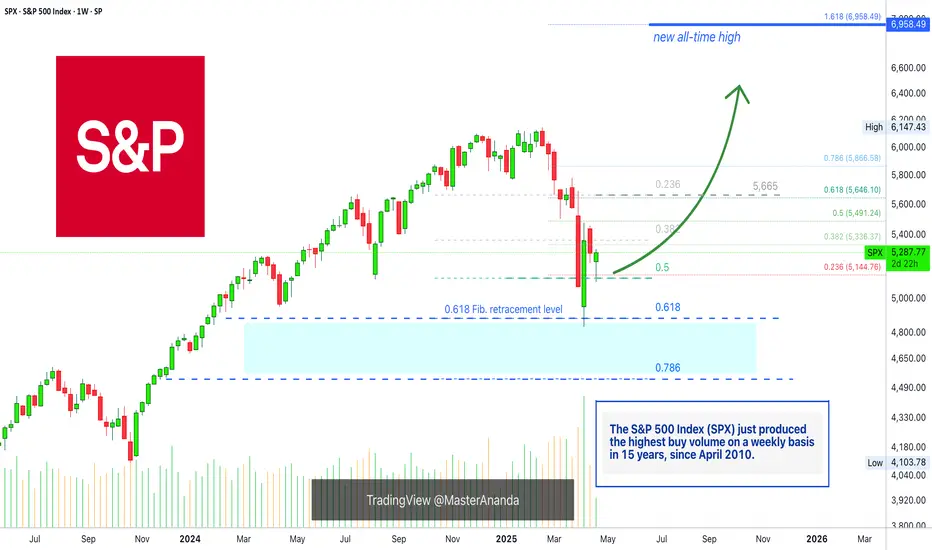
Here the chart shows a very strong higher low. The 0.5 Fib. retracement level was tested and it holds. Now, saying a "new All-Time High" might be speculation, but saying that prices will rise is simply how technical analysis works.
A low first pierced 0.5 and challenged 0.618 fib. The candle closed above and full green, the highest volume since 2010 and that is a clear signal that the correction reached its end.
The SPX is bullish now of course.
The next week we get a red week and this led to the present day, a higher low. A higher low is bullish and notice, the 0.618 level is no longer relevant. The correction that happened was really strong, there is absolutely no need for more.
So a strong correction developed and what comes next?
Prepare for a major rise, a new impulsive bullish wave.
The minimum target starts at 5,665. This is the resistance where the drop got started, this level needs to be tested based on TA. Depending on how this level is handled, we can extract how the market will continue to behave.
» I will make a prediction, the SPX will hit a new All-Time High in the coming months.
Thank you for reading.
Namaste.
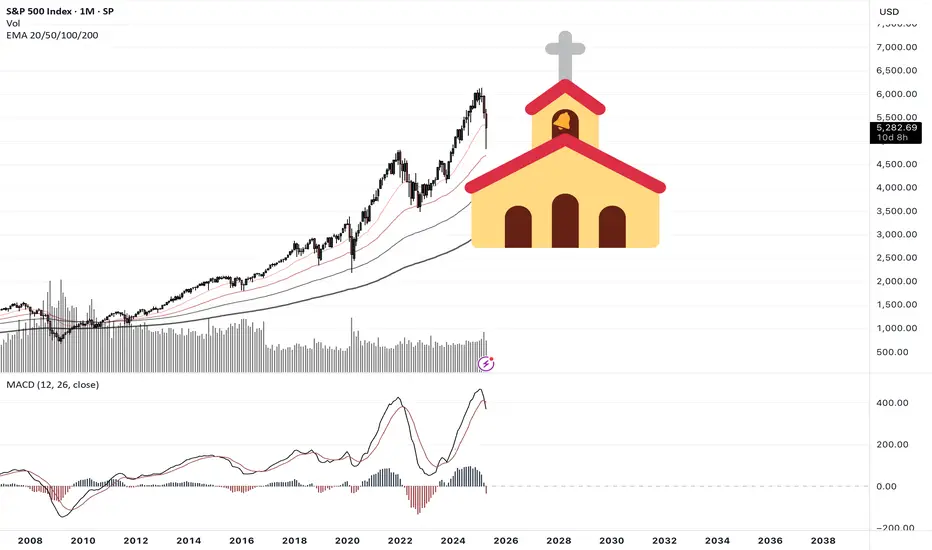
Approaching the 200-Week SMA – AgainHistory doesn’t repeat… but it sure does rhyme.
If all you did was buy the S&P 500 every time it touched the 200-week moving average, you would’ve: ✔️ Bought 2011, 2016, 2018, 2020, 2022… 💰 Absolutely cleaned house.
Now in 2025, we’re approaching the same level again. That SMA has acted like a trampoline for the last 15 years — will it bounce once more?
🧠 Food for thought as fear builds and the market cools.
Let’s see if the buyers step in where they always have. 👀

A Tolled BellThe first bell has rung. A bridge is being paved across the $6000 range.
IF it blows up, it likely won't happen until the bridge is constructed and sentiment improves. Expect a few heartfelt endeavors to shoot above $6,660. Base case is long term crab market.
$SPX Monthly MACD Cross – Reset or Breakdown?The monthly MACD for the S&P 500 ( SP:SPX ) just crossed to the downside 📉 — a signal we’ve only seen a few times in the past decade.
Looking at the chart, this indicator also triggered during:
📉 2018 (Quick pullback)
🦠 2020 (COVID crash)
🐻 2022 (Extended bear market)
Now in 2025, we’re facing another sharp decline — but the question is:
👉 Is this just another quick reset like '18 & '20... or are we about to grind lower like 2022?
The MACD histogram is already in negative territory, and the price action is following the same pattern we saw before extended drawdowns.
What do you think: is this the beginning of something deeper? Or are we prepping for a snapback rally?
Drop your thoughts below 👇

Stock Markets Consolidate Ahead of the HolidaysStock Markets Consolidate Ahead of the Holidays
A lull is expected on the financial markets today due to a shortened trading week related to the Easter holiday celebrations.
It is reasonable to assume that traders will get a “breather” after a news-heavy April, which caused a volatile “shakeout” in the stock markets.
US Stock Markets
On Wednesday, Federal Reserve Chair Jerome Powell was both cautious and somewhat aggressive in his forecasts regarding US monetary policy, stating that Trump’s tariffs could delay the achievement of inflation targets.
In response, US President Donald Trump accused Powell of “playing politics”, hinting at his possible dismissal.
European Stock Markets
On Thursday, the ECB cut interest rates for the seventh time in the past 12 months, and European Central Bank President Christine Lagarde left the door open for further easing.
Analysts had expected a rate cut from 2.65% to 2.40%, so the financial markets reacted relatively calmly to the ECB’s decision.
Technical Analysis of the S&P 500 Chart (US SPX 500 mini on FXOpen)
On the charts of European and US stock indices today, a narrowing triangle pattern is forming, indicating a balance between supply and demand — in other words, price is more efficiently factoring in all influencing elements.
On the S&P 500 chart (US SPX 500 mini on FXOpen), the triangle is highlighted in grey. The ADX and ATR indicators are trending downwards, which underlines signs of consolidation.
From a bearish perspective, the market is in a downtrend (marked by the red trend channel) — but from a bullish point of view, price is in the upper half of the channel.
Although the situation appears “reassuring”, the long weekend may bring a string of high-impact statements from the White House, which could disrupt the balance and lead to a breakout from the triangle.
It is not out of the question that the bulls may seize the initiative and challenge the upper boundary of the channel in an attempt to lay the groundwork for an upward trend (shown in blue lines).
This article represents the opinion of the Companies operating under the FXOpen brand only. It is not to be construed as an offer, solicitation, or recommendation with respect to products and services provided by the Companies operating under the FXOpen brand, nor is it to be considered financial advice.

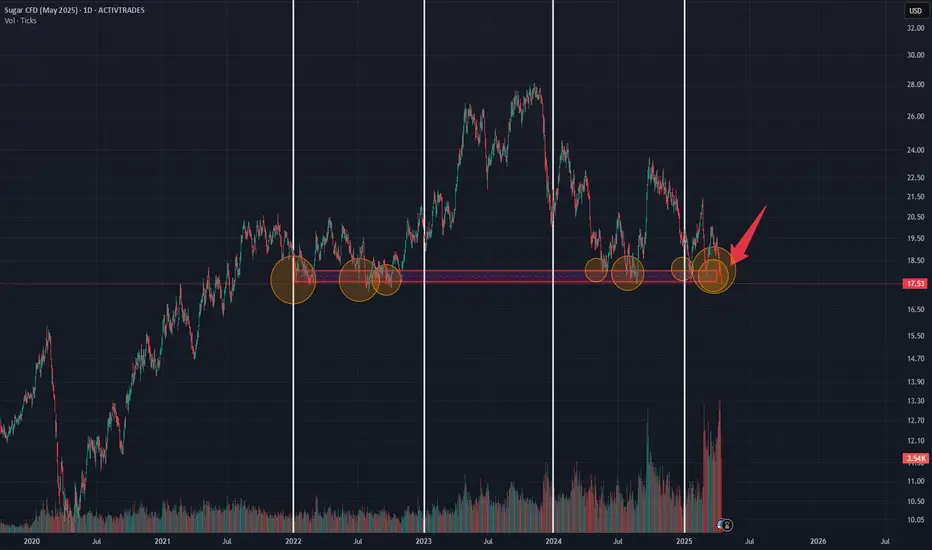
Is Sugar the New 'Dr. Copper'? What Mean for the S&P 500?Sugar isn’t just the sweet powder we add to coffee. It’s a global commodity whose price swings reveal surprising truths about the world economy. With sugar prices now hovering near the 17.5–17.7 per pound support level for the sixth time since 2022, it’s time to ask: What story are these numbers telling us?
Sugar’s History: Peaks and Valleys
Sugar has always been a fickle player in commodity markets. Its price has soared above $20 per pound due to droughts or poor harvests, only to crash when supply outstrips demand. But today’s figures are particularly troubling.
Facts:
In recent months, sugar prices have not only approached multi-year lows but remain stagnant.
Low prices signal weak demand. And where there’s no demand, there’s no production growth.
But let’s zoom out: If sugar is losing its appeal, could this be a sign of slowing economic activity? If you think this is speculative, consider real-world data.
“Dr. Copper” vs. “Dr. Sugar”
We all know copper is the economy’s barometer, correlating with industrial production, construction, and tech innovation. But why isn’t sugar part of the conversation? 🍬
Why Sugar Matters:
The Confectionery Industry: Sugar is a cornerstone of baked goods, candies, and everyday staples. A drop in consumption could reflect shrinking consumer purchasing power.
Global Ubiquity: Unlike copper, sugar is used everywhere—from developing economies to wealthy nations. Its demand mirrors economic sentiment and living standards.
The U.S. Economic Outlook: Alarming Signals
Recent U.S. economic indicators paint a grim picture:
Rising Unemployment: The U.S. unemployment rate hit 4.1% in Feb 2025 (up from 3.9% a year prior), signaling job losses in key sectors.
Slowing GDP Growth: expanded by 2.8% in 2024, little-changed from the 2.9% growth recorded in the previous year- below analysts’ expectations.
Inflation “Cooling”: While inflation dipped to 2.4% in March, falling commodity prices (like sugar) may hint at deflationary pressures.
What “Dr. Sugar” Reveals
Connecting the dots—low sugar prices, slowing production, rising unemployment, and weak GDP growth—paints a clear picture: The U.S. (and global) economy is at a crossroads.
Key Takeaways:
Falling sugar prices may signal early-stage declines in consumer demand.
Deflationary trends could threaten the S&P 500 as companies face shrinking revenues and margins.
Given current data, the risk of a recession within months remains high.
How to Use Sugar as an Economic Indicator
To track economic health:
Monitor Exchange Prices: Sudden sugar price drops may foreshadow economic slowdowns.
Compare with Other Staples: Track correlations with wheat, corn, and other food commodities to gauge consumer behavior shifts.
Watch Producers: Food industry giants often react first to demand changes. Study their earnings reports.
Conclusion: A Sweet Indicator of Bitter Times?
Sugar is more than a raw material—it’s a mirror reflecting economic sentiment. Today, with prices near historic lows and U.S. economic data flashing warning signs, we must ask: Are we ready for a potential recession?
I believe “Dr. Sugar” deserves more attention. What’s your take? Join the discussion and share your thoughts! 💬
Daily Price Action: S&p500 SPX Tuesday 4/15/2025 In this video, we are looking into the potential daily price action of SPX.

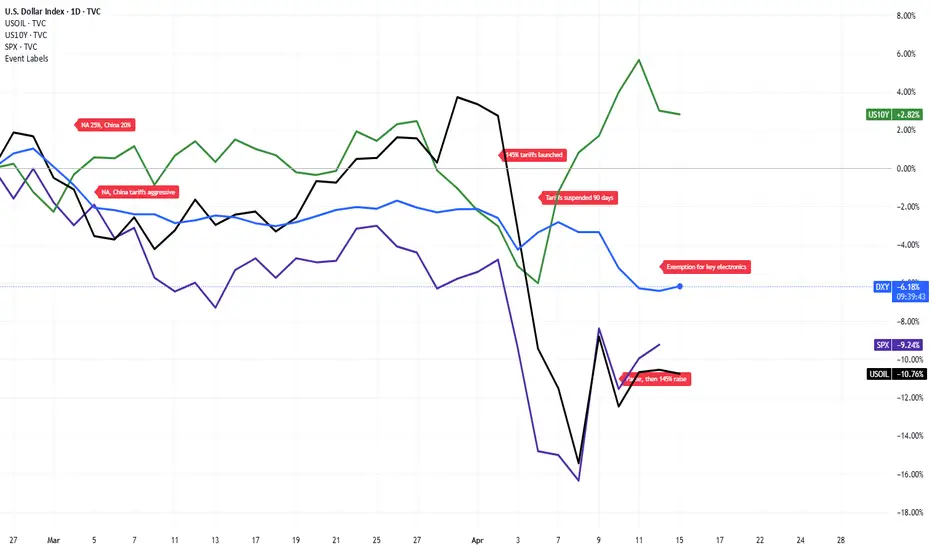
How to Trade the Tariff Turmoil: Markets Now Move on HeadlinesMarkets in 2025 have become increasingly unpredictable, largely driven by one factor: tariffs. President Donald Trump’s aggressive trade policy has shaken investor confidence and turned global markets into a rollercoaster. The key to navigating this new environment? Understand that markets are no longer just reacting to economic data—they’re reacting to headlines.
The biggest shock came on April 2, when Trump announced a 145% tariff on all Chinese imports and “reciprocal” tariffs on dozens of other countries. The reaction was immediate: the S&P 500 dropped nearly 15% at its lowest point that week, and investors rushed to sell risk assets. Days later, markets sharply reversed after Trump temporarily suspended some tariffs. That sparked a rally—tech stocks soared, Apple rose 5%, and the Nasdaq gained over 2%.
But the relief was short-lived. Conflicting messages and partial rollbacks continued to send markets up and down. Earlier, on March 4, tariffs were placed on Canada and Mexico, while China’s rates were doubled. These moves led to more selling in stocks and a spike in demand for bonds. By mid-April, exemptions for electronics boosted tech names again, but overall market sentiment remained fragile.
How to Trade This New Market
The main lesson for traders and investors is clear:
We’re now in a headline-driven market. Traditional strategies that rely solely on fundamentals or economic cycles are being overshadowed by sudden political developments. Here’s how to adapt:
Stay Nimble and News-Aware
Be ready for fast moves. Market direction can flip in minutes based on a single press conference or tweet. Have alerts set for major geopolitical and tariff-related headlines. Reduce position sizes during uncertainty and avoid holding large trades through major announcements.
Rethink Your Safe Havens
The U.S. dollar is no longer acting like the safe haven it used to be. With rising fiscal concerns and volatile trade policy, investors are shifting toward alternatives. Gold and the Swiss franc (CHF) have become more reliable options during risk-off moments. If uncertainty spikes, these assets may offer better protection than the dollar.
Focus on Sectors Sensitive to Policy
Tech stocks have been among the most affected. Tariff exemptions caused sharp rallies, while new restrictions triggered big drops. If you trade sectors like tech, consumer goods, or industrials, stay especially alert for trade-related headlines.
Bottom line: In 2025, geopolitics is moving markets more than ever. The old playbook needs updating. By staying flexible, tracking headlines, and turning to traditional safe havens like gold and CHF, traders can better navigate the noise—and find opportunity in the chaos.
“Markets are strong” – Are they really?President Trump recently stated that "markets became very strong once they got used to tariffs."
But let’s look at the facts:
📊 AMEX:SPY is down -9% YTD, and major names like:
MSFT: -7.55%
AAPL: -18.66%
NVDA: -12.94%
Tech is bleeding, and the broader S&P 500 is clearly reflecting the pressure of trade policy uncertainty.
🟥 Tariffs = market stress
🟩 Market resilience = not the same as strength
What we’re seeing is not a “strong market” — it’s a market under pressure trying to survive political noise. The weekly chart shows a clear drop after the peak, followed by uncertainty, not conviction.
💭 Is this truly the “strength” investors want to see?

SPY Back Up To Fill GapWe have a nice little gap above us and there is a good chance we can fill it. Also, we have a bull-flag formation that is likely to play out. Not financial advice.
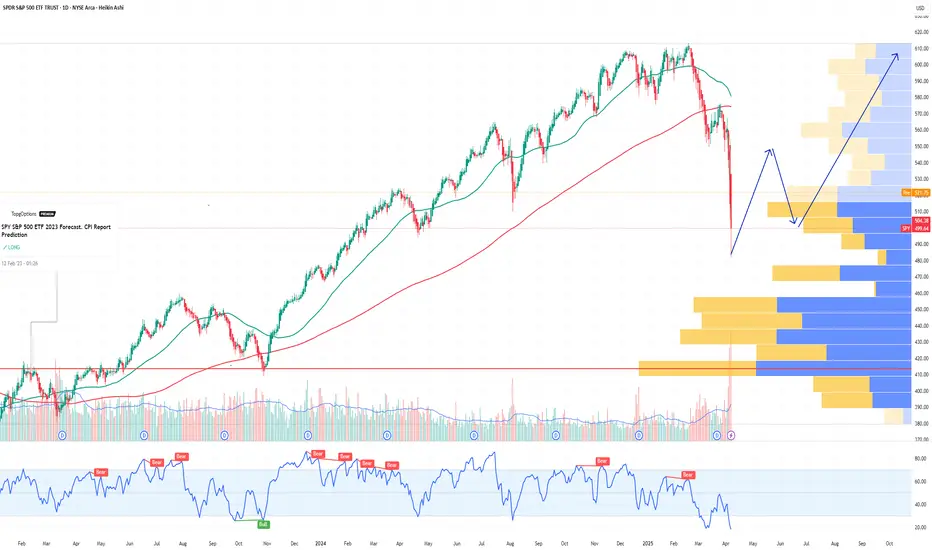
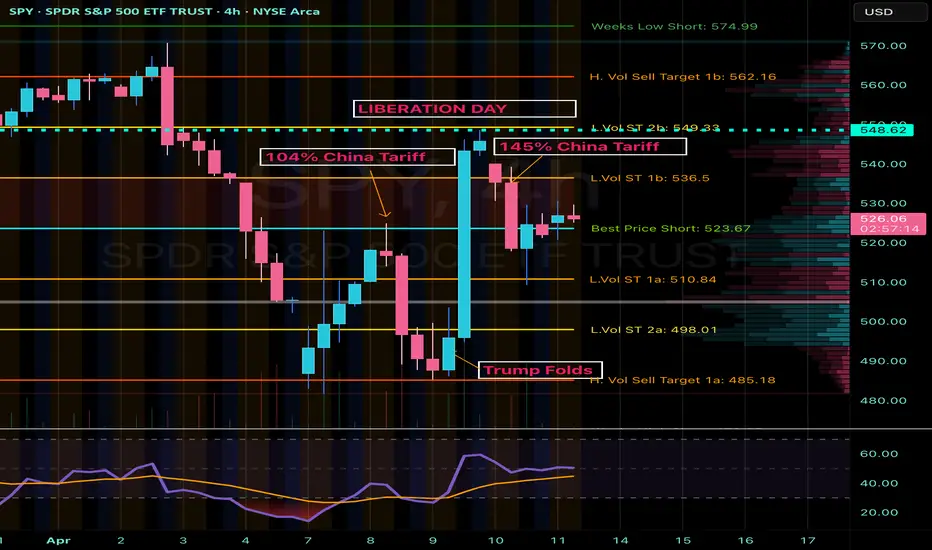
SPY Analysis: Navigating Tariff-Induced VolatilityContinuing from my last update, market volatility remains high due to Trump's unpredictable policy decisions. After initially folding and offering economic relief, Trump pivoted sharply with a sudden 145% tariff announcement. Today, China countered strongly with a 125% tariff. These escalating tariff exchanges continue to create significant uncertainty and market fluctuations, highlighting the critical need for careful analysis and precise trade management.
Technical Breakdown (4-Hour Chart)
Current Price Zone: Around $528.45
Key Resistance Levels:
- Immediate Resistance: $536.50 (L.Vol ST 1b)
- Critical Resistance: $549.33 - $549.60 (L.Vol ST 2b)
- Major Resistance Zone (Liberation Day): Approximately $562.16
Support Levels:
- Initial Support: $523.67 (Best Price Short)
- Secondary Support: $510.84 (L.Vol ST 1a)
- Important Lower Support: $498.01 (L.Vol ST 2a)
- Strong Support Level (Trump Folded area): ~$485.18
Trading Scenarios
Bullish Scenario (Potential Tariff Tension Relief):
- Entry Trigger: Confirmed breakout and sustained hold above resistance at $536.50.
Profit Targets:
- Target 1: $549.33 (next strong resistance level)
- Target 2: $562.16 (major resistance)
- Stop Loss: Below immediate support at $523.67, carefully managing downside risk.
Bearish Scenario (Ongoing Tariff Escalation or Increased Market Fear):
Entry Trigger: Inability to reclaim $536.50, or a decisive breakdown below support at $523.67.
Profit Targets:
- Target 1: $510.84 (nearest significant support)
- Target 2: $498.01 (secondary critical support)
- Target 3: $485.18 (robust support area)
- Stop Loss: Above resistance at $536.50 to protect against potential reversals.
Thought Process & Final Thoughts
The SPY currently trades within clearly defined resistance and support bands, heavily influenced by unpredictable tariff-driven headlines. Trump's volatile policy shifts and China's assertive retaliations amplify short-term market risks. Maintain flexible trading strategies, adhere strictly to established levels, and practice disciplined risk management. Continuous monitoring and swift response to evolving market sentiment will be essential for navigating this challenging environment effectively.
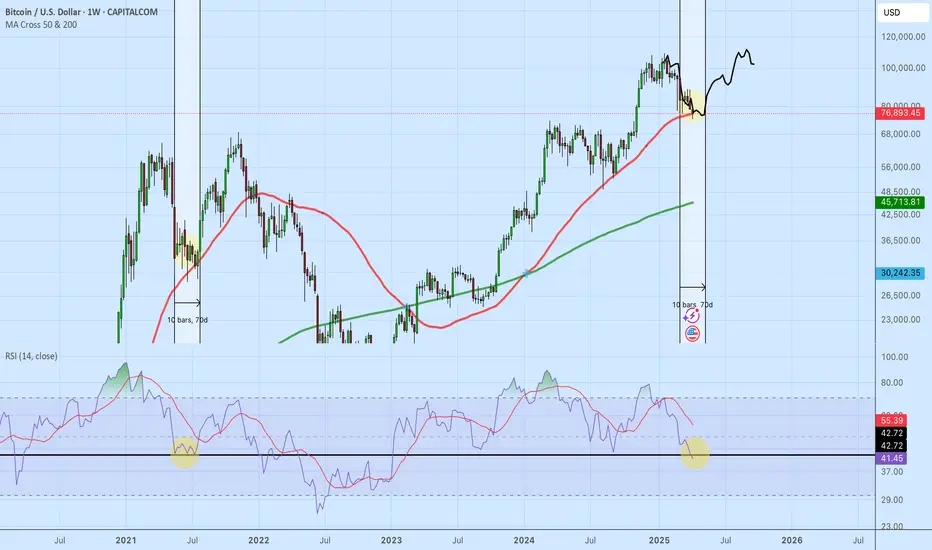
BITCOIN 2025 - THE LAST HOPECRYPTOCAP:BTC currently finds itself at the intersection of geopolitical tensions and broader macroeconomic uncertainty. Although traditionally viewed as a hedge against systemic risk, it is presently exhibiting characteristics more aligned with high-risk assets. The FED's forthcoming policy decisions will likely play a pivotal role in determining whether Bitcoin stabilizes or experiences further downward pressure.
The chart represents the most optimistic scenario for Bitcoin to date
SP500: Optimism in the markets !! No Fear !!Mr. Trump MANIPULATES THE WORLD as he pleases, and WE AS ANALYSTS have to BE COLD and be VERY ATTENTIVE to the news MORE THAN EVER!! And of course, NO FEAR.
--> What does the SP500 and the rest of the indices and stocks look like?
From my point of view, yesterday's news of granting a 90-DAY TRUCE on tariffs GIVES US THE POSSIBILITY OF UPSIDES for at least the next 2 months (ALWAYS with Trump's permission). Furthermore, we've also learned that US inflation fell to 2.4% in March, and the core rate to 2.8%, below expectations, which is VERY GOOD for the markets.
With this data and the SHARP FALLS accumulated so far this year!!, UPSIDES ARE COMING!!
Yesterday, the indices rose by nearly 10%, and it's normal for them to be falling by 5% today. If we observe the H1 chart above, the price has fallen to the 50% Fibonacci zone, meaning we are already in a good entry zone.
--> We can do 2 things:
When the price in lower timeframes (M15 chart below) shows us a bullish signal (Bull), make the long entry.
Go long in the zone between the 50%-61.8% Fibonacci (current zone).
--------------------------------------------------------------------
Strategy to follow:
ENTRY: We will open 2 long positions when the price enters the Fibonacci zone (50% - 61.8%) or when a lower timeframe chart gives us the bullish signal (Bull).
POSITION 1 (TP1): We close the first position in the 5,490 zone (+5.8%)
--> Stop Loss at 4,900 (-3.5%).
POSITION 2 (TP2): We open a Trailing Stop type position.
--> Initial dynamic Stop Loss at (-3.5%) (coinciding with the 4,900 of position 1).
--> We modify the dynamic Stop Loss to (-1%) when the price reaches TP1 (5,490).
SETUP CLARIFICATIONS
*** How to know which 2 long positions to open? Let's take an example: If we want to invest 2,000 euros in the stock, we divide that amount by 2, and instead of opening 1 position of 2,000, we will open 2 positions of 1,000 each.
*** What is a Trailing Stop? A Trailing Stop allows a trade to continue gaining value when the market price moves in a favorable direction, but automatically closes the trade if the market price suddenly moves in an unfavorable direction by 1 a determined distance. That determined distance is the dynamic Stop Loss.
--> Example: If the dynamic Stop Loss is at -1%, it means that if the price falls by -1%, the position will close. If the price rises, the Stop Loss also rises to maintain that -1% on the upside, therefore, the risk becomes lower and lower until the position becomes profitable. This way, very solid and stable trends in the price can be taken advantage of, maximizing profits

US500 Historical Rallies & Pullbacks with a Potential ProjectionI’ve observed the US500’s performance over the years, marking rallies with a blue line and pullbacks with a yellow line. Looking at the chart, a systematic repetition of these movements emerges, which, at first glance, seems to follow a recognizable pattern.
Specifically, I’ve cloned the blue line from the rally that started on 03/23/2020 and ended on 12/20/2021, now represented by a green line, to hypothesize a potential future rally. This clone is based on the duration of previous pullbacks:
The first pullback, before the 2020 rally, began on 02/20/2020 and ended on 03/23/2020.
The second pullback, the current one, started on 02/17/2025 and might conclude around 04/07/2025, potentially paving the way for a new rally.
the angle of those pullbacks is almost identic
This "snapshot" observation suggests we could be nearing a turning point. Of course, this is just a hypothesis based on historical patterns, and I encourage cross-referencing it with other indicators or analyses. What are your thoughts?

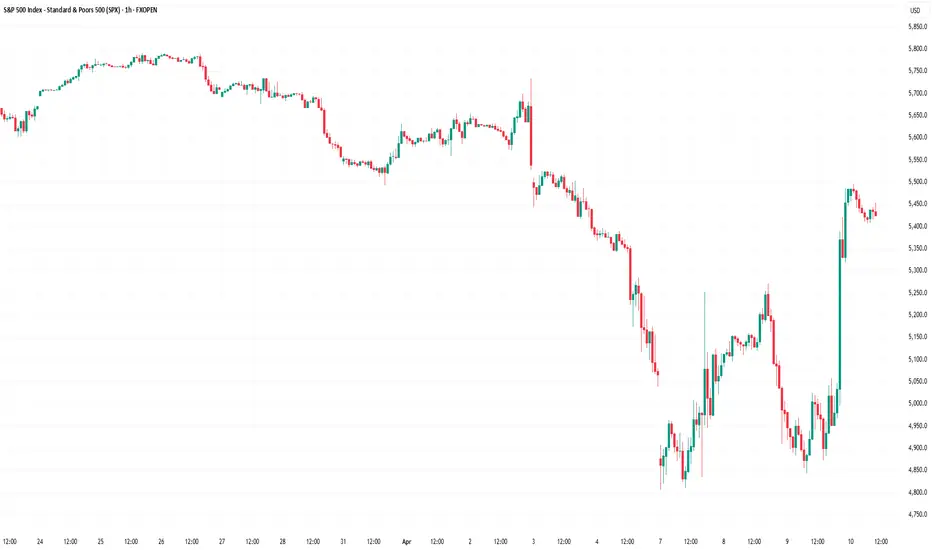
Trump Delays Tariffs for 90 Days. The S&P 500 Rebounds SharplyTrump Delays Tariffs for 90 Days. The S&P 500 Rebounds Sharply
As shown in the chart of the S&P 500 (US SPX 500 mini on FXOpen), the index is currently trading near the 5,500 level.
This result is highly encouraging, considering that as recently as yesterday morning, the index was hovering around 4,900.
Why Have Stocks Risen?
The strong rebound seen yesterday evening was triggered by a statement from the US President — he announced a 90-day delay in the implementation of wide-ranging global trade tariffs, which had originally been unveiled on 2 April and led to a sharp drop in the index (as indicated by the arrow).
However, this does not apply to China, for which tariffs were not delayed but increased. "Due to the lack of respect China has shown towards global markets, I am raising the tariff imposed on China by the United States of America to 125%, effective immediately," said Donald Trump, according to media reports.
Overall, US stock markets responded positively to the news, and Goldman Sachs economists have withdrawn their US recession forecasts.
Technical Analysis of the S&P 500 Chart (US SPX 500 mini on FXOpen)
Despite yesterday’s sharp rebound, the stock market remains in a downtrend (as indicated by the red channel).
From a bullish perspective:
→ A Double Bottom pattern (A–B) has formed around the 4,900 level;
→ Price has moved into the upper half of the channel.
From a bearish perspective:
→ Bulls must overcome key resistance near the psychological 5,000 level;
→ While tariffs have been delayed, they have not been cancelled. As such, the risk of an escalating trade war is likely to continue putting pressure on the S&P 500 index (US SPX 500 mini on FXOpen) in the coming months.
This article represents the opinion of the Companies operating under the FXOpen brand only. It is not to be construed as an offer, solicitation, or recommendation with respect to products and services provided by the Companies operating under the FXOpen brand, nor is it to be considered financial advice.
Island Bottom CONFIRMED on $SPY IF we GAP up tomorrow!Island Bottom CONFIRMED on AMEX:SPY SP:SPX IF we GAP up tomorrow!
I only believe we can GAP up tomorrow if there is news of China coming to the negotiation table with the U.S. after they raise the Reciprocal Tariffs to 104%.
If this doesn't happen, then this isn't confirmed, and we see a retest of $482, IMO!
I'm not playing this as a trade until we get confirmation! Too dangerous!
Not financial advice

SP500: Is This the 2025 Correction? Or Just Another Bounce?Looking at the weekly chart of the S&P 500 with RSI and key support trendlines, it’s clear we’ve entered a historically important level.
🔍 Context:
2020 → COVID Crash, RSI bottomed 💥
2022 → Bear Market, RSI again flagged a major drop 📉
2023 → Healthy correction, price respected trendline support
2025? → RSI flashing oversold, price testing the long-term trendline again.
📊 RSI is approaching the same low levels as the previous two macro shocks — is this a signal of another reversal opportunity? Or could this time be different?
🚨 If we break below this trendline convincingly, it could open the door for a deeper bear leg. But if we hold, we might just see another bounce-back rally like in 2020 and 2022.
📈 Watch for confirmation:
A strong bounce with bullish RSI divergence = potential long
Breakdown + volume spike = more downside ahead
Let’s see if the trendline holds up — it has for 5 years… 👀
#SP500 #Correction #BearMarket #RSI #TechnicalAnalysis #MarketUpdate #2025Outlook #StockMarketIdeas

SPY S&P 500 ETF Potential W-Shaped Recovery Forming We may be witnessing the formation of a W-shaped recovery on the SPY (S&P 500 ETF) – a classic double-bottom structure that often signals a strong reversal after a period of correction or volatility. Let’s dive into the technicals and what this could mean in the sessions ahead.
🔍 The Technical Setup:
SPY recently tested key support around the $485-$500 zone, bouncing off that area twice in the past few weeks. This gives us the left leg of the W and the first bottom. After a modest relief rally to ~$520, we saw another pullback – but this second dip failed to break below the first bottom, a hallmark of the W-pattern.
As of today, SPY is starting to reclaim ground toward the $517-$520 resistance zone. If bulls can push through this neckline area, especially with volume confirmation, we could see a breakout that targets the $530-$535 area in the short term.
🔑 Key Levels to Watch:
Support: $490-$500 (double-bottom support zone)
Neckline/Resistance: $530
Breakout Target: $550 (previous highs)
Invalidation: A break below $490 with volume could invalidate the W-recovery idea and shift bias bearish.
📊 Momentum & Volume:
RSI is climbing back above the 50 level – bullish momentum building.
MACD shows a potential crossover forming, hinting at a shift in trend.
Watch for increasing buy volume as SPY approaches the neckline – that’s where the bulls will need to step up.
🧠 Macro & Earnings Angle:
Don’t forget – we’re entering a heavy earnings season and rate cut expectations are still a wildcard. A dovish tone from the Fed and strong corporate results could be the fuel that sends SPY higher to complete this W-shaped recovery.
🧭 Final Thoughts:
This is a high-probability setup if neckline resistance is broken cleanly. Wait for confirmation before going heavy – fakeouts are common in double-bottom scenarios. If we do get the breakout, we may be looking at a broader market rebound going into summer.
🔔 Set alerts near $525. A confirmed breakout could mean the bulls are back in charge.