S&P500, US GDP grew by 2.3% in Q4 The U.S. GDP grew by 2.3% annually in Q4, confirming the initial estimate and meeting market expectations. S&P (US500) index pair price action sentiment appears bullish, supported by the longer-term prevailing uptrend. The recent intraday price action appears to be a sideways consolidation after a retest of an all-time high on 19th Feb ‘25.
The key trading level is at the 5918 level, the consolidation price range and also the previous resistance is now a newly formed support zone. A corrective pullback from the current levels and a bullish bounce back from the 5918 level could target the upside resistance at 6018 followed by the 6060 and 6106 levels over the longer timeframe.
Alternatively, a confirmed loss of the 5918 support and a daily close below that level would negate the bullish outlook opening the way for a further retracement and a retest of 5866 support level followed by 5827 and 5777.
This communication is for informational purposes only and should not be viewed as any form of recommendation as to a particular course of action or as investment advice. It is not intended as an offer or solicitation for the purchase or sale of any financial instrument or as an official confirmation of any transaction. Opinions, estimates and assumptions expressed herein are made as of the date of this communication and are subject to change without notice. This communication has been prepared based upon information, including market prices, data and other information, believed to be reliable; however, Trade Nation does not warrant its completeness or accuracy. All market prices and market data contained in or attached to this communication are indicative and subject to change without notice.
Sp500index

Markets have Bottomed - Here's WHY!I believe Markets have Bottomed - Here's WHY! NASDAQ:QQQ AMEX:SPY AMEX:IWM CBOE:MAGS TVC:VIX
In this video, I will go over what I believe is going on in the markets and where we will go next from here.
Doing all this while looking at all the probabilities and what they are telling us.
Not financial advice

SP 500 roadmap for the next few days The chart posted is the cash sp 500 based on lots and the Math we should hold the 6009 area if this is correct and then drop into some bad news in a 3 wave drop to .786 or a minor new low at 5886 Not sure yet .I am back in Cash 100 % just relaxing and watching the MATH best of trades the WAVETIMER

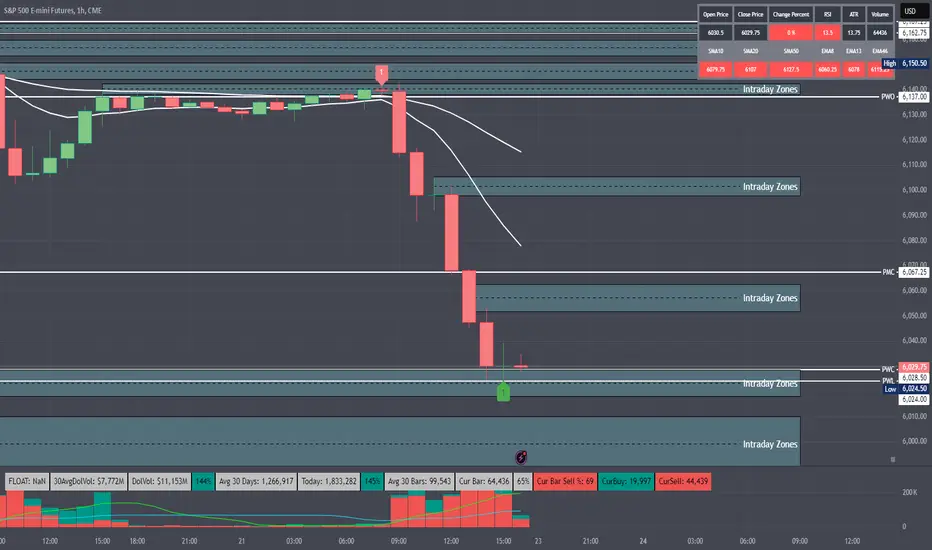
S&P INTRADAY oversold bounce back? S&P (US500) index pair price action sentiment appears bullish, supported by the longer-term prevailing uptrend. The recent intraday price action appears to be a sideways consolidation after a retest of an all-time high on 19th Feb ‘25.
The key trading level is at the 6007 level, the consolidation price range and also the previous resistance is now a newly formed support zone. A corrective pullback from the current levels and a bullish bounce back from the 6007 level could target the upside resistance at 6057 followed by the 6106 and 6146 levels over the longer timeframe.
Alternatively, a confirmed loss of the 6007 support and a daily close below that level would negate the bullish outlook opening the way for a further retracement and a retest of 5980 support level followed by 5967 and 5918.
This communication is for informational purposes only and should not be viewed as any form of recommendation as to a particular course of action or as investment advice. It is not intended as an offer or solicitation for the purchase or sale of any financial instrument or as an official confirmation of any transaction. Opinions, estimates and assumptions expressed herein are made as of the date of this communication and are subject to change without notice. This communication has been prepared based upon information, including market prices, data and other information, believed to be reliable; however, Trade Nation does not warrant its completeness or accuracy. All market prices and market data contained in or attached to this communication are indicative and subject to change without notice.

S&P500 -Weekly forecast, Technical Analysis & Trading IdeasMidterm forecast:
5677.80 is a major support, while this level is not broken, the Midterm wave will be uptrend.
Technical analysis:
There is a divergence in RSI and price between the peak at 6107.47 on 2024-12-06 and the peak at 6150.07 on 2025-02-19, the probability of uptrend continuation is decreased and the probability of beginning of downtrend is increased.
While the RSI downtrend #1 is not broken, bearish wave in price would continue.
A peak is formed in daily chart at 6150.05 on 02/19/2025, so more losses to support(s) 6031.27, 5875.31, 5777.28 and minimum to Major Support (5677.80) is expected.
Relative strength index (RSI) is 49.
Supports and Resistances:
5568.78
5398.95
5194.10
5039.36
4944.41
4843.23
4662.99
4544.26
__________________________________________________________________
❤️ If you find this helpful and want more FREE forecasts in TradingView,
. . . . . . . . Hit the 'BOOST' button 👍
. . . . . . . . . . . Drop some feedback in the comments below! (e.g., What did you find most useful? How can we improve?)
🙏 Your support is appreciated!
Now, it's your turn!
Be sure to leave a comment; let us know how you see this opportunity and forecast.
Have a successful week,
ForecastCity Support Team

Can ES Hold Steady? This week’s data and Nvidia earnings (Feb 26) are pivotal.
Options Positioning
Volume: High, with daily averages ~1.5M contracts (CME data trends). Expect ~1.7M this week due to macro catalysts.
Call vs. Put Skew: Call-heavy (1.4:1), reflecting hedging against a pullback and speculative upside bets.
Key Strikes:
NTM (6,000–6,050): GEX high (+$300M), IV ~25%, DEX balanced. Gamma pinning likely keeps NYSE:ES stable early week (Feb 24–25) unless data shifts sentiment.
OTM Calls (6,100–6,150): GEX moderate (+$150M), VEX positive, IV 30%. Heavy OI (40,000 contracts) at 6,100 suggests a volatility spike target if Nvidia beats and PCE cools.
OTM Puts (5,900–5,950): GEX low (+ LSE:80M ), VEX flat, IV ~20%. Put buying reflects downside hedges if PCE surprises hot (>2.7%).
Term Structure: March futures (~6,050) in slight contango, but a volatility event (e.g., Nvidia miss) could flip to backwardation, boosting OTM call IV.
Key Data Releases and Impact
Feb 25 – Consumer Confidence: <110 lifts NYSE:ES to 6,000; >115 pushes to 6,100.
Feb 26 – Q4 GDP: <2.5% supports 5,950–6,000; >3% pressures to 5,900 on inflation fears.
Feb 26 – Nvidia Earnings: Beat holds 6,050–6,100; miss drops to 5,900–5,950.
Feb 28 – PCE: <2.5% lifts to 6,150; >2.7% sinks to 5,900, spiking OTM put volume.
Forecast: Range: 5,900–6,150. Base case: 6,000–6,050 unless PCE or Nvidia disrupts.
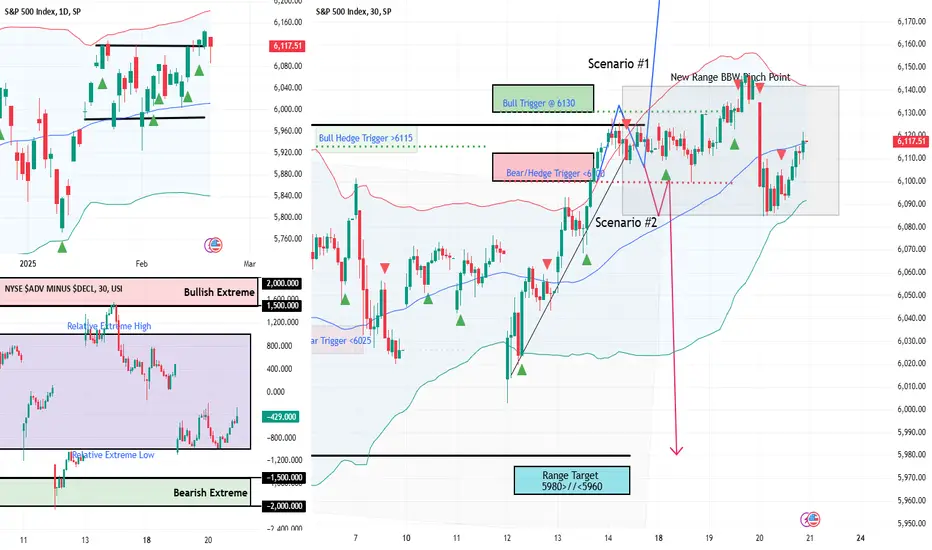
Hurry Up and Wait - The Markets Favourite GameHurry Up and Wait – The Market’s Favourite Game | SPX Market Analysis 21 Feb 2025
These kangaroo markets just won’t quit. Every time we break out of one range, the Bollinger Bands pinch again, locking us into another one.
Meanwhile, other indexes fell out of bed, but SPX? It’s clinging on by "the Bulls".
When will it finally open up and run? Who knows—but until then, I’ll keep finding new ways to say ‘hurry up and wait’.
---
Markets Keep Bouncing, But Not Breaking
It’s like watching a kangaroo on a trampoline—lots of movement, no real progress.
SPX tries to push out of one range 🏋️♂️
Bollinger Bands pinch again, trapping price in a new range 🔄
Other indexes have fallen, but SPX refuses to follow
This makes trading tricky, as every potential breakout is quickly absorbed into another consolidation.
The Bollinger Band Pinch – What It Means
When Bollinger Bands tighten, they signal:
📌 A period of low volatility
📌 A potential breakout coming – but direction unknown
📌 Traders getting frustrated waiting for a real move
Normally, I’d switch to Tag ‘n Turn setups during breakouts, but with volatility still tight, I’ll stick to my 6 money-making patterns instead.
For now, it’s all about waiting for a clean break—no fake moves, no forced trades.
Final Thoughts – When Will the Market Open Up?
📌 The big move is coming—we just don’t know when.
📌 SPX is clinging on, but other indexes are weakening—watch for cracks.
📌 Bollinger Bands are tightening—when they expand, volatility will return.
Until then? It’s back to ‘hurry up and wait’.
---
Fun Fact
📢 Did you know? In 2015, the New York Stock Exchange halted trading for nearly four hours—and the official reason? A “technical glitch”.
💡 The Lesson? Even the biggest, most advanced markets can freeze up, just like we’re seeing with these tight, choppy conditions.
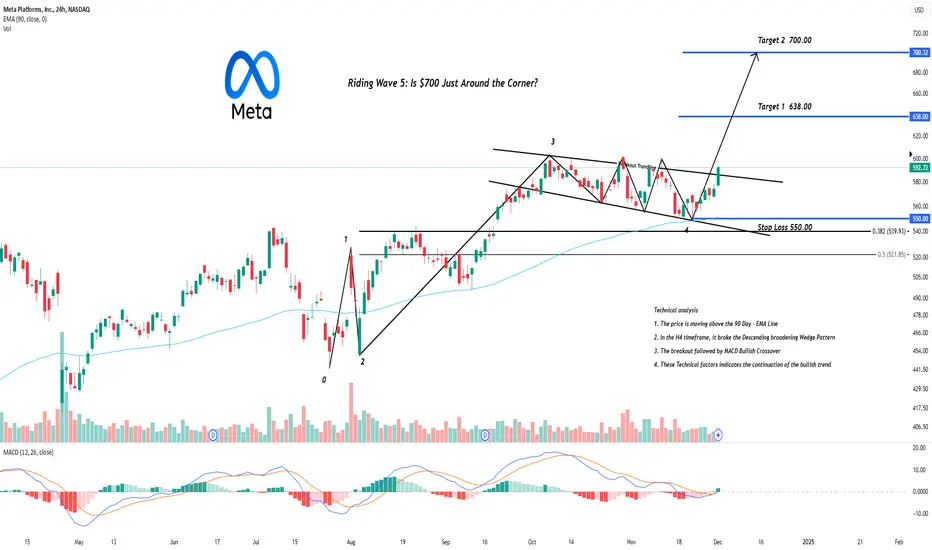
Riding Wave 5: Is $700 Just Around the Corner?Hey Realistic Traders, Will META Bullish Bias Continue ? Let’s Dive In....
In the Daily timeframe, META rebounded above the 38.2% Fibonacci level, marking the completion of wave 4. Within this wave, a Descending broadening wedge pattern was formed. Recently the price has broken out of the pattern. This breakout was further confirmed by a bullish MACD crossover, signaling increasing momentum and strengthening the case for a continued upward move.
Based on these technical signals, I foresee a potential upward movement toward the first target at $638. After reaching this level, a minor pullback is likely before the rally continues toward a new high at $700.
This outlook remains valid as long as the price holds above the stop-loss level at 550.00.
Support the channel by engaging with the content, using the rocket button, and sharing your opinions in the comments below.
Disclaimer: "Please note that this analysis is solely for educational purposes and should not be considered a recommendation to take a long or short position on META.
One More Close and SPY Will be Running!!!Typically I share the signals of my King Trading Momentum Strategy, which combines the 5 EMA crossing above the 13 EMA, RSI strength, favorable momentum as measured by ADX plus evaluating recent volume changes and even a little thing called Beta! But this time it is all about technical analysis. On SPY I originally thought we truncated wave 5 but now that we closed above the all-time high just one more close higher to confirm and this one is off to the races. Today it even retested breakout, held and bounced hard higher into close (super bullish). Impulsive waves are important to me with my momentum strategy, as instead of chasing missed opportunities I simply take the next signal on the hourly, as the strategy is optimized for over 100 beloved equities (if enabled in options)! There is always another trade when SPY goes impulsive! Currently signals have fired on TNA, SPXL, SOXL, TQQQ & UDOW (3x leveraged ETFs) just to name a few. If that doesn't make you feel bullish then I'm not sure what will!

Markets are going PARABOLIC!AMEX:SPY SP:SPX : Jail Break!
🎯$630 incoming!
- Consolidation then breakout
- H5 about to flip green
- WCB thriving
- Volume shelf launch
Not financial advice

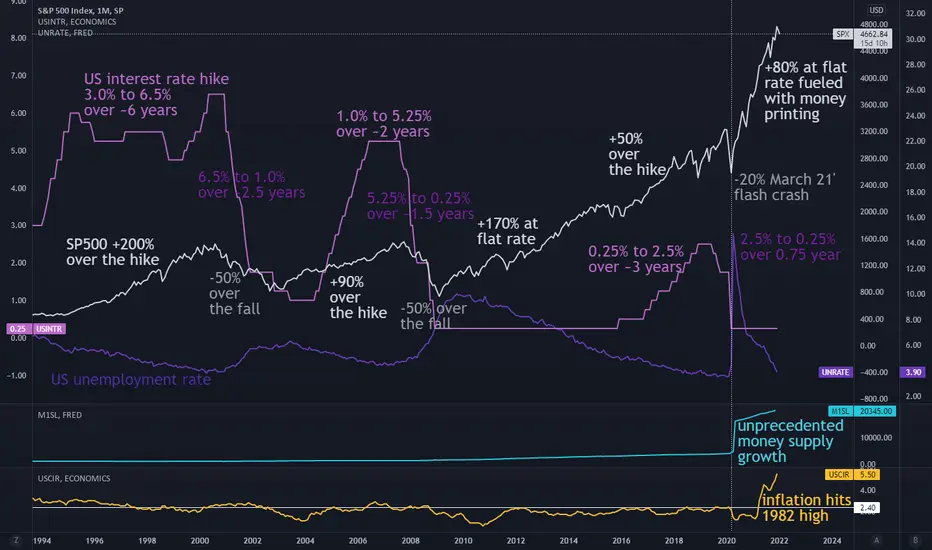
SP500 vs. US intrest rateInterest rate hikes correlated with SP500 growth. Recent growth from the bottom of the March 21' COVID crash was financed by printing trillions US dollars. It allowed to mitigate unemployment rate spike. Inflation started to rise rapidly and interest rates are expected to grow. Will SP500 growth continue? Or is it overpriced by now? Maybe, Shiller P/E ratio for SP500 is now around 39 with median at 16 and maxiumum at 44 on Dec 1999. But how similar is current economics to previous decades? What to expect with unprecedented money supply and modern technologies? Is it time of Modern Monetary Theory?
Maybe I would be able to answer any of the questions if I had any formal economic education ;)
tradingeconomics.com
www.multpl.com
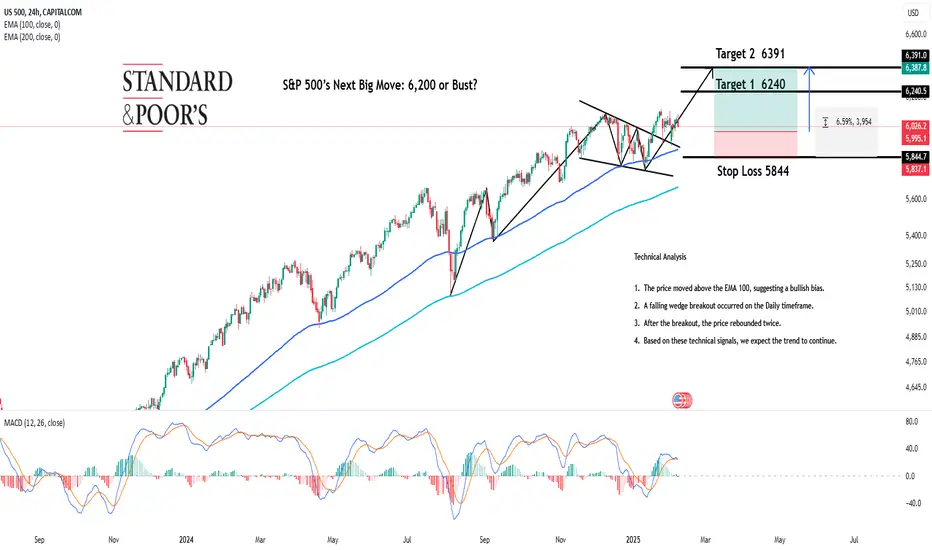
S&P 500’s Next Big Move: 6,200 or Bust?Hey Realistic Traders, Will CAPITALCOM:US500 Move beyond 6,200? Let’s dive into the analysis...
On the daily chart, the S&P 500 is trading above both the EMA-100 and EMA-200, confirming a robust bullish trend. This momentum was reinforced by a falling wedge breakout, a pattern that typically signals the continuation of bullish pressure. Additionally, the price tested the upper trendline twice and bounced off each time, further underlining the strength of the upward move.
Considering these strong technical signals, the price is likely to move downward toward the first target at 6.240 or potentially the second target at 6.391.
However, this bullish scenario depends on the price staying below the critical stop-loss level at 5844
Support the channel by engaging with the content, using the rocket button, and sharing your opinions in the comments below.
Disclaimer: “Please note that this analysis is solely for educational purposes and should not be considered a recommendation to take a long or short position on S&P500”.
Bullish continuation?S&P500 (US500) is falling towards pivot which has been identified as a pullback support and could bounce to the 1st resistance which acts as a pullback resistance.
Pivot: 6,034.09
1st Support: 5,984.27
1st Resistance: 6,125.76
Risk Warning:
Trading Forex and CFDs carries a high level of risk to your capital and you should only trade with money you can afford to lose. Trading Forex and CFDs may not be suitable for all investors, so please ensure that you fully understand the risks involved and seek independent advice if necessary.
Disclaimer:
The above opinions given constitute general market commentary, and do not constitute the opinion or advice of IC Markets or any form of personal or investment advice.
Any opinions, news, research, analyses, prices, other information, or links to third-party sites contained on this website are provided on an "as-is" basis, are intended only to be informative, is not an advice nor a recommendation, nor research, or a record of our trading prices, or an offer of, or solicitation for a transaction in any financial instrument and thus should not be treated as such. The information provided does not involve any specific investment objectives, financial situation and needs of any specific person who may receive it. Please be aware, that past performance is not a reliable indicator of future performance and/or results. Past Performance or Forward-looking scenarios based upon the reasonable beliefs of the third-party provider are not a guarantee of future performance. Actual results may differ materially from those anticipated in forward-looking or past performance statements. IC Markets makes no representation or warranty and assumes no liability as to the accuracy or completeness of the information provided, nor any loss arising from any investment based on a recommendation, forecast or any information supplied by any third-party.

Food for Thought SPXEW (S&P equal weight) vs SPX (S&P500) This is the SPXEW (S&P 500 equal weight) vs the SPX (S&P500). Just some food for thought. Not bullish or bearish but people have pointed this out to me.

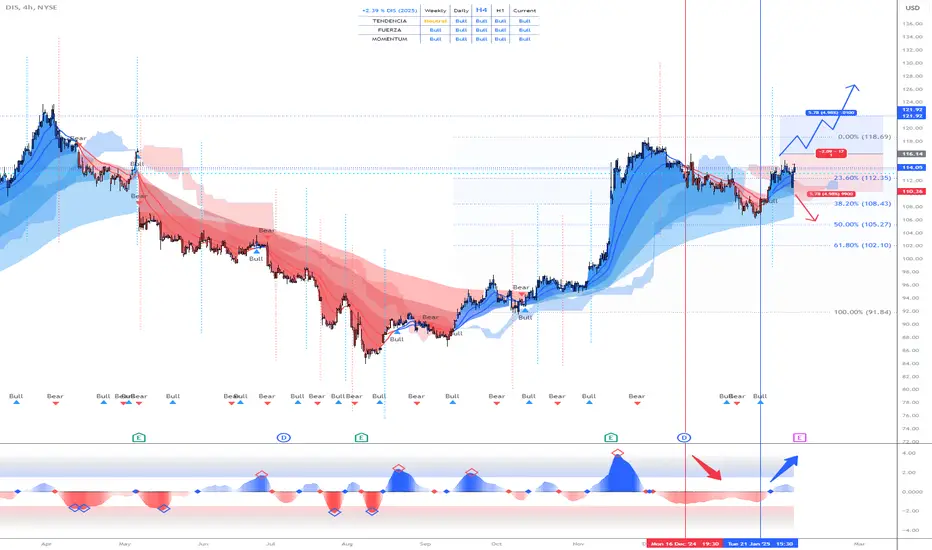
WALT DISNEY: New maximums with the permission of its results!The Walt Disney Company is a company engaged in various activities, such as theme parks, tourist services, films and television, publishing and consumer products, and interactive services. The brands of The Walt Disney Company include, among others, ABC Entertainment.
--> What is the technical aspect?
If we look at the chart, the technical aspect is clearly bullish ( Bull ).
After making a strong retracement of almost 50% Fibonacci, on January 21 the price gave us the first bullish warning ( Bull ), which was confirmed 2 days later. Since that day, we considered the retracement phase to be over and a new bullish phase ( Bull ) began on the way to new highs. But there was one last hurdle to overcome, the 116 zone.
--> Will it be able to overcome the zone?
Technically, it is very likely that it will overcome it without problems, but tomorrow it will present results, and we already know that if the results are not good, the price will fall sharply.
--> What can we do?
2 options:
1) AGGRESSIVE PROFILE: Ignore that it will present results tomorrow.
2) CONSERVATIVE PROFILE: Wait until Thursday to make decisions.
If our profile is aggressive, we will operate as follows:
--------------------------------------
Strategy to follow:
ENTRY: We will open 2 long positions if the price exceeds 116
POSITION 1 (TP1): We close the first position in the 121.90 area (+5%)
--> Stop Loss at 110.36 (-5%).
RATIO: (1:1)
POSITION 2 (TP2): We open a Trailing Stop type position.
--> Initial dynamic Stop Loss at (-5%) (coinciding with 110.36 of position 1).
--> We change the dynamic Stop Loss to (-1%) when the price reaches TP1 (121.90).
-------------------------------------------
SET UP EXPLANATIONS
*** How do we know which 2 long positions to open? Let's take an example: If we want to invest 2,000 euros in the stock, what we do is divide that amount by 2, and instead of opening 1 position of 2,000, we will open 2 positions of 1,000 each.
*** What is a Trailing Stop? A Trailing Stop allows a trade to continue gaining value when the market price moves in a favorable direction, but automatically closes the trade if the market price suddenly moves in an unfavorable direction by a certain distance. That certain distance is the dynamic Stop Loss.
-->Example: IF the dynamic Stop Loss is at -1%, it means that if the price drops by -1%, the position will be closed. If the price rises, the Stop Loss also rises to maintain that -1% on increases, therefore, the risk is increasingly lower until the position becomes profitable. In this way, very solid and stable price trends can be taken advantage of, maximizing profits.
This Morning we are Coming Down from the Election Sugar HighAlthough the larger pattern has yet to flash red and break down, we may have started that eventual descent this morning.

SPY | The End of a 16-Year Bull Cycle? Major Correction Ahead?🔎 Overview:
The S&P 500 ETF (SPY) has been in a massive bull run since the 2009 bottom, forming a clear 5-wave structure based on Elliott Wave Theory. Now, the market is showing multiple top signals, suggesting that a major correction may be imminent.
📉 Key Warning Signs:
1️⃣ 5-Wave Completion:
The 5th wave is approaching a key Fibonacci extension level (0.618 of Waves 1-3), a common reversal zone for extended moves.
The previous wave count has been respected perfectly, reinforcing this structure.
2️⃣ Fibonacci Circles Alignment:
Price is reaching the outermost Fibonacci arc, a historically significant zone where reversals have occurred.
The market has reacted strongly in previous arcs, indicating this could be another turning point.
3️⃣ RSI Bearish Divergence:
The Relative Strength Index (RSI) is making lower highs while price is making higher highs—a classic bearish divergence signal.
Previous similar divergences led to major corrections, including 2000, 2008, and 2021 dips.
4️⃣ Overextended Market Conditions:
Volume is declining despite new highs, signaling weak buying pressure.
Sentiment is euphoric, typically a late-stage bull market characteristic.
📊 Possible Scenarios:
🟢 Bullish Case: If SPY breaks and sustains above the 0.786 Fibonacci level (~672), we could see an extension.
🔴 Bearish Case: A break below 600 and a weekly close under 575 would confirm the start of a major correction back to the 350-400 zone (previous wave 4 region).
🚨 Final Thoughts:
The technical evidence suggests that SPY is in a late-stage bull cycle, and the risk of a major pullback is high. While timing exact tops is difficult, long-term investors should be cautious, and traders may want to start looking at hedging strategies or taking partial profits.
📢 What’s your take? Are we near a major top, or is there more upside left? Drop your thoughts in the comments! 👇
#SPY #SP500 #StockMarket #ElliottWave #Fibonacci #RSI #BearishDivergence #Trading #Investing 🚀📉

Weekly Market Forecast Feb 2-7thThis is an outlook for the week of Feb 2-7th.
In this video, we will analyze the following FX markets:
ES \ S&P 500
NQ | NASDAQ 100
YM | Dow Jones 30
GC |Gold
SiI | Silver
PL | Platinum
HG | Copper
The indices were not easy to trade last week, as there were plenty of fundamentals at play. However, they are relatively still strong, and I am looking for further gains next week.
NFP week, imo, is best traded Mon-Wed. Thurs will likely see consolidation until the NFP news announcement Friday morning. I will look to fade the news release on Friday for NY Session.
Enjoy!
May profits be upon you.
Leave any questions or comments in the comment section.
I appreciate any feedback from my viewers!
Like and/or subscribe if you want more accurate analysis.
Thank you so much!
Disclaimer:
I do not provide personal investment advice and I am not a qualified licensed investment advisor.
All information found here, including any ideas, opinions, views, predictions, forecasts, commentaries, suggestions, expressed or implied herein, are for informational, entertainment or educational purposes only and should not be construed as personal investment advice. While the information provided is believed to be accurate, it may include errors or inaccuracies.
I will not and cannot be held liable for any actions you take as a result of anything you read here.
Conduct your own due diligence, or consult a licensed financial advisor or broker before making any and all investment decisions. Any investments, trades, speculations, or decisions made on the basis of any information found on this channel, expressed or implied herein, are committed at your own risk, financial or otherwise.

Nvidia Stock Goes 'DeepSeek', Ahead of Earnings CallNvidia's stock has experienced significant volatility recently, largely influenced by the emergence of a new AI model from Chinese startup DeepSeek. This model, known as R1, reportedly rivals the capabilities of advanced models from major U.S. tech companies like OpenAI and Google, but does so using less powerful and cheaper chips. This development has raised concerns among investors about the sustainability of Nvidia's market dominance and the high valuations of U.S. tech stocks.
Impact of DeepSeek on Nvidia Stock
Stock Performance.
On January 27, 2025, Nvidia's shares plummeted by over 16%, marking its largest intraday drop since August 2023. This decline wiped more than half-a-trillion US dollars from Nvidia's market capitalization. The stock fell approximately 12.5% in early trading, reflecting widespread investor anxiety about the implications of DeepSeek's advancements.
Investor Sentiment.
The introduction of DeepSeek's AI model has prompted a reevaluation of the heavy investments made by U.S. tech firms in AI technologies. Analysts noted that if DeepSeek can achieve competitive results with lower costs, it may lead to reduced demand for Nvidia's high-end chips. This has caused a ripple effect across the tech sector, with other semiconductor stocks also experiencing declines.
Market Reactions.
The broader tech market was affected as well, with the Nasdaq index falling nearly 4% in pre-market trading. Other companies linked to AI and technology also saw significant drops; for instance, ASML and Broadcom fell by 7% and over 12%, respectively.
Perspectives by Fundamental and Technical Analyst
Skepticism About DeepSeek.
While some analysts expressed skepticism about DeepSeek's ability to compete effectively without advanced chips, they acknowledged that its success could force U.S. companies to reconsider their strategies regarding AI investments and efficiency. For example, Citi analysts maintained a "buy" rating on Nvidia, suggesting that major U.S. companies are unlikely to shift away from using Nvidia's GPUs in the near term.
Concerns Over Valuations.
Analysts at Wedbush highlighted that U.S. tech stocks are currently valued at premium levels, which makes them vulnerable to any disruptions in perceived technological superiority. They noted that even small developments like those from DeepSeek could significantly impact stock prices due to inflated expectations surrounding AI advancements.
Future Outlook.
Despite the immediate negative impact on Nvidia's stock, some analysts believe that concerns may be exaggerated and that U.S. firms are still well-positioned for long-term growth in AI technologies. They argue that while DeepSeek's model is impressive, it does not yet match the comprehensive infrastructure and ecosystem that American tech giants have developed.
Technical Outlook.
The main technical graph for Nvidia stock (1-week resolution) indicates on epic breakthrough of upside channel, which has been alive for more than last two years, until ̶D̶o̶n̶a̶l̶d̶ ̶T̶r̶u̶m̶p̶ someone entered ̶a̶ ̶c̶h̶a̶t̶ White House.
Ahead of Nvidia Earnings call (scheduled on February, 26) our 'fancy-nancy' Analyst Team is strongly against any Nvidia stock purchase below ready to be lost, $130 per share level.
Potentially 52-week SMA can support a stock for a while near $115 a share, otherwise we believe Nvidia stock will dive below $100 level again.
Conclusion
In summary, the rise of DeepSeek represents a pivotal moment for Nvidia and the broader tech sector, challenging existing assumptions about AI development costs and market dynamics. The ongoing situation will likely lead to further scrutiny of investment strategies within the industry as stakeholders assess the long-term implications of this emerging competition.

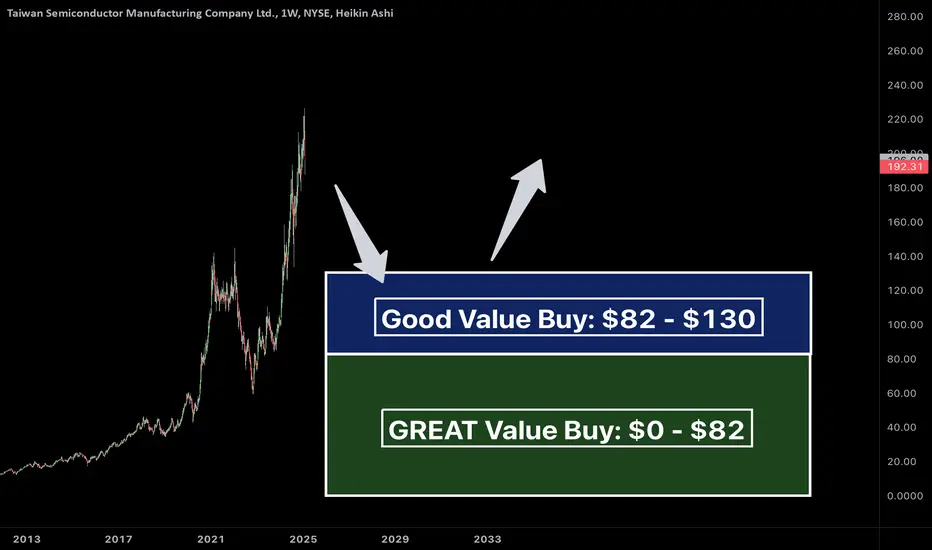
$TSM "Buy The Dip" Value AreasWith the release of DeepSeek, it sent NYSE:TSM down a bit. If this continues over the coming weeks/months, here are some value areas to "buy the dip" if you're looking to get in or add more.
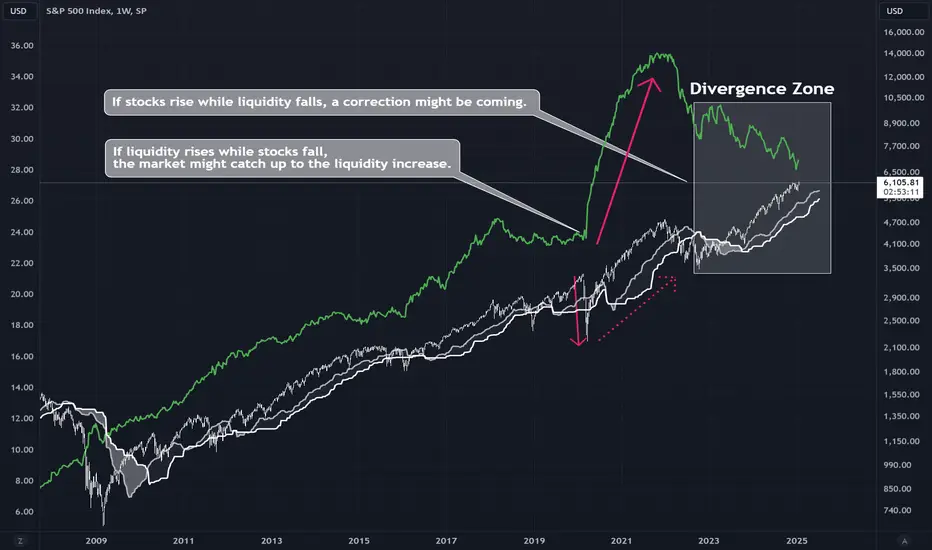
Global Liquidity Index Overlaid on S&P 500 Tracking the Global Liquidity Index with the S&P 500 helps understand liquidity's impact on market performance and predict future moves. The GLI offers a unified view of central bank balance sheets, converted to USD, excluding currency-pegged banks, with reliable data since 2007.
Rising liquidity often leads to market growth, while declining liquidity could signal pullbacks or increased volatility.
Liquidity Spikes: Sudden rises in the GLI may boost the S&P 500.
Liquidity Dips: Falling liquidity may signal market decline due to higher volatility and trading difficulties.
Divergence between the GLI & S&P 500:
If stocks rise while liquidity falls, a correction might be coming. If liquidity rises while stocks fall, the market might catch up to the liquidity increase.
The GLI indicates that risk appetite is starting to decline. High liquidity encourages risk-taking; low liquidity leads to safer investments, increasing volatility and potential market declines.
Thanks for Liking and Sharing! 🥕🐇
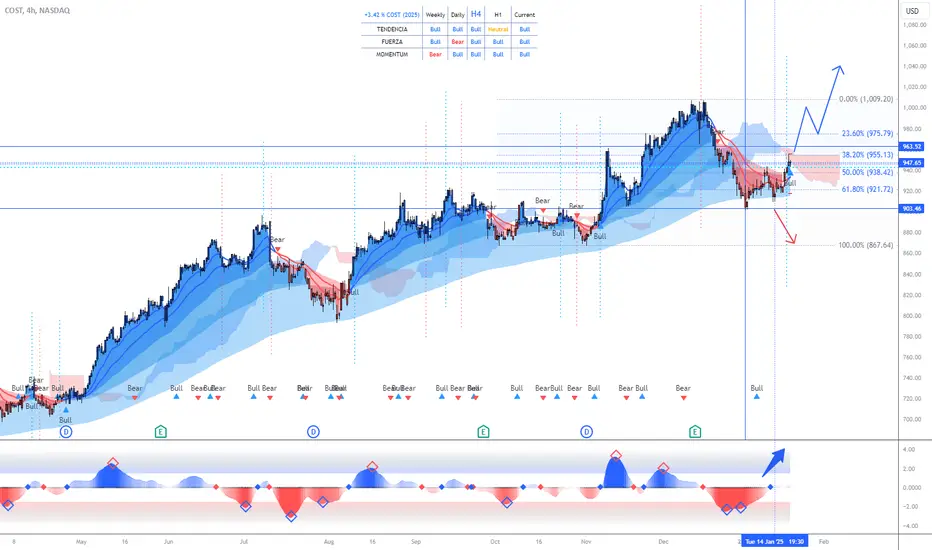
COSTCO: Correction phase may be coming to an END!! Costco Wholesale is an international chain of hypermarkets with a Price Club format whose objective is to provide the best prices on quality products.
At Costco you can find a large selection of exclusive products, including hospitality products, confectionery, household appliances, television, car parts, tires, toys, electronic devices, sports items, jewelry, watches, cameras, audiovisual, books, household products, health, beauty, furniture, equipment and office products... all with the best quality.
It has large stores in the United States, Puerto Rico, Canada, Mexico, Taiwan, Korea, Japan, the United Kingdom, Australia, Spain, France, Iceland and China.
--> What is the technical aspect?
If we look at the chart, the technical aspect is impeccable bullish in a retracement phase, but the retracement phase may be coming to an END!!.
After making a strong retracement overcoming the 61.8% Fibonacci zone, on January 7 the price gave us the first bullish warning (Bull). The next one to warn us of bullish strength (Bull) was the oscillator on January 13, and finally, yesterday, the FORCE aligned with the TREND and the MOMENTUM (see table), leaving everything bullish (Bull) ready to attack highs.
--> What do we need to attack highs?
That it overcomes its last important resistance which is the 963 area.
-------------------------------------
Strategy to follow:
ENTRY: We will open 2 long positions if the H4 candle closes above 963
POSITION 1 (TP1): We close the first position in the 999 area (+4%)
--> Stop Loss at 899 (-6.2%).
POSITION 2 (TP2): We open a Trailing Stop type position.
--> Initial dynamic Stop Loss at (-6.2%) (coinciding with the 899 of position 1).
---We modify the dynamic Stop Loss to (-1%) when the price reaches TP1 (999).
-------------------------------------------
SET UP EXPLANATIONS
*** How do we know which 2 long positions to open? Let's take an example: If we want to invest 2,000 euros in the stock, what we do is divide that amount by 2, and instead of opening 1 position of 2,000, we will open 2 positions of 1,000 each.
*** What is a Trailing Stop? A Trailing Stop allows a trade to continue gaining value when the market price moves in a favorable direction, but automatically closes the trade if the market price suddenly moves in an unfavorable direction by a certain distance. That certain distance is the dynamic Stop Loss.
-->Example: If the dynamic Stop Loss is at -1%, it means that if the price drops by -1%, the position will be closed. If the price rises, the Stop Loss also rises to maintain that -1% in the rises, therefore, the risk is increasingly lower until the position becomes profitable. In this way, very solid and stable price trends can be taken advantage of, maximizing profits.
M.A.G.A's STORYTAIL (SP500)If I can reach the stars, pull one down for you
Shine it on my heart so you could see the truth
That this love I have inside is everything it seems
But for now I find, it's only in my dreams
And I can change the world
I will be the sunlight in your universe
You would think my love was really something good
Baby, if I could change the world
If I could be king, even for a day
I'd take you as my queen, I'd have it no other way
And our love would rule in this kingdom we have made
'Till then, I'd be a fool wishing for the day
And I can change the world
I would be the sunlight in your universe
You would think my love was really something good
Baby, if I could change the world
Baby, if I could change the world
I could change the world
I would be the sunlight in your universe
You would think my love was really something good
Baby, if I could change the world
Baby, if I could change the world
Baby, if I could change the world
Eric Clapton
