Weekly Forex Forecast Nov. 18 - 22: SP500, NAS, DOW, GOLDThis is the Weekly Forex Forecast for Nov 18 -22nd.
The Big 3 Indexes started to pullback last week from there elections fueled rallies. Patience is required, as we look for confirmations of a market shift from bullish to bearish.
Gold also retraced last week, and may may struggle against a surging USD. Patience here will benefit traders, as we wait until the market tips its hand.
Check the comments section below for updates regarding this analysis throughout the week.
Enjoy!
May profits be upon you.
Leave any questions or comments in the comment section.
I appreciate any feedback from my viewers!
Like and/or subscribe if you want more accurate analysis.
Thank you so much!
Disclaimer:
I do not provide personal investment advice and I am not a qualified licensed investment advisor.
All information found here, including any ideas, opinions, views, predictions, forecasts, commentaries, suggestions, expressed or implied herein, are for informational, entertainment or educational purposes only and should not be construed as personal investment advice. While the information provided is believed to be accurate, it may include errors or inaccuracies.
I will not and cannot be held liable for any actions you take as a result of anything you read here.
Conduct your own due diligence, or consult a licensed financial advisor or broker before making any and all investment decisions. Any investments, trades, speculations, or decisions made on the basis of any information found on this channel, expressed or implied herein, are committed at your own risk, financial or otherwise.
Sp500index

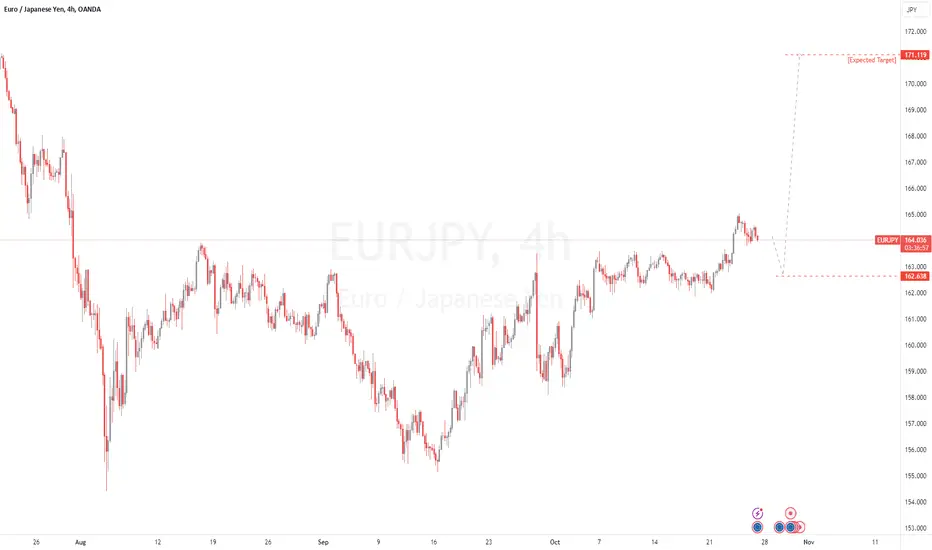
EURJPY | MarketoutlookThe policy divergence between the US Fed and SNB supports the pair at lower levels.
Jobless claims dropped to 227,000 for the week ending October 19, down from 242,000 the week before, suggesting some stability in the labor market. The four-week moving average rose by 6,750, reaching 231,000, which indicates that jobless claims are still showing fluctuations despite the recent decline.
The S&P Global Flash U.S. Manufacturing PMI increased slightly to 47.8 in October, up from 47.3 in September. However, this still shows that manufacturing activity is contracting for the fourth month in a row. On the other hand, the Flash Services PMI rose to 51.5, indicating modest growth in the services sector, which is important since it makes up a large part of the U.S. economy.
CARS.COM LIKELY TO PERFORM WELL IN TECH SECTORIn the Software industry under Technology sector, CARS.COM technically, the stock has been
gathering bullish momentum, a pullback to its demand zone is what is left.
N.B!
- CARS price might not follow the drawn lines . Actual price movements may likely differ from the forecast.
- Let emotions and sentiments work for you
- ALWAYS Use Proper Risk Management In Your Trades
#CARS
#NYSE
#NASDAQ
#SP500

DESPITE Q3 LOSS, AST SPACEMOBILE REMAINS A BUYThe level between 19.30 - 23 looks strong for ASTS, holding price since late September; and with Q3 loss declared by the company, the price still got rejected at this level. There is high possibility that buyers are accumulating at this mentioned level. Will ASTS witness upward movement in coming weeks. A price close below 17 is not favourable!
N.B!
- ASTS price might not follow the drawn lines . Actual price movements may likely differ from the forecast.
- Let emotions and sentiments work for you
- ALWAYS Use Proper Risk Management In Your Trades
#ASTS
#NASDAQ
#SP500

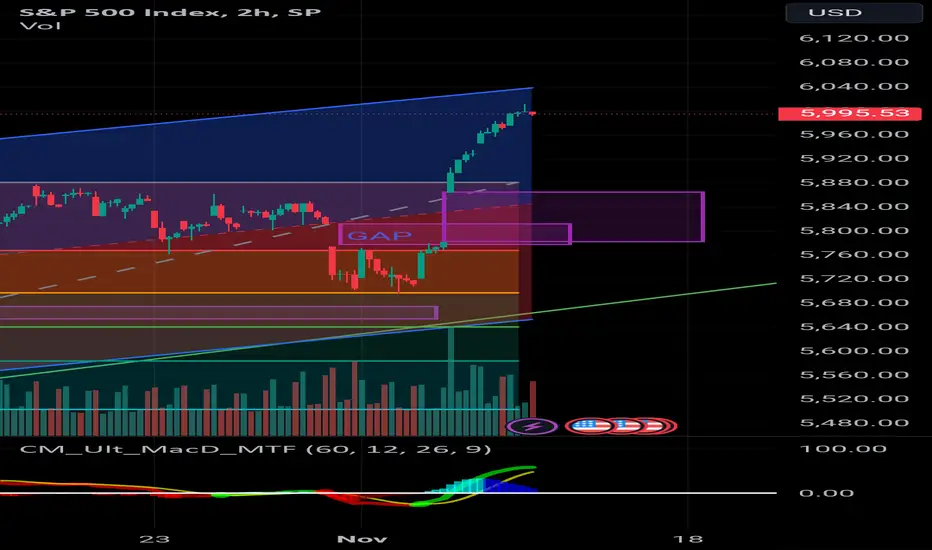
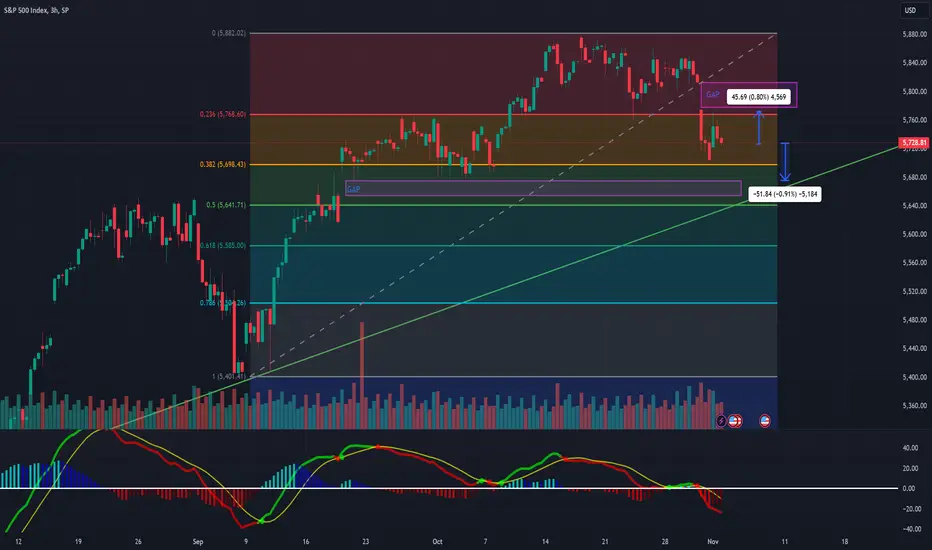
SP500 double GapCould we see SP500 in the 5800 prices in the upcoming days or this double gap will be closed in months or weeks?
Always do your research
US500 Bearish Trend in Coming DaysI am looking Bearish Trend of Us500 in Coming Days, Monthly Candle Sweep Previous Candle.

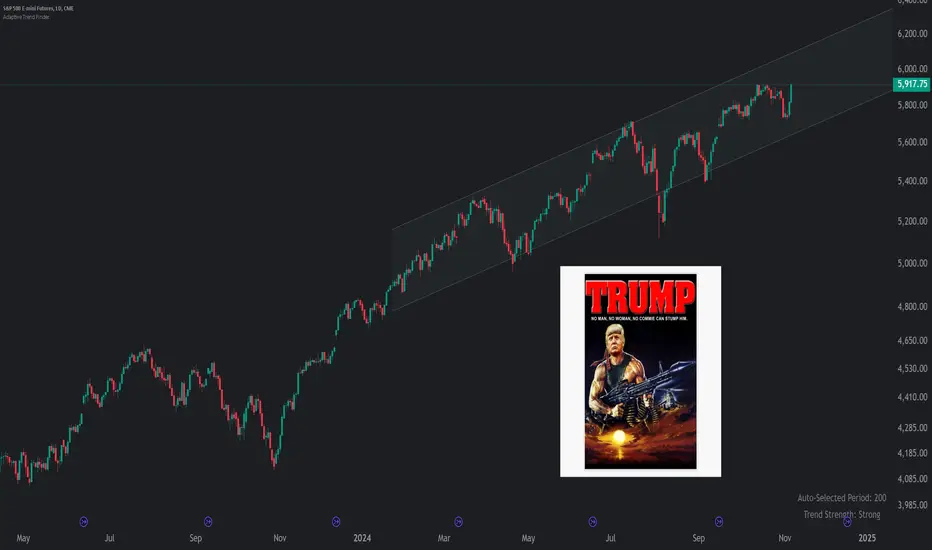
S&P 500 E-mini FuturesAttention, the terrible child is back!
A strong man in the White House.
The graph speaks for itself, the market has chosen.
Make your opinion, before placing an order.
► Thank you for boosting, commenting, subscribing!
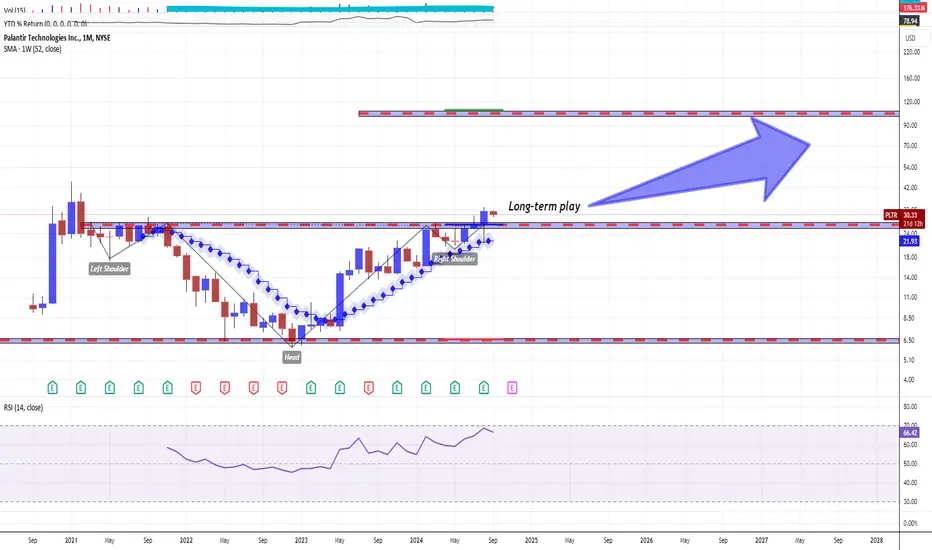
Palantir Bullish Long-Term PlayPalantir shares rose to a yearly high near $33 in the evening trading session on Friday, September 6, after announcement Palantir joins the S&P 500 index.
Palantir was one of the strongest contenders for inclusion in the broad market S&P500 index.
This inclusion, as well as Dell (DELL), comes after tech companies Super Micro (SMCI) and Crowdstrike (CRWD) also joined the index earlier this year.
Technical 1-month graph indicates on Reversed Head-and-Shoulders structure in development.
Potentially it can bring Palantir stocks, up to $100 per share over the next several years.
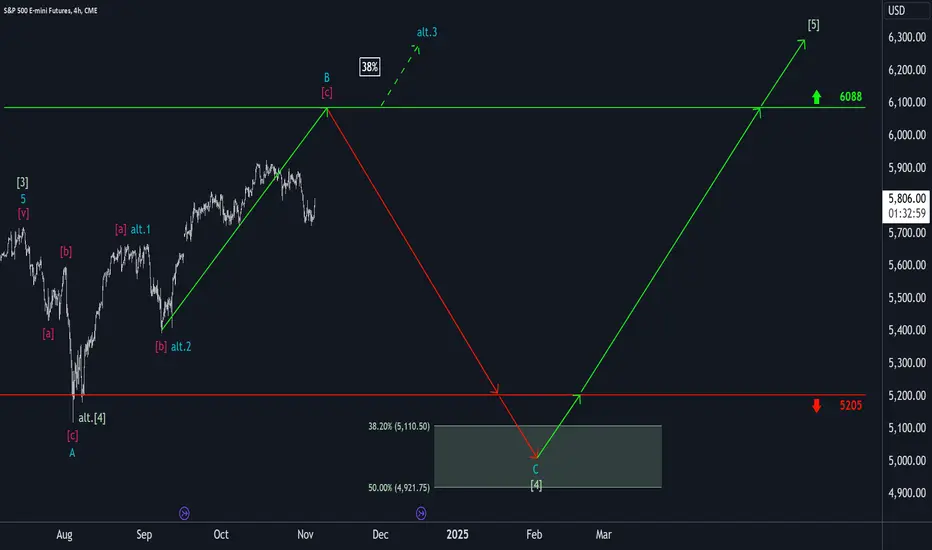
S&P500: More Upward Potential!We still ascribe more upward potential to the S&P’s turquoise wave B – up to the resistance at 6088 points. At this level, we expect a transition into the same-colored wave C, which should push the index down into our green Target Zone between 5110 and 4921 points. Within this Zone, the larger wave should find its final low, which should provide potential entry points for long positions. A stop-loss can be set 1% below this Zone for risk management. However, if the index surpasses the 6088 points mark directly, our alternative scenario (probability: 38%) will come into play: it suggests that the wave low is already in place.
SP500 Short Term Sell IdeaH4 - Bearish trend pattern
Currently it looks like a pullback is happening
Until the strong resistance zone holds I expect the price to move lower further after pullbacks.

SP500 Double gap analysis ideaWe can see that there are 2 gaps in the SP500, both are at similar distances, which one will close first?
Always do your own research
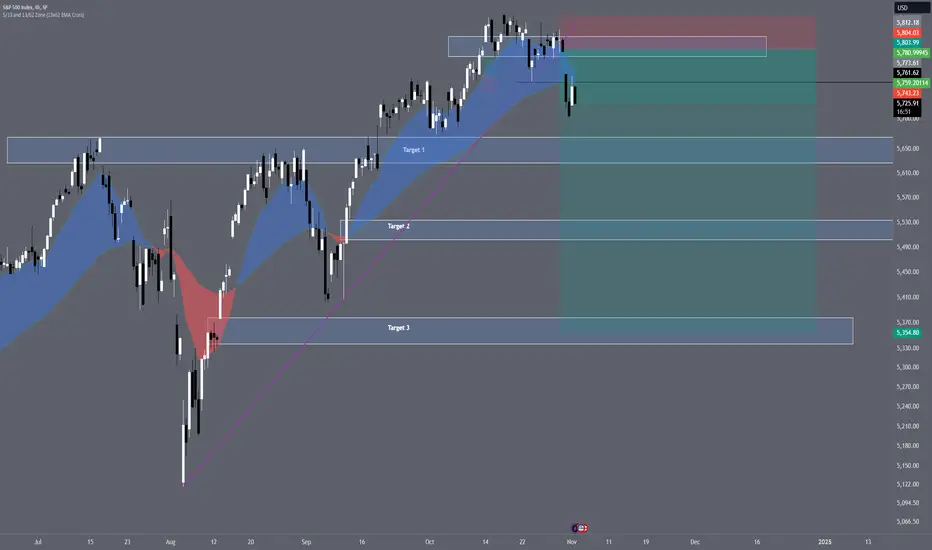
Stock Market ft. The BIG SHORT.Election coming, looks to be priced in as we speak, expect a drop, probably more severe than my chart if the conditions are met BELOW..
Conservative levels to short above (no guarantee we are coming back to those levels) as the futures market can continue to plummet as early as Monday next week.
I expect a heavy forecast of rain up until the election and after, we are about to see some crazy $%^& in the next few months,
Price is weighted on the weekly, to Target 1, if that level doesn't hold we will see target 2 and target 3 QUICK,
If my price reacts the way I think it is, I will be dropping a multi-year monthly chart to follow,
Good luck traders.
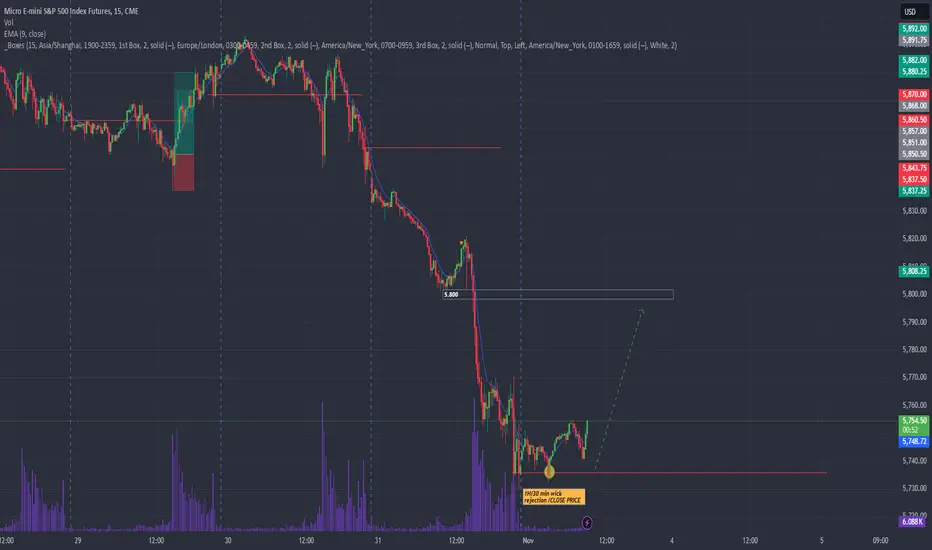
Trading Plan ES TODAYCurrent Position: Average entry price stands at 5741, ATM.
Trading Plan:
Targeting a push toward 5800, with plans to exit prior to the U.S. market open.
Although seller momentum appears depleted, I remain cautious about the likelihood of a sustained rally.
Intraday Strategy:
Hold a bullish outlook until the market open.
Anticipate a retracement toward yesterday’s close, at which point I intend to re-enter long positions.
Monitoring Approach: I will closely supervise the U.S. market open trades with heightened scrutiny compared to pre-market positioning.
DAX TRADING IDEAHi again traders!
Here to bring you'all this idea about a bullish movement on DAX. Not a long term buy but a fast trade. The idea is to close it today before the market closes.
Why I think so?
The index has been on a three-day consecutive bearish movement. Dropping 500. After a manipulation, price seems to be holding on 5 minutes - 15 minutes frames, showing us a clear accumulation zone leaded by EMA9 and EMA50 ( 5 mins).
My potential profit is 104 points above the marked entry. Althought I think price is pumping on a few hours, could be possible to see a quick retracement before that.

Nightly $SPY Prediction for 10.31.2024🔮
⏰7:30am
Challenger Job Cuts y/y
⏰8:30am
Core PCE Price Index m/m
Employment Cost Index q/q
Unemployment Claims
Personal Income m/m
Personal Spending m/m
⏰9:45am
Chicago PMI
⏰10:30am
Natural Gas Storage
#trading #stock #stockmarket #today #daytrading #swingtrading #charting #investing

VIX!!!HS, the VIX is about to crash. I'm accumulating SDIX (short VIX) and buying puts of UVXY at every short term rally. SP500 heading to ATH.

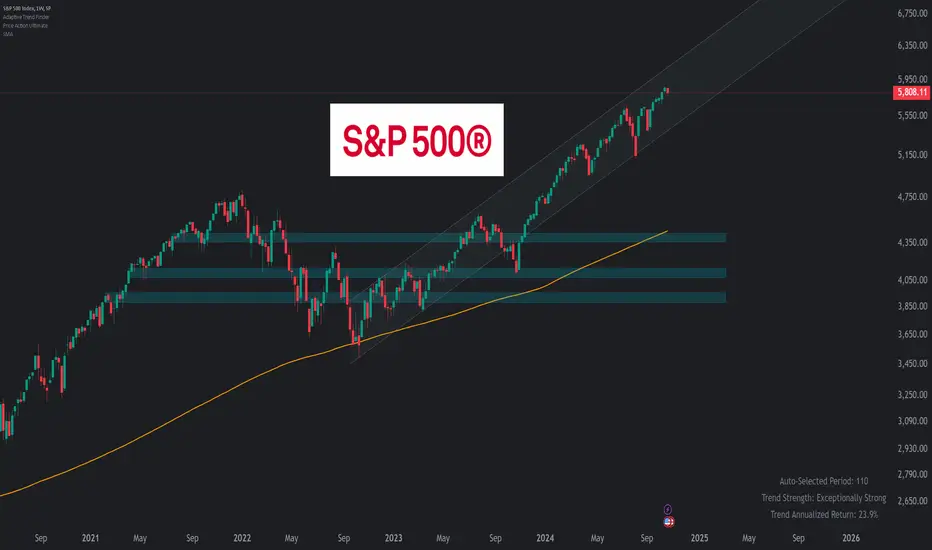
SPX Week in Review (log)Hello community,
A quick look at the SPX trend weekly.
We are still in an uptrend, as shown by the indicator.
It remains to be seen whether the US elections will shake up the market.
The chart shows the volume accumulation zones.
The orange line represents the 200-period simple moving average.
For my part, I am not worried.
Make your own opinion before placing an order.
► Thank you for boosting, commenting, subscribing!
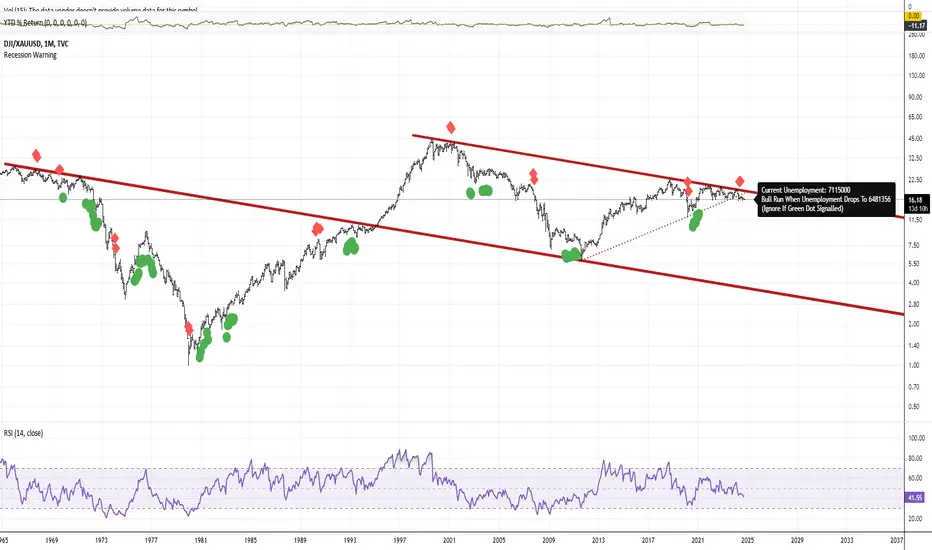
Gold Rush Knocks Dow Jones Industrial Average Off Its FeetGold as a value asset continues to shine brightly, having reached a new all-time high near $2,600 on Monday, September 16, marking the 30th all-time high for gold prices this year, 2024.
It is also noteworthy that the Dow Jones Industrial Average (DJI) to gold (XAUUSD) ratio is gravitating to ever lower values, while the time-tested indicator of a U.S. recession, based on the US labor market behavior signaling that one is imminent.
Thanks to @chinmaysk1 and its full of worth open source script Recession And Bull Run Warning, that I truly believe is one of the best over many.
WEEKLY FOREX FORECAST OCT. 14-18th: BUY THE S&P 500? YES!The S&P 500 looks to have supporting structure for higher prices. The bullish momentum is there, and Friday's close put that on display.
There is some potential for a limited pullback, though. But I would view it as a better price for a possible long entry.
What are your thoughts....?
Check the comments section below for updates regarding this analysis throughout the week.
Enjoy!
May profits be upon you.
Leave any questions or comments in the comment section.
I appreciate any feedback from my viewers!
Like and/or subscribe if you want more accurate analysis.
Thank you so much!
Disclaimer:
I do not provide personal investment advice and I am not a qualified licensed investment advisor.
All information found here, including any ideas, opinions, views, predictions, forecasts, commentaries, suggestions, expressed or implied herein, are for informational, entertainment or educational purposes only and should not be construed as personal investment advice. While the information provided is believed to be accurate, it may include errors or inaccuracies.
I will not and cannot be held liable for any actions you take as a result of anything you read here.
Conduct your own due diligence, or consult a licensed financial advisor or broker before making any and all investment decisions. Any investments, trades, speculations, or decisions made on the basis of any information found on this channel, expressed or implied herein, are committed at your own risk, financial or otherwise.

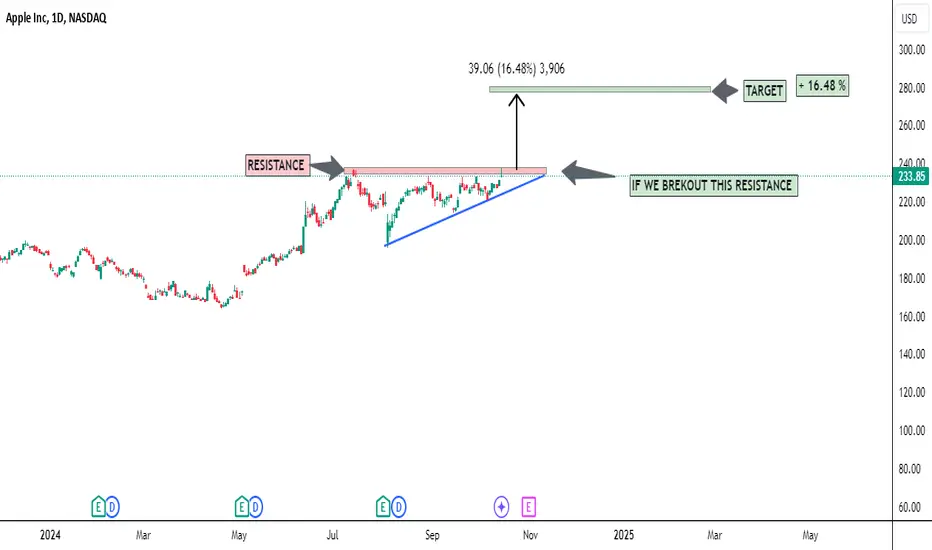
Apple – Triangle Pattern with Breakout PotentialApple is currently forming a triangle pattern on the chart. If we break through the resistance, my next target is in the green zone, which I've identified as the next key level.
Strategy: I’m watching for a breakout from the triangle, and if it occurs, I’ll be targeting the green zone as the next potential profit area.
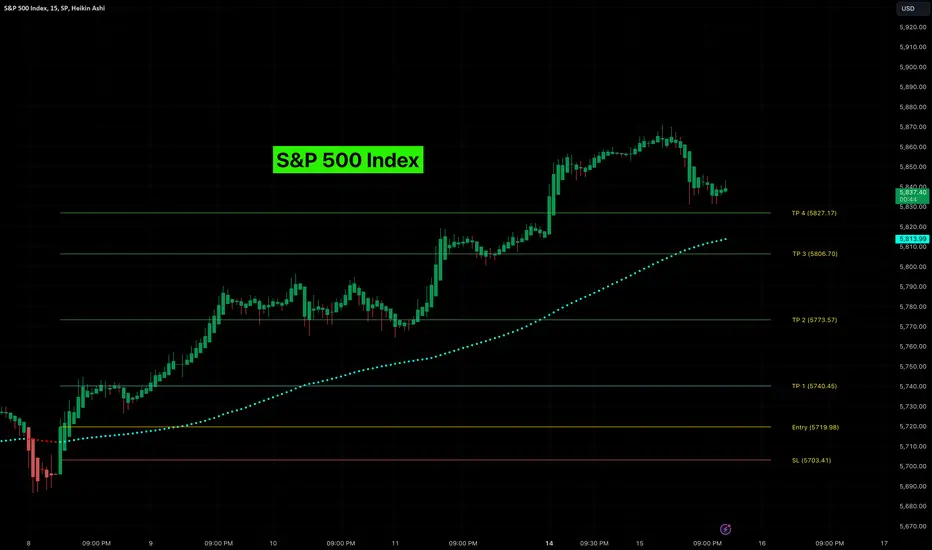
S&P 500 (SPX) Hits All Targets! Bullish Rally CompletesThe S&P 500 Index has shown strong bullish momentum, with the long trade successfully reaching all profit targets.
Key Levels
Entry: 5719.98 – The long position was entered as the price broke above this level, confirming bullish sentiment.
Stop-Loss (SL): 5703.41 – Positioned below recent support to protect against potential downside risk.
Take Profit 1 (TP1): 5740.45 – The first target was hit, confirming the upward momentum.
Take Profit 2 (TP2): 5773.57 – The second target was achieved as the bullish trend continued.
Take Profit 3 (TP3): 5806.70 – The third target was reached, indicating continued strength in the market.
Take Profit 4 (TP4): 5827.17 – The final profit target was reached, marking a highly successful long trade.
Trend Analysis
The price is well above the Risological Dotted trendline, indicating a strong bullish trend. The steady upward movement suggests that the market sentiment is favorable for further gains, although all targets have been hit, marking the trade's conclusion.
The long trade on the S&P 500 Index successfully hit all profit targets, with the final target at 5827.17 signaling a strong rally. The upward momentum was supported by the Risological Dotted trendline, reflecting solid market conditions for bullish trades.
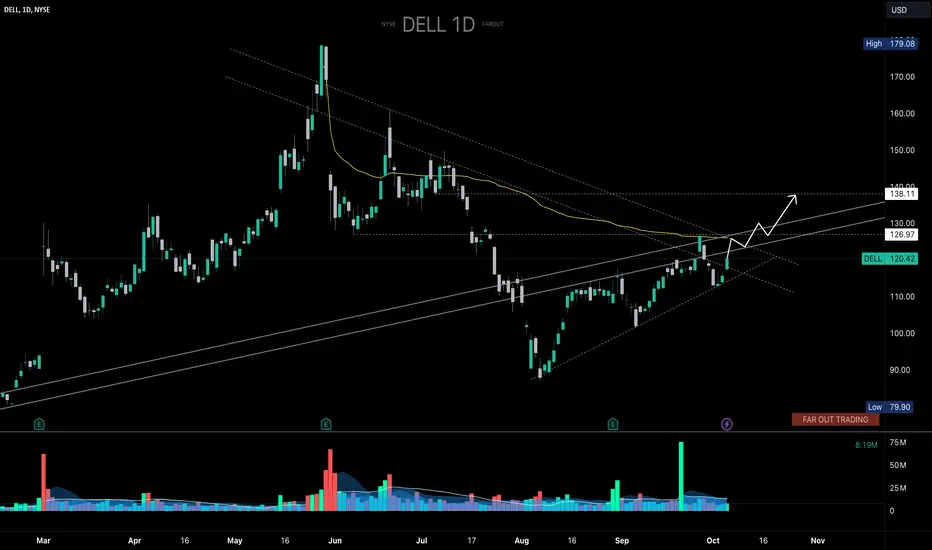
Shorts Trapped Into Insider Selling | DELL I've been actively trading DELL with my private community members and I believe the company is gearing up for another positive run. Despite the news about Michael Dell selling more shares, which may have trapped some short-sellers, DELL is making strategic moves such as reducing costs, rejoining the S&P500, and aiming to capture market share from SMCI.
With this in mind, I see two potential entry points:
a. Enter the trade above $121.50, aiming for $127.
b. Enter the trade once it breaks $127, targeting $138.
Personally, I prefer the second option. DM me with any questions!