S&P 500 ANALIYSIS !!S&P 500 Analysis
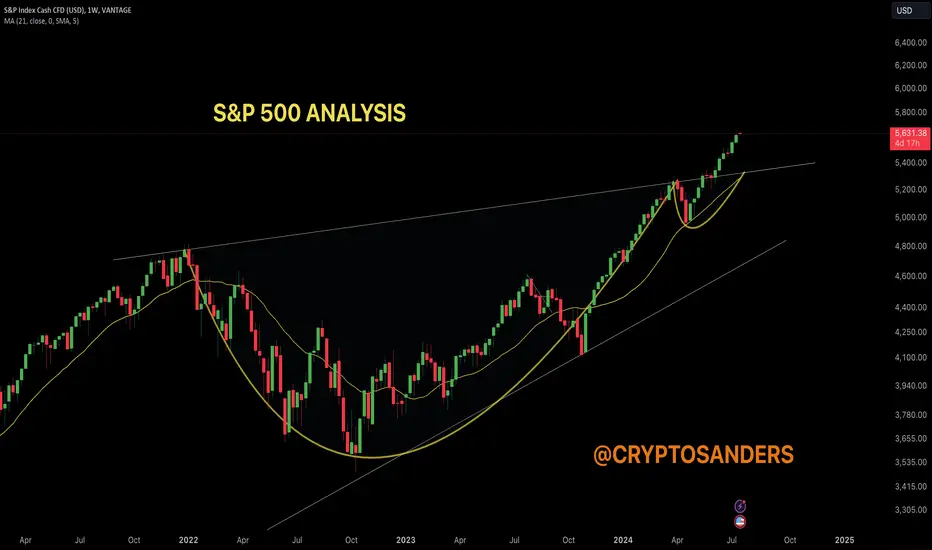
The S&P 500 has recently broken out of a "cup and handle" pattern, which is typically a bullish indicator. This breakout suggests a continuation of the upward trend, supported by the 21-day moving average that acts as a dynamic support level.
Cup and Handle Pattern: This pattern is characterized by a "cup" formation followed by a short consolidation period that forms a "handle." The breakout above the handle signals a bullish trend.
21-Day Moving Average: The S&P 500 is currently trading above the 21-day moving average, which acts as a support level and confirms the ongoing bullish momentum
Retest Above Breakout Level: The S&P 500 will likely retest the breakout level. A successful retest would further confirm the bullish trend.
CME Gap Considerations: There is a CME gap above the breakout level. Historically, such gaps tend to get filled, indicating potential short-term downward momentum before the uptrend resumes.
Monitor for a retest of the breakout level. If the price stays above this level, it confirms the bullish trend.
Keep an eye on the S&P 500 staying above the 21-day moving average. This will strengthen the uptrend.
Fill the Gap: Anticipate potential downward momentum to fill the CME gap. If this happens, it could present a buying opportunity if the price stays above key support levels
Breakout Below Support: If the S&P 500 breaks below the 21-day moving average and fails to recover, it could signal a reversal of the current trend.
The S&P 500 is in a strong bullish trend, confirmed by the breakout from the cup and handle pattern and support from the 21-day moving average. A retest of the breakout level and potential gap fill could bring short-term volatility, but as long as the price holds key support levels, the overall outlook remains positive.
Monitor the breakout level and 21-day moving average for potential retests.
Make sure any breakout or retest is accompanied by significant trading volume for confirmation.
Stay aware of macroeconomic news and updates that may impact market sentiment and the performance of the S&P 500.
Remember:-This is not a piece of financial advice. Stay tuned to us for further updates and analysis. Thank you!
Sp500short
SP500 Bullish setupSP500 looks good enough to try a long here. Main structure is bullish and we can see the same pattern is repeating again. Break of main trendline, retest and pump. I highlited 5.495 as a first resistance area, that i expect to be touched today. Here i think we will see a rejection that will make the price to retrace. Probably around tomorrow we could have a confirmation about a possible reversal that could lead the price to new highs.

ES1! - TIME TO LOOK FOR SHORT ENTRIES OPPORTUNITIES - WEEKLYThank you for the likes, shares and follows. Really appreciate!
_________________________________________________________
This is a zoome out from the latest analysis of the ES1! Mini S&P500 Market.
A little bit adjusted with some interesting points to consider.
in the upper side we potentially won't be surprised in proach futrue see the price rising to $5637.5.
It is time probably to think at holding long short positions as there are some potential lower price point interesting to consider:
- The red horizontal line range area
- And lower there the blue dashed horizontal line
next week candle could probably do the same as this week but in the short side.
Where is the price going and what is the upper side limit? We don't know, we can only make some assumptions based on the technical analysis of the chart.
The issue is that we see that some historicl correlations are not being respected anymore.

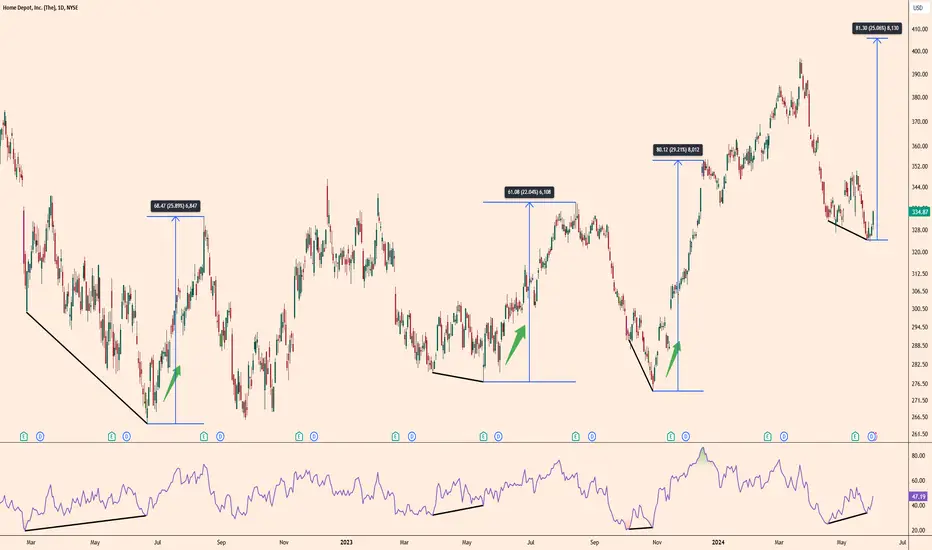
Home Depot DivergenceHome Depot is a stock that loves bull and bear divergences in technical terms. There have been 3 bullish divergences since 2022, all of which have brought an average return of around 25%. The last divergence is now in place and a potential 25% return would push the stock over $400.
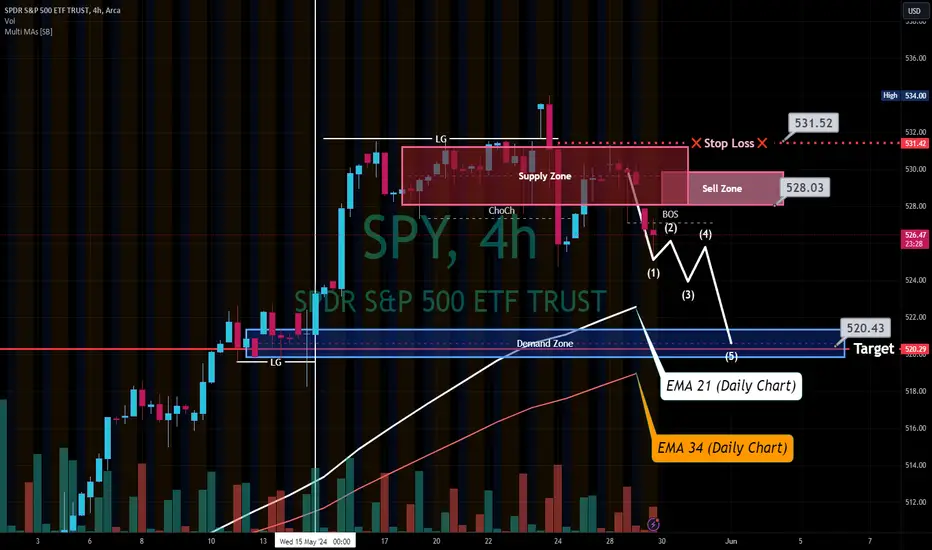
ICT Short setup SPY swing trade, retracement trade👋Hello Traders,
Our 🖥️ AI system detected that there is an H4 or higher timeframe ICT Short setup in SPY for Swing trade.
Of course SPY is in up trend in Daily chart, so this is a retracement trade for reference.
Or you could consider to buy SPY after reaching the demand zone marked on chart.
Please refer to the details Stop loss, FVG(Sell Zone),open for take profit.
For more ideas, you are welcome to visit our profile in tradingview.
Have a good day!
Please give this post a like if you like this kind of simple idea, your feedback will bring our signal to next better level, thanks for support!
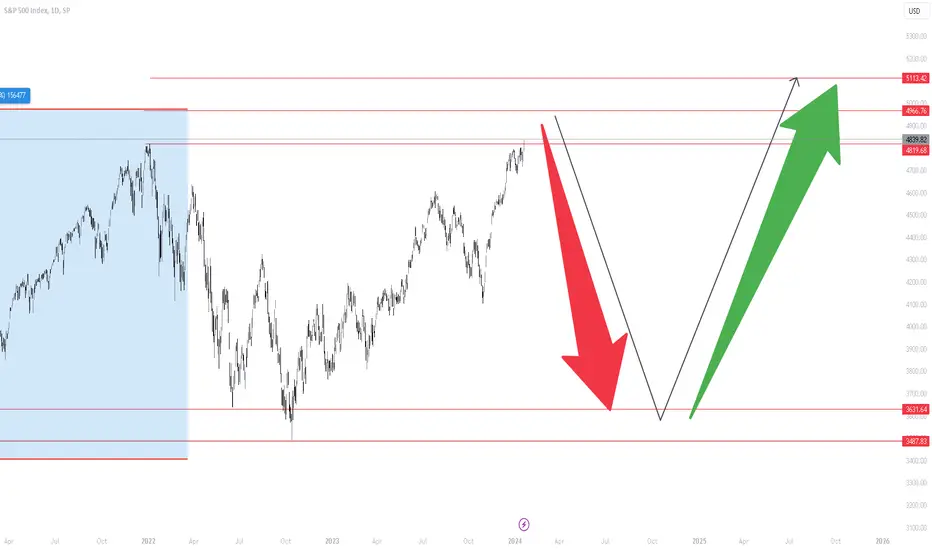
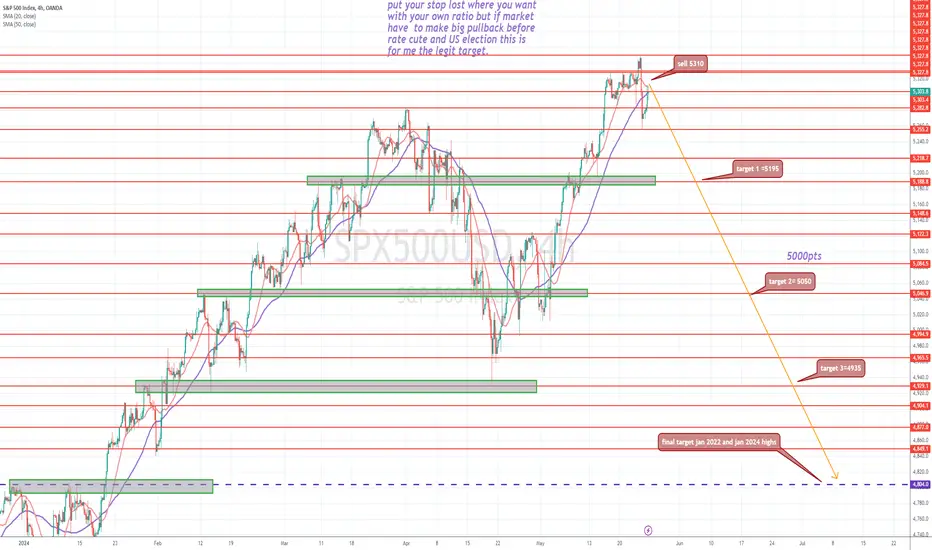
sell sp500 at the price u can get with many targetWIth all happens in the world and market are full crazy broking record high after records high and while Fed not cut rate yet.
+ US electrion in November
+ the Summer coming
i think it have to have a legit pullback before US election and even if fed cute rate i think we wil be in buy the rumour "actually happening since month " and sell the news when it happens
there 4-5 target..at each target you just put you stop loss at the last target in case it not go to final target u keep huge gain.
so for the stopp lost..as we not have any resistance you can manage as your own Risk ratio.
Personally i have a good balance and i wontmake any stop lost,but instead each 100 pips up i will aff 1lot in sell,coz this market is so crazy and i will take my cake at the end
if the pullback not happens before us election i will update in comment what to do
Nasdaq, DJ and SP500 selling has startedIn my opinion today the market shifted from buying to selling. The shift was mostly obvious in DJ30 but I think all will fall heavily this week.
Disclaimer: Not a financial advice. Do your own analysis before investing or trading

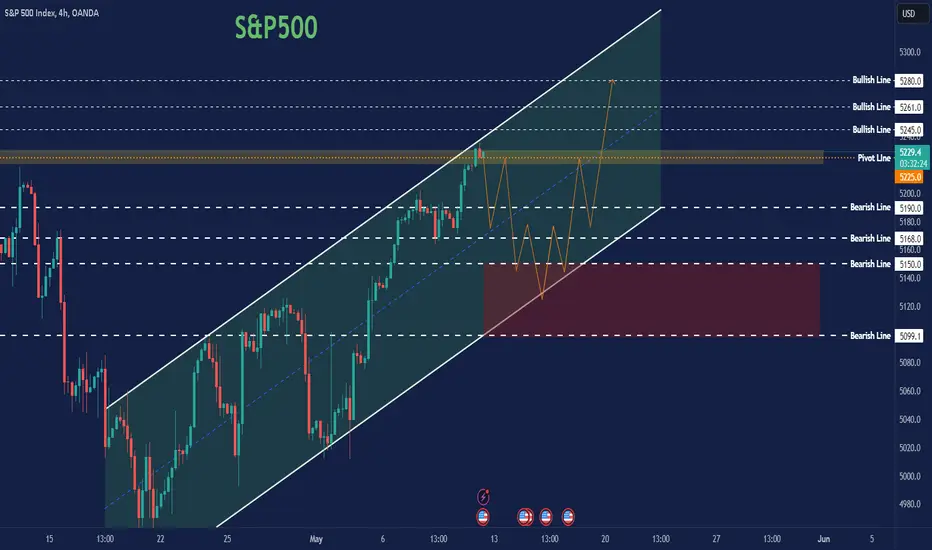
S&P500 ForecastS&P500 Currently, there is a bearish trend projected to reach 5190 from the pivot point at 5225. However, if it breaks above 5245, confirmed by a 4-hour candle closing above this level, it could potentially target higher levels at 5261 and 5280.
Key Levels:
Pivot Line: 5225
Bullish Lines: 5245, 5261, 5280
Bearish Lines: 5190, 5168, 5150, 5099
SP500 Mid term planOur friend Fibonacci is showing up a possible next move for SPX. Actually is ranging exactly on the 1.618 level of the last leg, and usually this level to a retrace till the level 1. There we could probably see a reversal that could lead the price into the resistance area at 5250, but it's probably too early for that
SP500 in the hammer zoneSP500 reached a strong reversal area where price reacted in the previous week. I was expecting a little pump in my previous ideas, and honestly i wasn't expecting it to rise so much. But i am holding my short trades and i am adding more here, consider i expect a selloff this month. First target the support zone at 4990
SP500 Everything goodSP500 is on track and is following the idea i shared some days ago. I expect a continuation of the drop till the 4800-4900 area, and probably the target will be hit in May/June. Here i will look for longs to hold till Q4 2024. Updates will follow
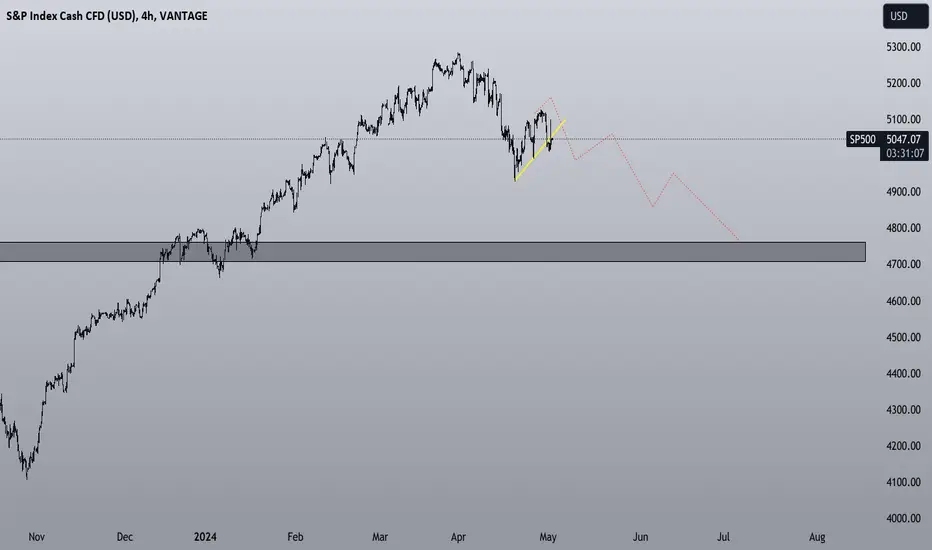
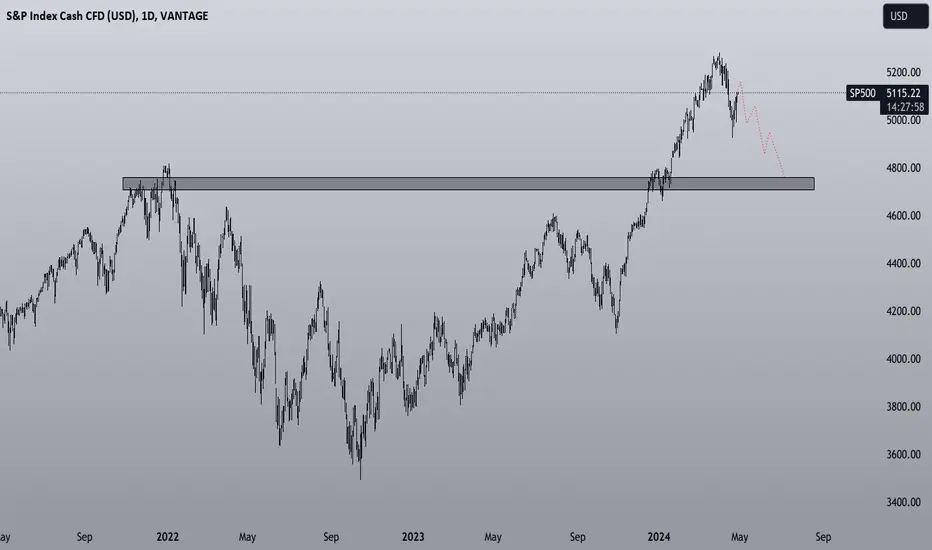
SP500 Main targetSP500 is looking bearish, and i think we will see a major correction in the next weeks. I have my main target at $4.750, were the price could bounce back up. I will enter short with small size and i will add shorts if the price will go up, invalidation above actual highs at $5.300
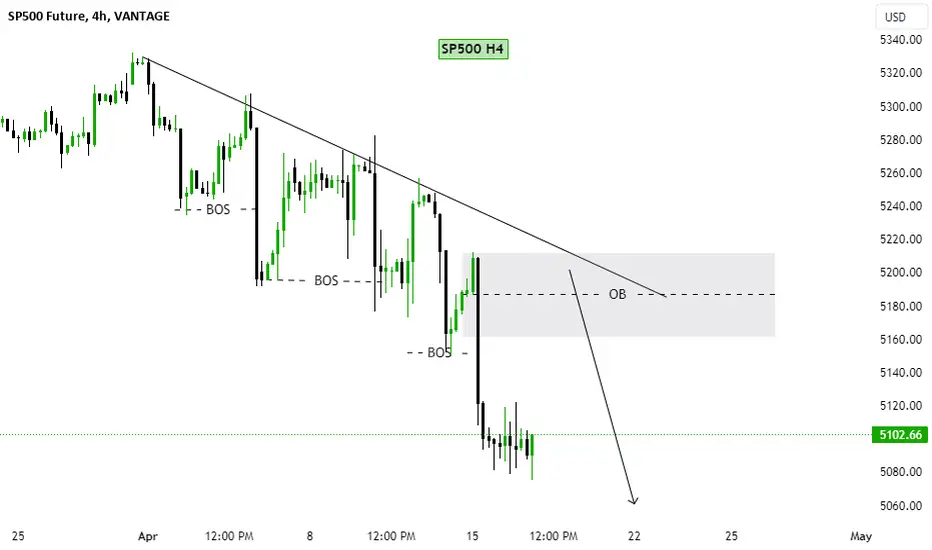
SP500 H4 Projection Price is clearly in a bearish trend. Price also has fair value gab and unmitigated order block zone. So initiate short positions near the order block zone after finding a strong bearish price action structure. Analysis trend is invalid if the price breaks and closes above the trendline. Good Luck.
Target hit for SP500My short plan for Sp500 worked out perfectly. I shared my view some days ago and adding shorts while it was going up paid out. Actually i closed all my shorts and i am looking to enter long. I think that a pullback is on the way

What's next for SP500?SP500 has made a nice drop like i predicted in my previous idea. I expect a little continuation of the drop before a pullback that could lead the price to the resistance area at 5250. Here i will look for a new short in the next weeks.

ES1! S&P500 PREPARE NEXT WEEK - IMPORTANT PRICE POINTS - DAILYThanks a lot you the likes, really appreciate! It is not financial advice just recreational trading idea sharing
____________________________________________________________________
- 5332.5: price point identified as potential optimal entry for short direction trade. Depends on the velovity of the market when if hitting that price point again.
- 5168.75 to 5190.75: probable important zone where the price can pullback up or break with strength.
- 4938.25: Possible down important price point as we can only look behind and in prices lower than the actual price. Above the actual price it is not possible to see where the market can go. So market will do what it has to do if evolving above 5332.5 .
- Some other zone down there but it is not to analyze yet has there is too many important price points above it.
Probably observing what the market does from Monday to Wednesday and see which entries can be done on Thursday/Friday for next week.

SP500 Expecting a dropI think SP500 is on the way to perform a great drop. Looking on H4 timeframe we can see a clean break below main trendline and a retest of it. I think today we will see some volatility around the beginning of the NY Session. I expect a fake moves first to the upside to grab some liquity, next we should see a drop till support zone around $5130

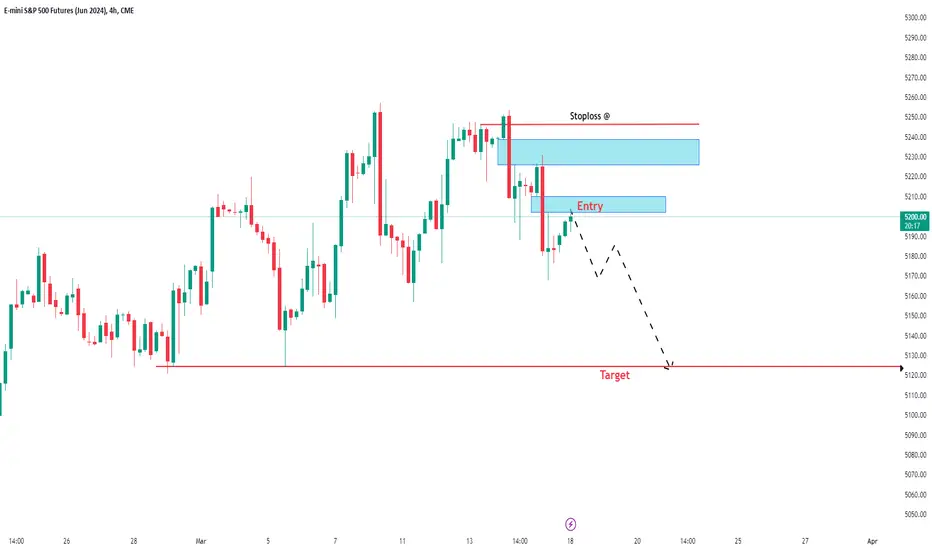
S&P 500 June Futures Expecting a large downside to unwind and target 5120 level or below. which is a good liquidity pool resting downward and we have seen a nice market structure shift after taking out the buyside liquidity
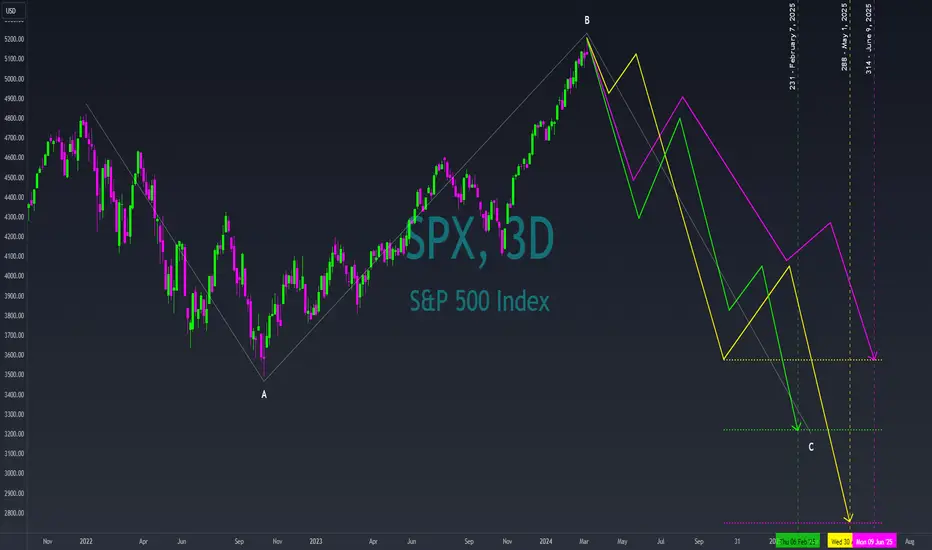
Three tracks to the bottom (cont)This is a follow-up to my analysis from the other day. The green track is the one for the 1968 model. It has held pretty close to the entirety of the whole correction so I favor this model for now. The 2018 model is pretty good. It is the yellow track. It was a short duration but had the lowest bottom. This would give us a bottom around 2700 which most of my other models are no longer favoring. It is good to see, but I am not favoring it as much as the 1968 model. The final model is the 2005 model and the magenta solid path. This model has one of the higher tops over the longer period of time. I do not like this model but it is possible. I figure the drop will be quicker and go below the prior low from October 2022. The 2005 correction did not see C go below wave A's bottom.
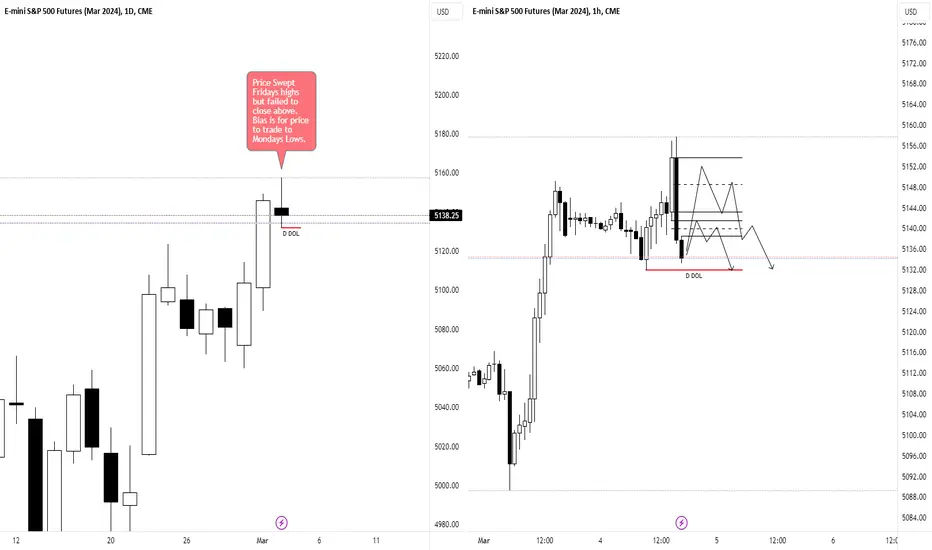
ES SP500 ShortMonday's price action saw ES/SP500 trade above Fridays highs, but failed to displace above Friday's high.
My bias is for price to trade to Monday's low.
I am looking for H1/H4 bearish levels to be respected, and will then look for m5/m15 entry once I see premium bearish arrays are being respected.
SPY to $460Overview
Utilizing trading patterns and consistencies between several technical indicators, I believe the equity market will begin to unload soon as traders collect their profits from the recent rally and prepare for the next FOMC meeting on 19-20 March.
Trading Patterns
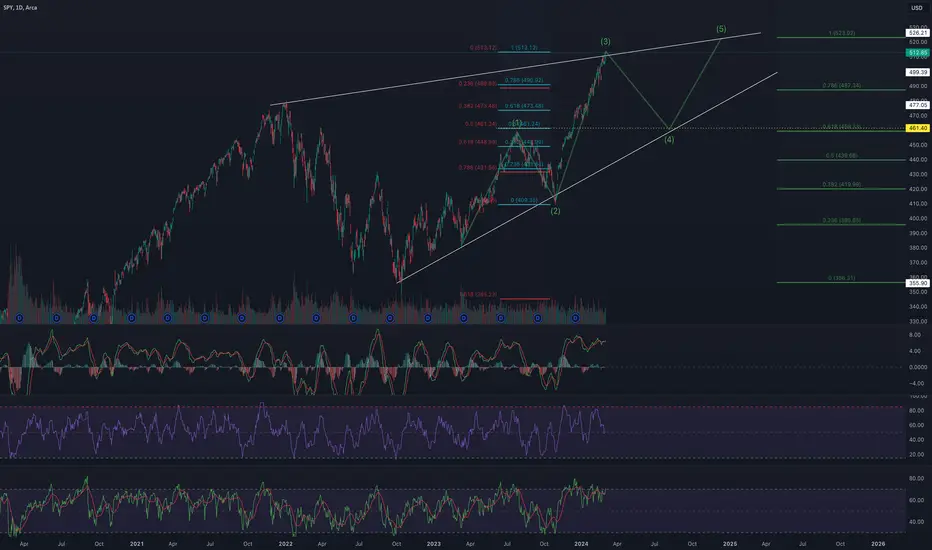
SPY is currently undergoing a rising wedge which is a bearish trading pattern. Within the wedge, I outlined an impulse wave pattern which shows SPY at what may be the peak of the third wave. Rising share price on dwindling volume, in addition to divergences spotted on the RSI, MFI, and MACD, lead me to confidently believe a dip to around $460 is approaching.
Price Target
I used the support and resistance lines of the macro rising wedge to determine the paths of the impulse waves, assuming their troughs and crests will reach the respective lines. Presuming the rules of impulse waves hold true then the fourth wave cannot end pass the crest of wave one, which falls in line with the 50% retracement level of the third wave (blue and red Fibonacci tools). This level rests at a share price near $460.
Utilizing a larger Fibonacci tool to encompass the entire rising wedge and a projected fifth wave crest as 100%, the $460 share price is around the 61.8% Fibonacci level (when used in the uptrend).
Supporting Technical Indicators
The MACD shows a divergence as well as an approaching cross over its signal line from above.
While not as prominent as MACD, the RSI also shows a divergence between the share price and peaks within the RSI oscillator. I've highlighted the divergence by placing a horizontal line at the end of the first peak. It is also reflecting overbought signals.
The MFI shows a sharp negative slope but the SPY share price is still rising. This divergence, aligned with the signals of the other two indicators, suggests the share price may be about to drop.
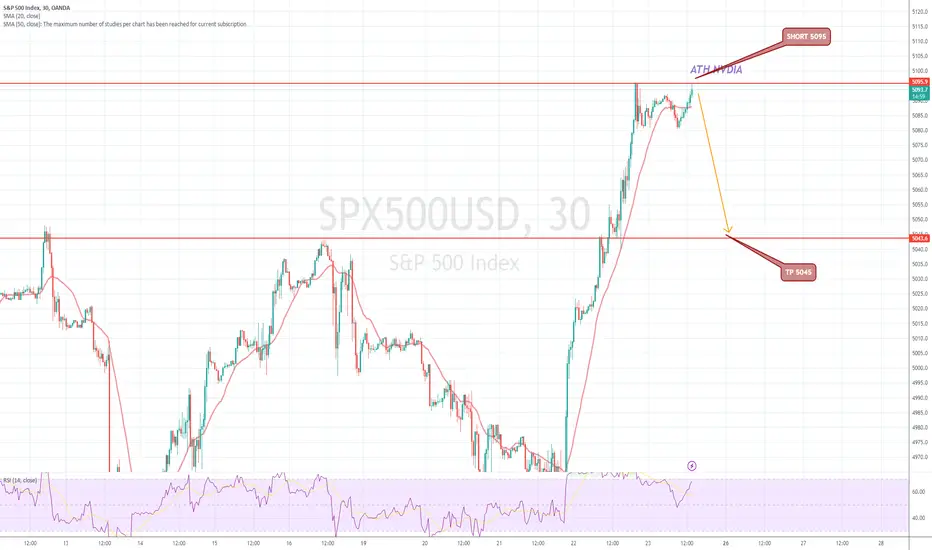
hshort 5095 take profit 4045 foir newt week aheadoverbought in many way
market not care at all the odd of rate cute that noiw are in may-june and
% for march
all tha panic buy for 1 stock nvidia
while we se inflation data backed up
we see job number very good
and market react liek we never up rate since 2 year
its a full bubble that ake los tmany money to retail trader
SPX/S&P 500 FUTURESHello fellow traders, Understanding the current markets are awful as of the this year, price suddenly sky rocket like a balloons on space.
My idea is base on Distribution since the COVID 2020 fall of -35%, the price retrace back for 3 years on the run with almost 45% if price goes to my analysis atleast 4966$.
Then we might see a fall or Down back to the COVID 2020 fall.
This is only my view, Not executing unless price reach 4966, maybe next month or end of the month, We have FED/FOMC in the last day of the month.
Trade at your own risk. position yourself at higher possibility .ofcourse this idea has better odds on making a short positions.
This is not a financial advice.
Follow for more higher context. Swing trades. Stay safe folks.