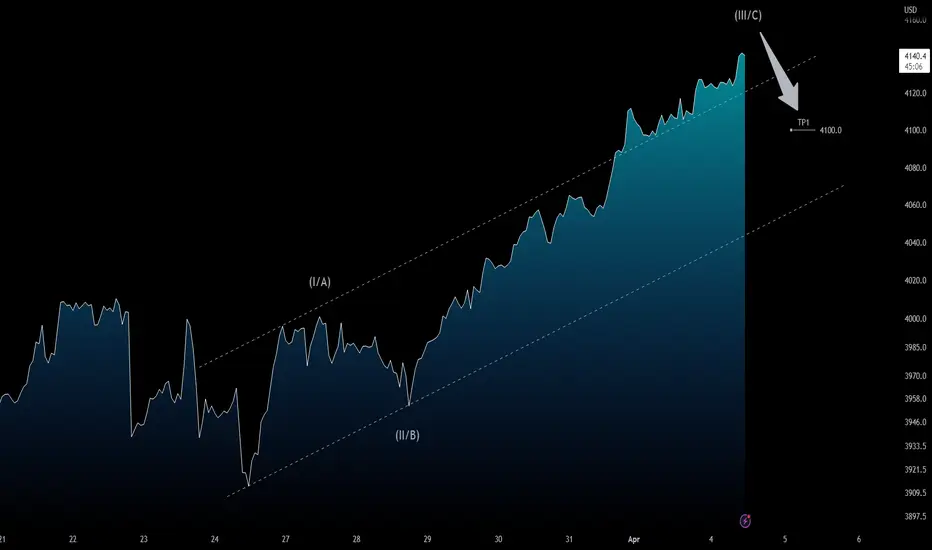
S&P 500 (CFD): Corrective Structure in Short Term?On 1H chart the trend is bullish, but even if it wanted to develop a bullish impulsive structure (i-ii-iii-iv-v), in short term, it would have to trigger a corrective structure (ABC Pattern, for example) with a Target around $4,100.
Trade with care! 👍 ...and if you think that my analysis is useful, please..."Like, Share and Comment" ...thank you! 💖
Cheers!
N.B.: Updates will follow below
Sp500short
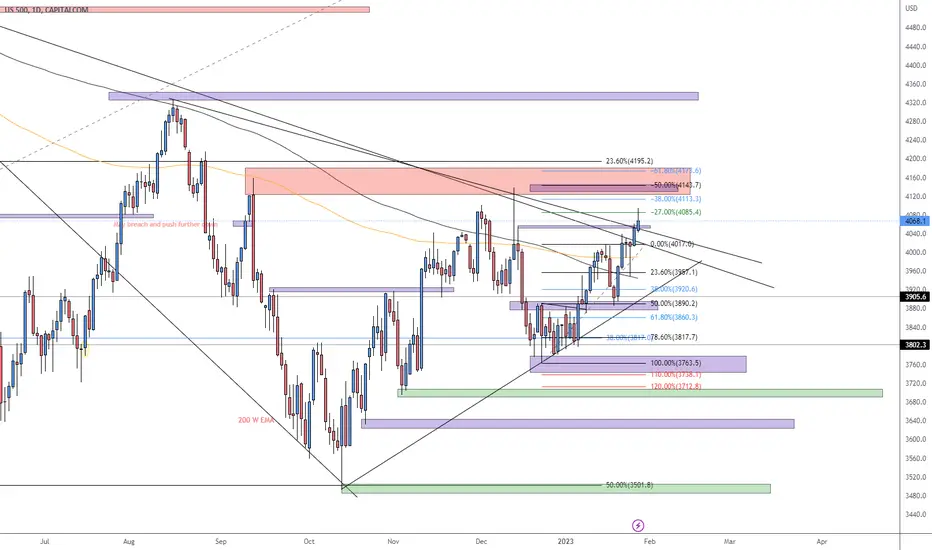
Waiting for confirmations to short ES - SP500 - US500
Hello Everyone,
This is my analysis about the SP500, since we're having a bad data on the PMI Services and if Friday delivers a bad interpretation of the NFP news, i want to see a retracement into the premium key levels and see in a lower timeframes a confirmation of a bearish move, then i'll proceed to short and targeting the fair value area and a lower prices.
This is not a financial advice, the idea is for study purposes. In any case, it is not meant to give you a signal.
This is just a way for me to read the markets.

SQQQ arc pattern possibility / Short $SPYPretty flawless arc/consolidation- breakout to the upside for SQQQ & pullback on SPY?

My today's view on SP500 - FutureHi Traders,
This is my view for today on ES
Micro and Macro structure are both aligned. There’re few zone I’ll wait for the price to test:
- 4025 for a short
- 4080/90 for a short, as well
- 3960 for a long (but I need a strong confirmation)
Pit, Trading Kitchen
DISCLAIMER:
Trading activity is very dangerous. All the contents, suggestions, strategies, videos, images, trade setups and forecast, everything you see on this website and are the result of my personal evaluations and was created for educational purposes only and not as an incentive to invest. Do not consider them as financial advice.

SHORT $SP500 There are many reasons for this short. 1- Bollinger compression
2- Bearish pattern in 1H
3- Near the overbuy zone
4- GAP at 3950
5- I don't know.... many problems, look at the banks for god sake they are going to shit.

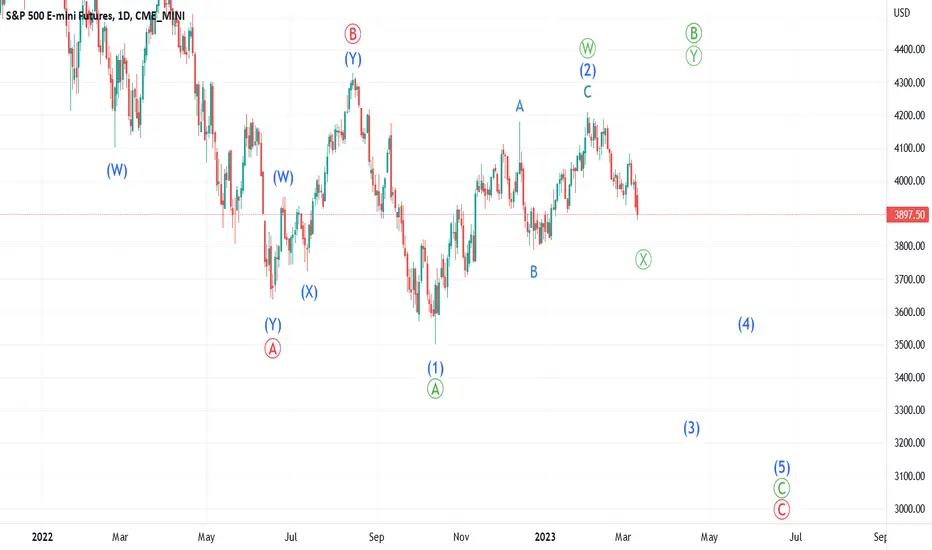
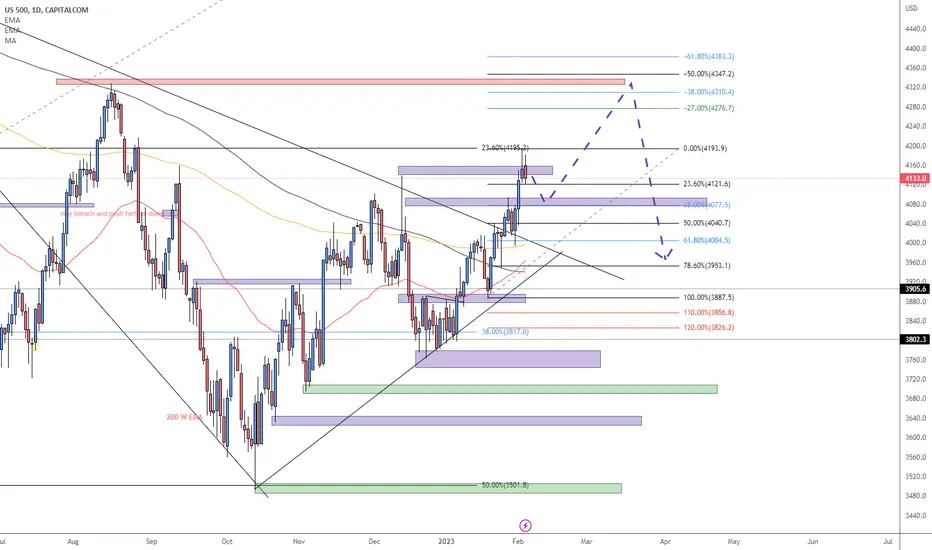
Up and then down, or straight down? Either way we're going down!With the news of SVB about to collapse, the markets started to move into safe havens and the stock markets started moving down. Now the question is, has the move down we've witnessed been the X wave of a larger B wave which should terminate around 4300 (as illustrated in our green count). Or is this the minor wave 1 of intermediate wave 3 which should result in a very sharp move down. Either way we're convinced that over the next few months we're heading lower to 3200 as a minimum. But of course the important part we need to establish now is if we move higher for a minor wave 2 or up for the Y wave of the primary wave B. We're expecting the move down to terminate around 3800 before moving up, of course we will be closely watching this move up to see if we get 3 waves or 5 waves to confirm which count we are in. Exciting times are ahead with some big opportunites to make profits.
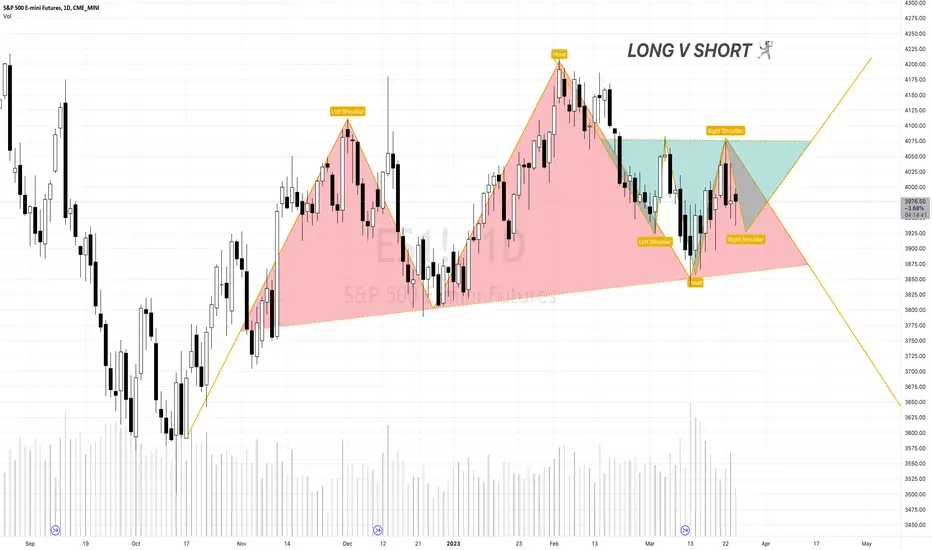
BOOK of SAMUEL: DAVID V GOLIATHWow! This is a first for me, in such a large timeframe. Looking at both patterns forming. The larger head & shoulders pattern may take precedence, as it is generally considered to be a more significant pattern. If the H&S pattern is confirmed, it would suggest that the uptrend is ending and that a downtrend may be beginning. However, if the Inverted H&S pattern is also confirmed, it could indicate that the trend is changing and that an uptrend is beginning.
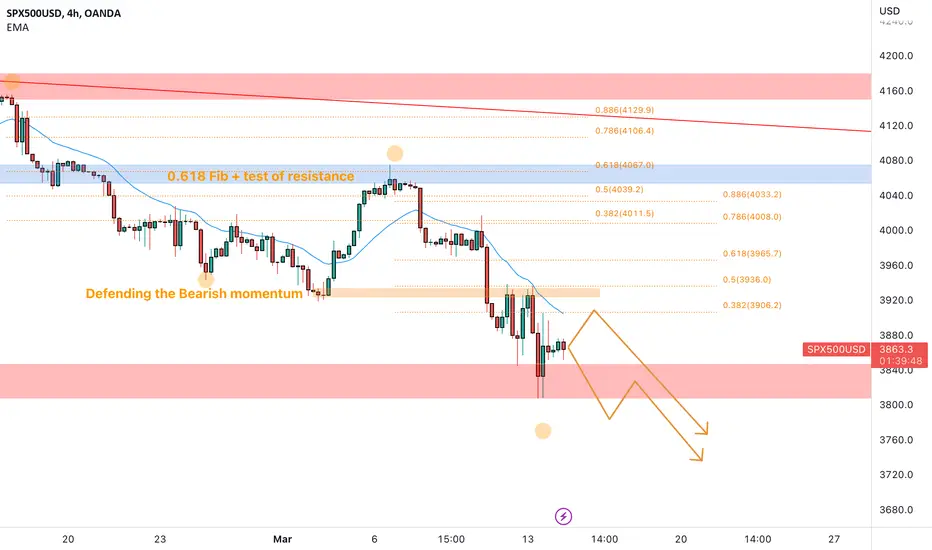
SP500 a short term outlook 🦐Based on the 4-hour timeframe, there are clear indications of a bearish trend in the S&P 500 index. After testing the weekly resistance level at 4160, the market started a bearish move with a series of lower lows and lower highs.
Further analysis shows that the market retraced to the 0.618 Fibonacci level after the first bearish impulse and tested a daily resistance level perfectly. This level is known as an inversion point, indicating a high likelihood of the market reversing its trend.
From there, the price created a second impulse toward the lower weekly support, indicating a continuation of the bearish trend.
As such, it may be wise to wait for a new opportunity to set a nice short order in anticipation of further price declines according to the Plancton's strategy rules.
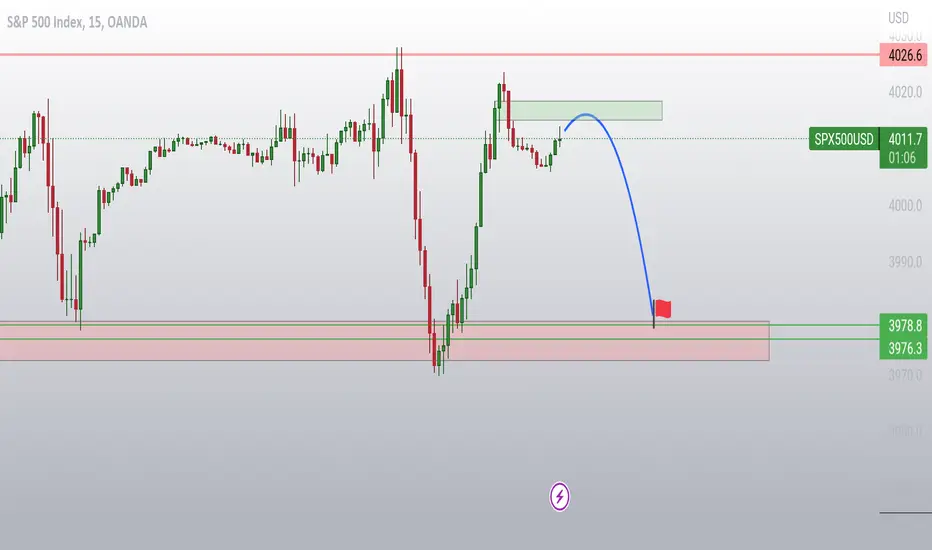
SMC SPX500 Price might go up but I'm looking for shorts onlyWe are looking at the SP500 on 15 minute time frame.
we see two Dotted lines -
Green - Daily High of the previous day
Red - Daily LOW of the previous day
The daily trend is DOWN - so Daily Bias is look for shorts.
The first hour, the market came down and formed a new low before we had a break of structure to the upside. This forms what's known as Sell Side LIquidity - Order Block.
WHy? Because Smart Money goes down and sweeps liquidity where they buy into the market for the day.
Next we can expect the prices to move up then retrace BACK into the LIquidity zone. Once this happens EITHER the market will move up for the rest of the day where intraday traders will go long.
Or it will break below and form lower lows forming Buy side Liquidity (stopping buyers out).
We ONLY will short the market because Daily Bias is bearish... So even if the market goes up, there will be no trade.
If Buy Side Liquidity Order Block Forms we will have a trade to go short.
I'll be waiting - what are your thoughts?

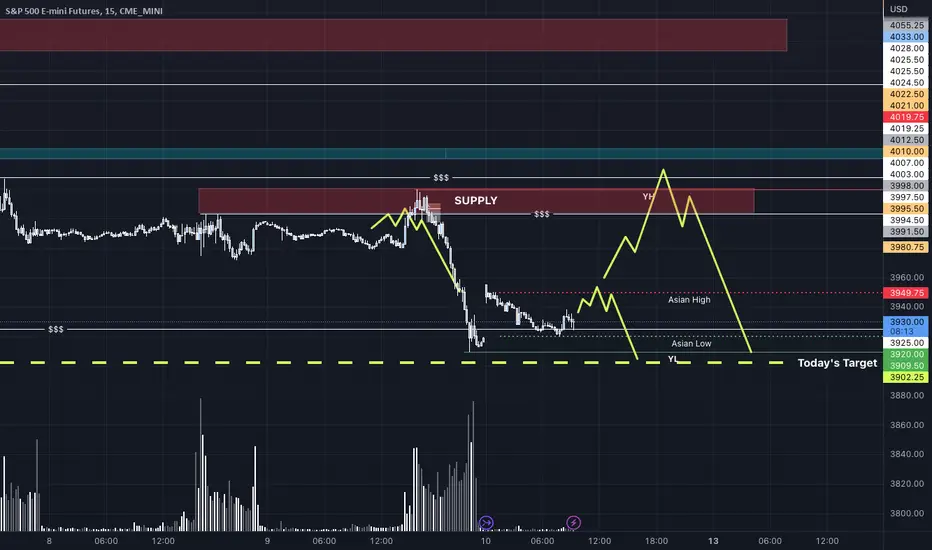
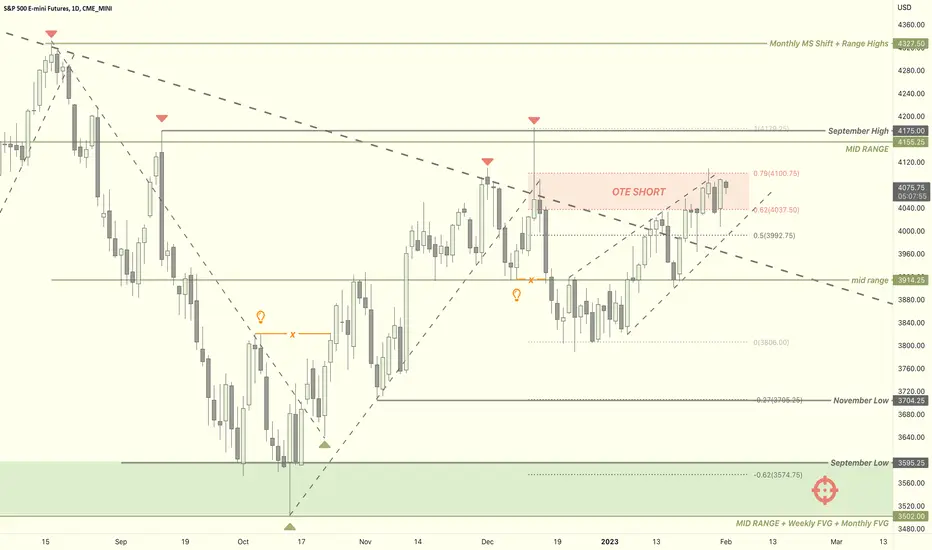
My todays' view on SPX500 futureHi Traders,
This is my view for today on ES
Micro and macro structure are aligned. Next target will be 3900 and can be reached immediately after a manipulation around Asian Session High or with a retest on 4000 level on a strong SUPPLY zone. (I’ll personally wait for this retest to go short).
Pit, Trading Kitchen
DISCLAIMER:
Trading activity is very dangerous. All the contents, suggestions, strategies, videos, images, trade setups and forecast, everything you see on this website and are the result of my personal evaluations and was created for educational purposes only and not as an incentive to invest. Do not consider them as financial advice.
———————————

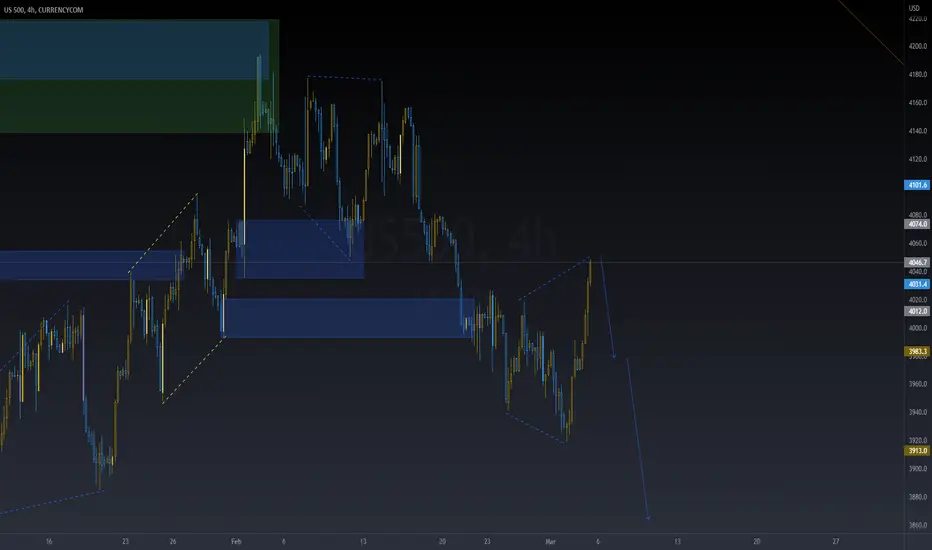
US500 Trading Plan - 4/Mar/2023Hello Traders,
Hope you all are doing good!!
I expect US500 to go Down after finishing the correction.
Look for your SELL setups.
Please follow me and like if you agree or this idea helps you out in your trading plan.
Disclaimer: This is just an idea. Please do your own analysis before opening a position. Always use SL & proper risk management.
Market can evolve anytime, hence, always do your analysis and learn trade management before following any idea.
$SPY PUTS If we held above $400 it would signal a larger move up. Likelihood of that happening is quite low in my opinion. With a big week of low expected earnings, possible negative news coming from Powell, and many companies looking lacklustre with weak guidance, I expect that we can see a strong rejection of the $400 level.
Closed one put already from $399 to $396 and will gradually re-open a few Puts for March/April expiration between $397-$399
Looking for a TP level around $370 or at the .618 fib line. Not because it would be a bottom, but a good level to take profit as we approach expiration and where we might see a possible bounce.
Stop loss would be $400 as I don't expect us to head back above this level. However, if we do, the risk/reward ratio is worth it.
Good luck everyone.

SP500 SELLeace, mercy and blessings of God be upon you. The triangle has been successfully broken, and the uptrend, the market is in a downtrend.

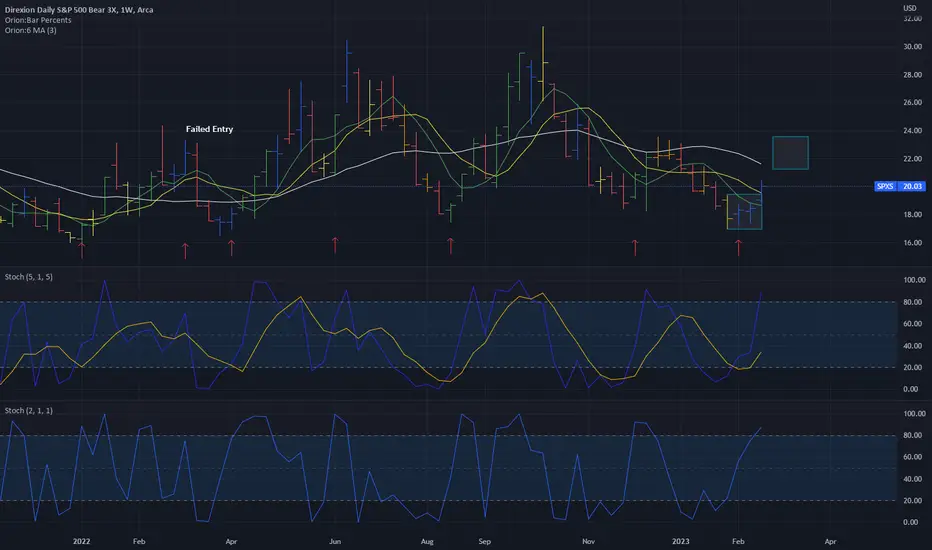
SPXS - There be no Bears here - only BullsThere be no bears here - only bulls!
TIP: Using a stochastic with settings of 5 for %K and 5 for %D you can get an idea when prices are bowing into the dance.
When bears become dominate, inverse ETFs become profitable.
SPXS:
Entry (Stop-Limit) - 20.45
Stop Loss - 18.85
First target - 21.36 (+4.6%)
Anticipated target - 23.57 (+15.27)
$SPY Grow Your Account!What's NEXT?
PATIENCE BABY!
If nothing Happens, why would you try to make it Happen!
Let's Concentrate on some NICE plays and TRADE them Well!
No need to OVERTRADE!

SPX500USD YASSINEIØS M15 GOOD LUCK 🩸Please respect the analysis. Today is a beautiful day, a golden opportunity. Just a little patience and diligence, we will be the best Happy holiday Any questions about the transaction are welcome YASSINEIØS&
A little ugly coming our wayThis past week the bar was caught between the previous bar values which is typical of an adjustment to prices.
The result was a close for the week in the lower 40% of the bar which adjusted the previous bar to a close in the mid section of the bar, or ~41.64% of the previous weeks range. This indicated indecision of a bearish nature.
A potential test of 4007.23 - 3867.02, of which the lower section is testing the mid-December range of 3389.82 - 3746.49
Tighten your stops-losses to just below (by about .002%) this weeks low bar on anything you are trading if you have anything in profit.
This will lock your profit in and should provide you with a potential discount to buy back in after the the test completes itself.
The sectors look like as noted below:
Discretionary - Bearish
Info Tech - Neutral-Bull
Telecom - Bearish
Real Estate - Bearish
Materials - Bearish
Financials - Neutral-Bear
Industrials -Neutral
Staples - Bearish
Health Care - Bearish
Utilities - Bearish
Energy - Bullish
Keep you stop-losses tight
-PriceProphet

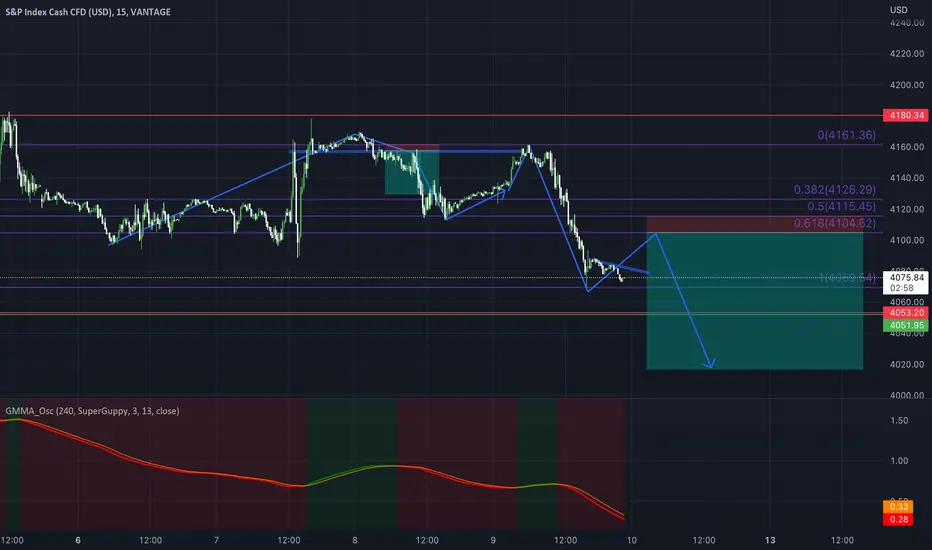
SP500 Short based on Current Price actionSP500 Short based on current price action, We are looking at the major key levels and the fibonacci zone for our confirmation, Trend analysis and with the help of the guppy oscillator, WE can establish an edge in the market.
S&P500 Likely Coming Down, Perfect Time For A Black Swan....Plenty of profits to take, so correction likely in the coming week.
Big question, do we hold at 50D/200D MA and surge or do we get some "bad news" that absolutely tanks markets?
Not a good time to be long either way.....

Outlook on the US500Currently looking at riding longs till the next high on US500. Manipulation and institutions capitalizing on its bullishness, likely pushing it higher for now.
S&P 500 Futures Swing Short TradeThe Biggest Bull Trap I have Ever Seen
Fed will crash the market on FOMC and NFP this week
buckle up
Sp500 ShortLooking for a short on the sp500 from the 4125 area of interest. This will be good for me if aligned to Wednesday's news events, from here looking to hold to a modest level of 3700ish. From here can hedge etc.