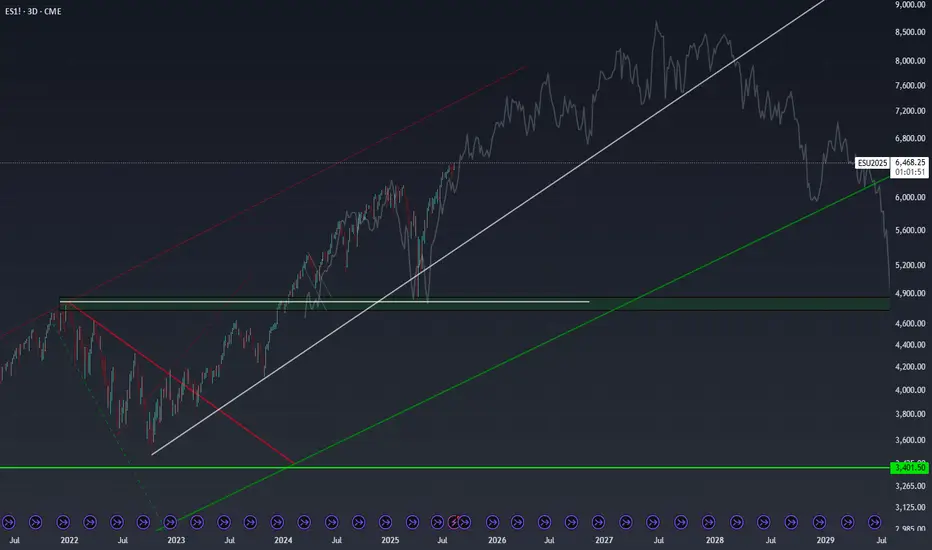
Are We Replaying the Dot Com Era?I’m completely unbiased here - more so curious - but today’s S&P 500 setup looks eerily similar to the late 1990s. In 1996 and 1997, the index posted back-to-back gains of over 20%, just as 2023 and 2024 have done. Then, in 1998, we saw a sharp 20% pullback - much like the one we’ve had in April of 2025. If you overlay that late-’90s fractal on today’s chart, the trajectory points to an S&P 500 level near 8,200 by early 2027.
The bullish case practically writes itself: strong GDP growth, resilient corporate earnings, AI-driven productivity gains, a still-accommodative liquidity backdrop, and investors willing to pay up for growth narratives—just as they did in the dot-com era. The “there is no alternative” (TINA) mentality toward equities was alive then, and it’s alive now. If the trend holds, the next couple of years could deliver staggering upside.
That said, it’s purely an observation - not a prediction. A decisive break below the key rising support trendlines would negate this bullish scenario and shift me to a cautious or neutral stance. Until then, the pattern is worth keeping an eye on.
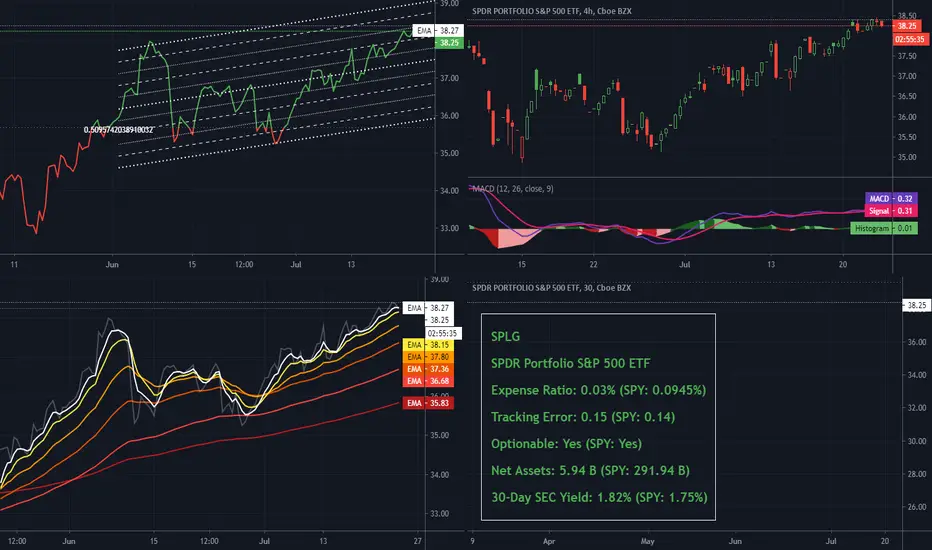
SPLG
SP500 Support at 4280? A review of recent trendlines of SSO, SPLG, SPYV, IVW and UWM. First time shared analysis. Not investment advice, just sharing what I'm seeing.

The "Mini-SPY" You Might Not Know About - SPLG!SPLG can be considered a miniature version of the infamous SPY ETF; albeit a few minor differences in structure and some other additional factors (available in the SPLG prospectus).1 However, these differences are not very relevant to long-term investors or short-term traders looking to make a strategic move in the S&P 500 Index (SPX). According to ETF Trends “SPLG is a cheaper, modernized S&P 500 alternative to the flagship SPDR S&P 500 ETF Trust (SPY).”2
SPLG has an expense ratio of 0.03% (compared to 0.09% for SPY).
Analysts ratings for SPLG:
FactSet: A/95
Morningstar: 5 stars
XTF: 9.8/10.0
Additional information about SPLG can be found in the SSGA factsheet.3
1. www.ssga.com
2. www.etftrends.com
3. www.ssga.com