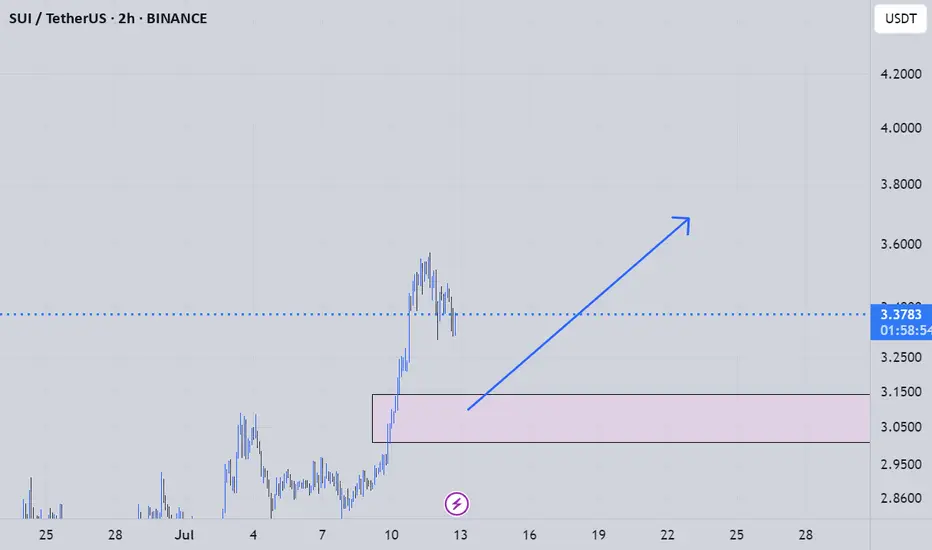
suiusdt long analysyou can use this analys for your spot trades its a longsetup for making a good profit and a getting on a big trend
Spot
SPOT Weekly Options Trade — June 15, 2025🎧 SPOT Weekly Options Trade — June 15, 2025
💡 Ticker: SPOT
🎯 Strategy: Bullish Swing — Call Option
📅 Expiry: June 20, 2025
⏱ Entry Timing: Market Open
📈 Confidence: 70%
🔍 Analysis Summary
All four models (Grok, Llama, Gemini, DeepSeek) indicate strong bullish momentum on SPOT based on:
✅ Above all key EMAs (5-min and daily)
🔁 Bullish RSI, MACD, and Bollinger Band alignment
📢 Catalyst: Evercore ISI upgrade to $750
📊 Notable call open interest in OTM strikes
⚠️ Max Pain: $665 — a known drag, but outweighed short-term by momentum and the upgrade catalyst.
✅ Recommended Trade
🛒 Trade Type: Long CALL (Naked)
🎯 Strike: $740
💵 Entry Price: ~$4.25
📅 Expiry: June 20, 2025 (Weekly)
📈 Profit Target: ~$8.50 (100% gain)
🛑 Stop Loss: ~$2.10 (50% loss)
🔍 Why $740? It's the sweet spot between DeepSeek’s speculative $780 and Grok's expensive $725—offering leverage with decent odds.
⚠️ Risks & Watchouts
🧲 Max Pain gravity at $665 — may cap gains closer to expiry
📉 Rejection at $714–$718 resistance range
🌪 Elevated VIX = potential for wide intraday swings
📏 Stick to small sizing (risking <2% of portfolio) due to premium volatility
🎯 Bottom Line: Strong bullish setup, solid catalyst, and technicals support a move higher. Enter on strength near open, manage tightly, and take profits on a double.
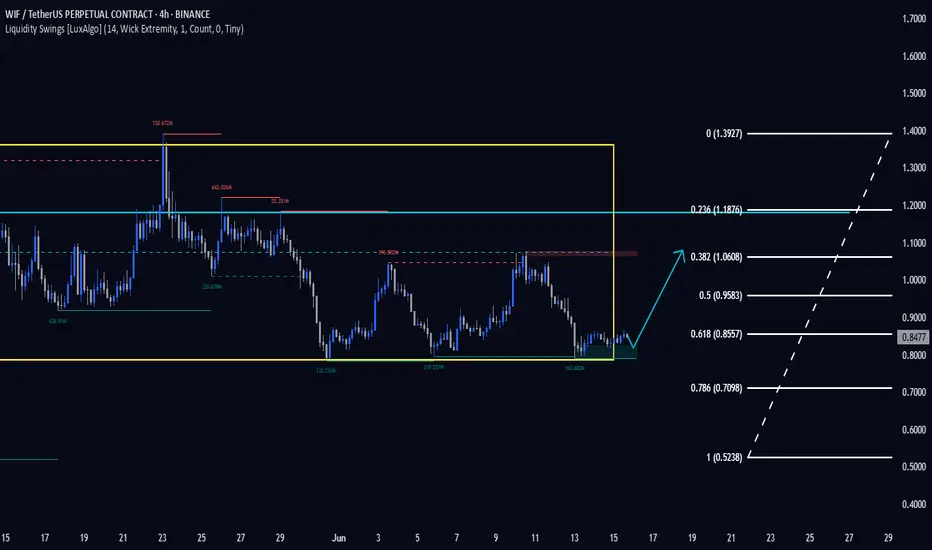
WIF 4H. Make or Break ZoneBINANCE:WIFUSDT The asset is still moving within a defined range and is now brushing against the lower boundary of its structure. This area has historically triggered buyer interest — and if that repeats, we could be looking at a recovery toward $0.97+ in the short term.
However, failure to defend this support could send price cascading down to the $0.58–$0.60 zone.
Given the ongoing uncertainty in global markets, especially due to rising geopolitical tension, any long positions should be executed with tight risk management and a hard stop-loss.
Entry range (EP):
• Market
• $0.8120
• $0.7790
Take-Profit targets (TP):
• $0.8880
• $0.9425
• $0.9765
I’m managing risk carefully and limiting exposure per trade to no more than 2% of my portfolio. This is my personal trading log and not financial advice — always DYOR and trade responsibly.
Let the market decide — I'm prepared either way.
Stay sharp. Stay safe. 🧠📊
AR 1H. $5.90 Is the Last Line of Defense. 06/15/25BINANCE:ARUSDT If we fail to hold the $5.90 level, this asset could crash hard — potentially entering a deeper downtrend.
DYOR.

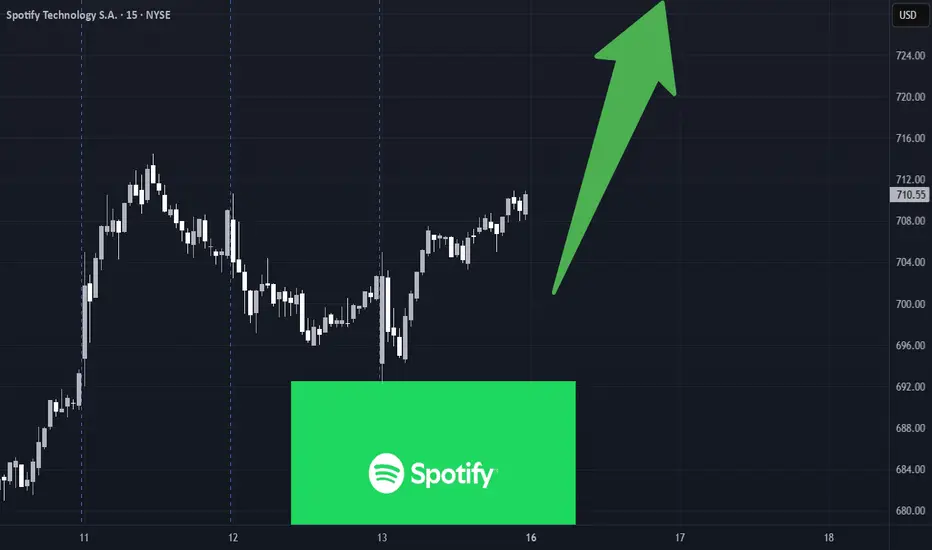
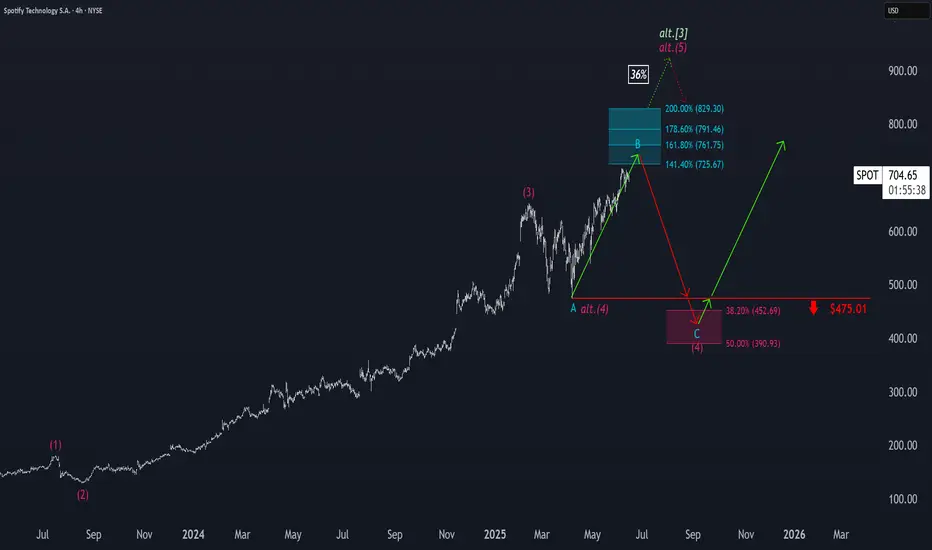
Spotify: Target Zone AheadSpotify has already come quite close to our turquoise Short Target Zone (coordinates: $725.67–$829.30). In our primary scenario, we continue to expect further upside in the near term, as the projected peak of wave B should materialize within this zone—a range that could present opportunities to lock in long-side gains or initiate short positions. Once the top is in place, we anticipate a more pronounced downward move. The focus then shifts to the magenta Target Zone (coordinates: $452.69–$390.93), which we consider a potential accumulation range for new long positions. That said, we’re also monitoring an alternative path, currently assigned a 36% probability. In that scenario, magenta wave alt.(5) would already be underway—meaning prices would bypass the magenta zone altogether.
📈 Over 190 precise analyses, clear entry points, and defined Target Zones - that's what we do.
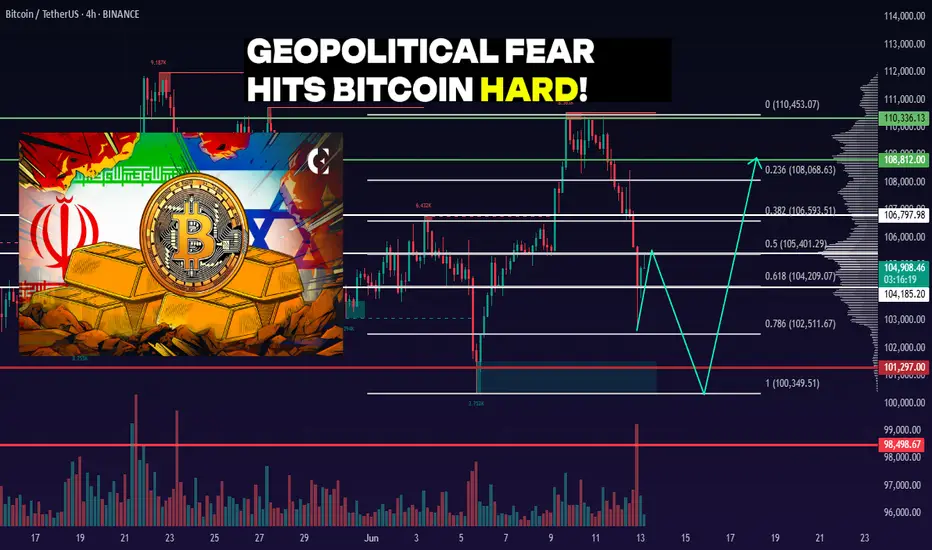
BTC 4H. $104K or Bust — Critical BTC Moment! 06/13/25BINANCE:BTCUSDT remains in a sideways range between $110,336 – $101,297. The main trading volume is concentrated around $103,907.
Recently, the price reached the upper boundary of the range at $110,336 and sharply declined from there — confirming the strength of resistance. The drop was intensified by negative geopolitical news (Israel–Iran tensions).
As a result, BTC retraced into the $104,185 – $101,297 demand zone — a potential area where buyers might step in again.
Personally, I expect one more dip into the $104,185 – $101,297 range to test the strength of buyers.
⚠️ If negative news continues, a breakdown below $100,349 and a new local low is possible.
DYOR.
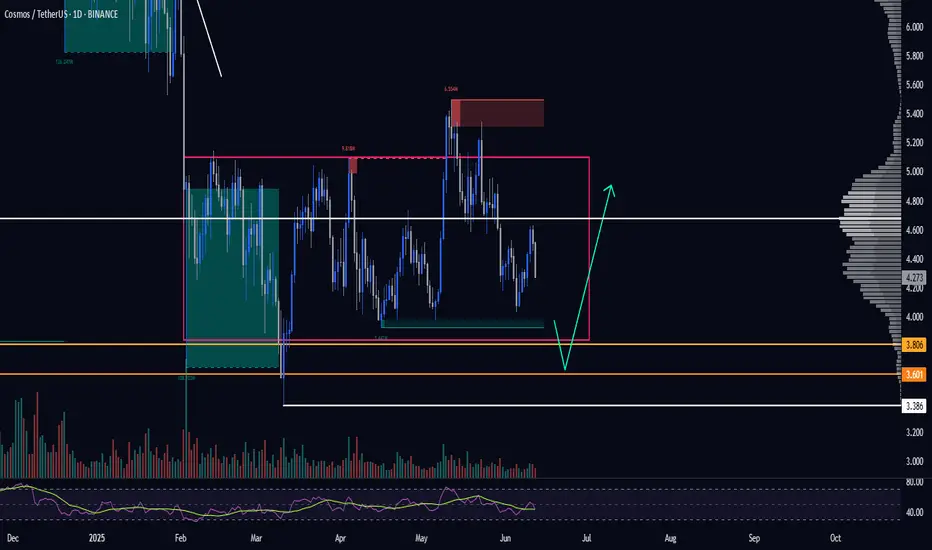
ATOM. Massive Liquidity Grab Incoming. 06/12/25BINANCE:ATOMUSDT At the moment, the price is in an accumulation phase.
The buyer interest zone lies between $3.806 – $3.601, which also serves as a strong support area. We may see solid spot/futures entries here and the potential start of a new upward move.
What we’re really waiting for is liquidity to be swept in this zone — where tons of stop-losses have clustered. Such a shakeout would be a perfect setup for a bullish impulse.
Spot/futures accumulation is valid within this zone.
DYOR.
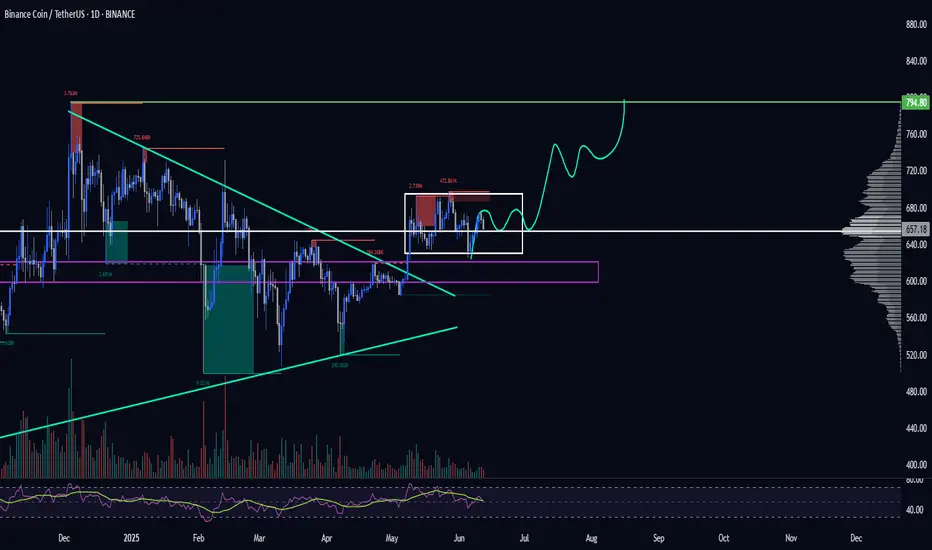
BNB 1D Ready to Explode? This Chart Says YES. 06/12/25BINANCE:BNBUSDT is forming a tight consolidation right below key resistance at $710, inside a triangle structure. Every dip into the $655–$625 support zone gets quickly bought up — showing strong buyer interest and accumulation.
Price is compressing inside the triangle with higher lows, indicating bullish pressure. A breakout above $710 would likely trigger a strong move toward $770–$780, and potentially a new ATH > $800.
As long as $625 holds — I'm bullish. I expect one more sweep of support before an explosive breakout.
Spot/futures entries: $655–$625
Targets: $710 → $780 → $820+
Invalidation: Daily close below $625.
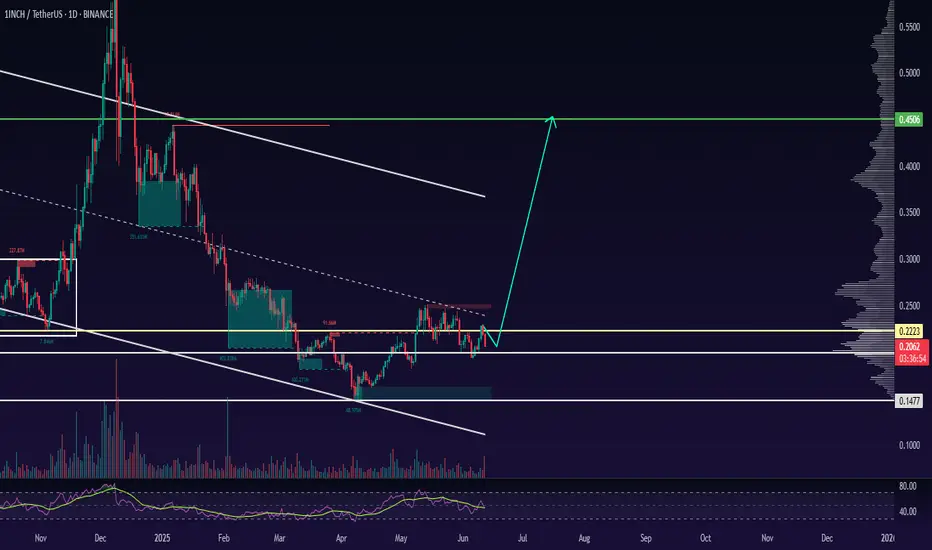
1INCH 1D. Showing Signs of Accumulation. 06/12/25BINANCE:1INCHUSDT There's growing media and social media attention around the 1INCH project, which could be a bullish sentiment trigger.
Currently, the price is trading within a descending channel and has recently bounced from the lower boundary, signaling a potential long entry or spot accumulation opportunity.
From current levels, I expect a clean 2x upside on spot. Personally, I think it's worth starting to scale in carefully on spot or futures.
However, keep in mind — even after a bounce, price could still dip slightly lower before any meaningful move up. A deeper correction remains a possibility, so always factor in risk.
📌 Key Takeaways:
• Long bias from current levels
• Potential 2x on spot
• Further dip possible — manage risk accordingly
DYOR. Stay sharp.
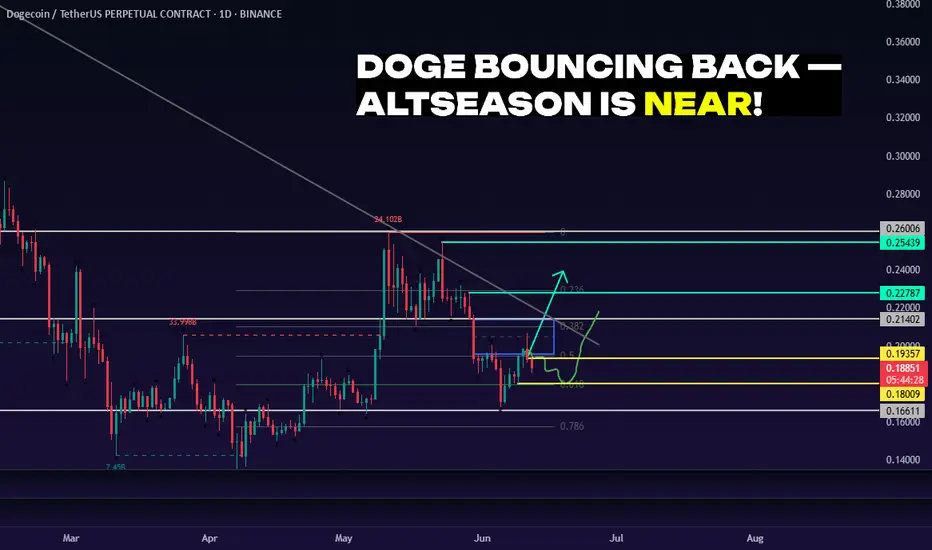
DOGE 1D: Missed PEPE? Don’t Miss DOGE 06/12/25BINANCE:DOGEUSDT
I’m expecting a continuation of the upward movement and a possible trend reversal.
There’s a chance we’ll revisit the 0.618 Fib level to shake out weak hands — a classic move before liftoff.
Looking at the chart, it really feels like altseason is closer than anyone expects. DOGE may lead the charge.
Entry Points (EP):
• Market
• $0.19357
• $0.18009
Take Profit (TP):
• $0.22787
• $0.25439
⚠️ My personal opinion only — not financial advice.
Do your own research and remember: all actions you take are your own responsibility. Practice solid risk management and avoid investing more than 2% of your total capital per trade.
DYOR.
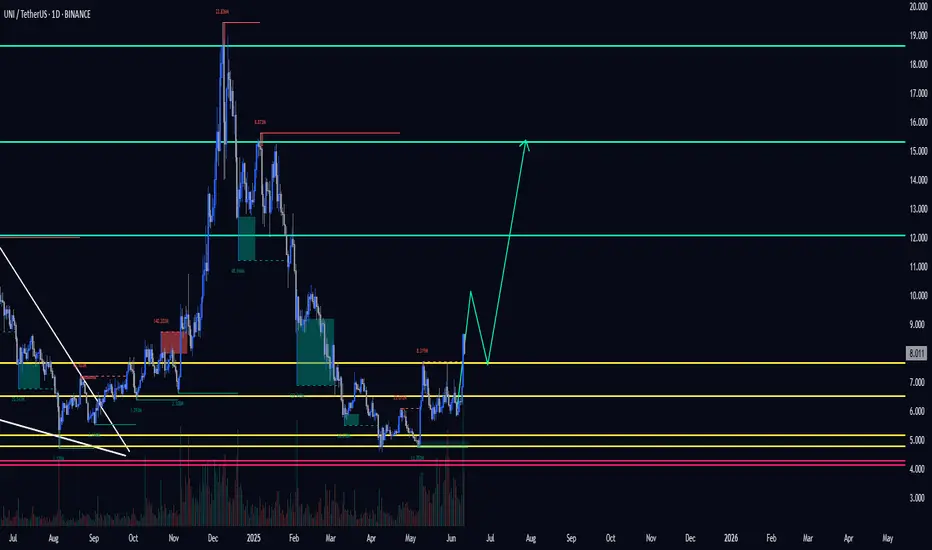
UNI 1D. Breakout Coming? Long-Term Setup Explained 06/11#UNI has been trading in a wide range between $4.072 – $18.634 for the past three years. This is known as an accumulation phase, where large players may be building positions ahead of the next major price move.
After a steep decline, the price bounced off the key support zone at $5.623 – $4.753. It then reclaimed and held above $6.325, a historically high-volume area — a bullish signal.
For short-term entries, I recommend waiting for confirmation above the 100-week moving average (MA100), which currently sits around $7.671. A break and close above that level would suggest a trend reversal.
🎯 Targets:
• $12.063
• $15.305
📥 Mid-term accumulation zone:
• $5.623 – $4.753
• If price drops to $4.072, it could be another solid buy opportunity.
DYOR.
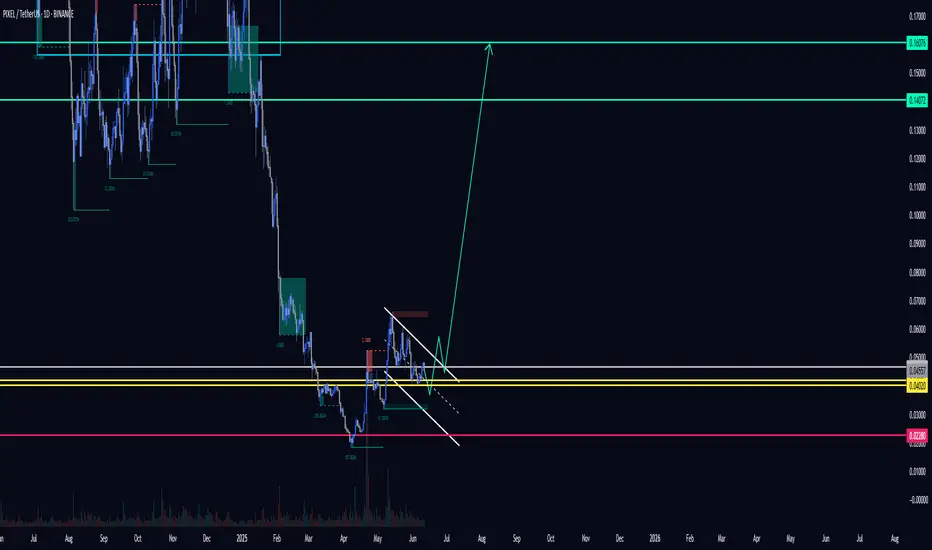
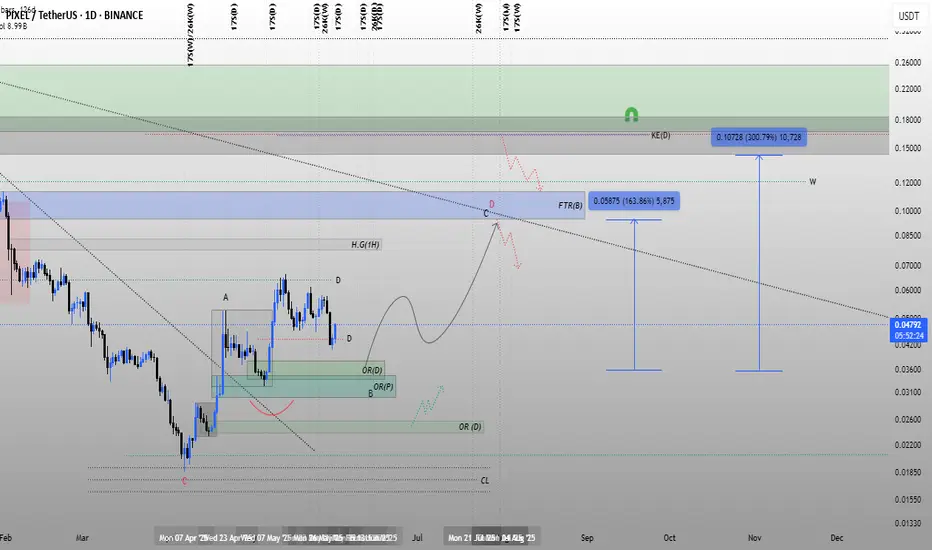
PIXEL 1D. High-Risk, High-Reward Setup. Here's the Play. 06/11BINANCE:PIXELUSDT
Entry opportunity for the bold.
EP (Entry Point): 0.04215$ – 0.04020$
TP (Take Profit):
1️⃣ 0.14072$
2️⃣ 0.16076$
SL (Stop Loss): 0.02280$ or according to your personal risk management.
❗️No stop loss on spot — manage accordingly.
DYOR. Always know your risk.
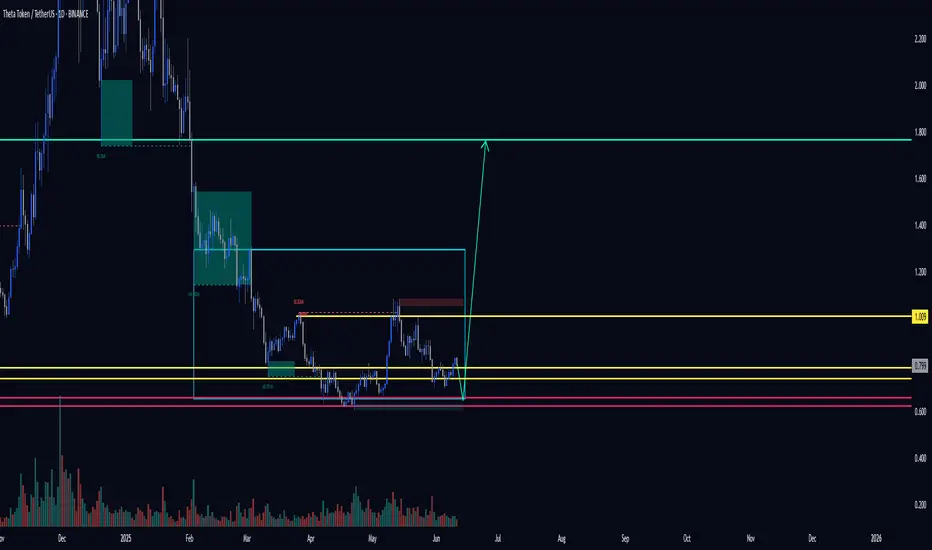
#THETA 1D. Swing High Rejected – What's Next? 06/11/25We are currently in a consolidation range. After updating the swing high, price immediately faced seller pressure from the top of the structure.
Why did this happen?
Many participants were stuck in losses for a long time and decided to exit at breakeven as soon as price gave them the chance — totally understandable.
Key levels for the setup:
Yellow lines – potential entry points.
Red lines – stop-loss levels, depending on your risk appetite (marked two options).
Green lines – target areas.
Whether you go with spot or futures — the setup is there. Choose your strategy accordingly.
DYOR.
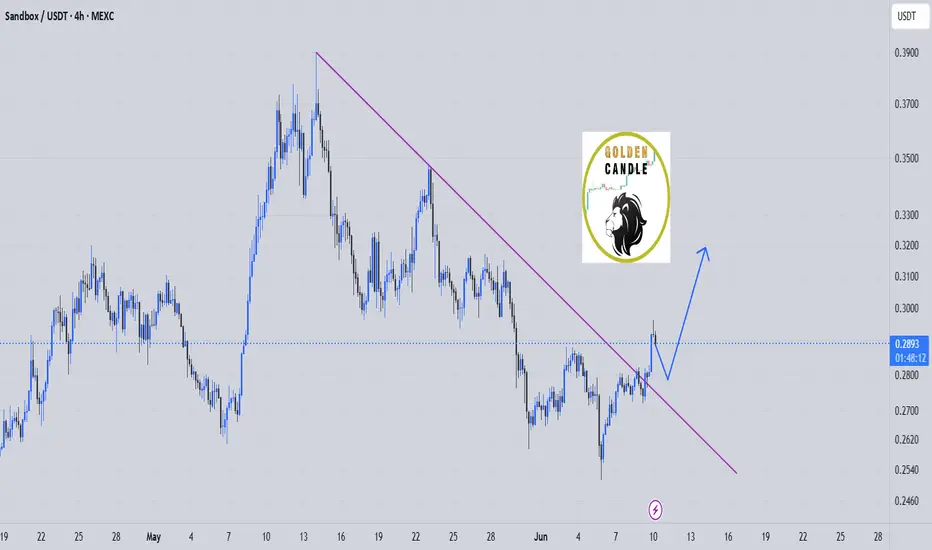
sand buy spot "🌟 Welcome to Golden Candle! 🌟
We're a team of 📈 passionate traders 📉 who love sharing our 🔍 technical analysis insights 🔎 with the TradingView community. 🌎
Our goal is to provide 💡 valuable perspectives 💡 on market trends and patterns, but 🚫 please note that our analyses are not intended as buy or sell recommendations. 🚫
Instead, they reflect our own 💭 personal attitudes and thoughts. 💭
Follow along and 📚 learn 📚 from our analyses! 📊💡"
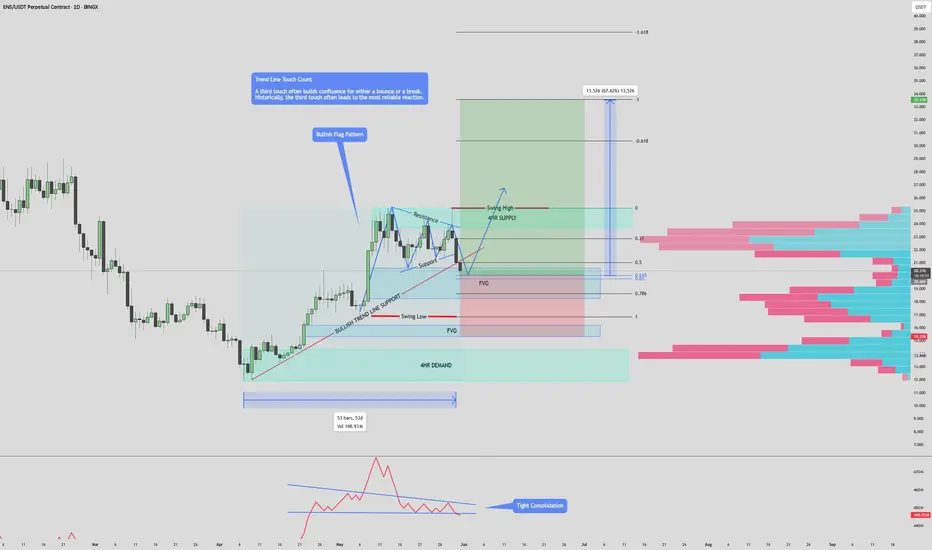
$ENS / USDT 1D FAKEOUT ON FLAG? Incoming Pump? 📊 $ENS/USDT Perpetual Contract – Daily Timeframe Analysis
🟢 Bullish Setup
A bullish flag is forming on the daily chart — a continuation pattern indicating potential upward movement.
- Price recently entered into the golden pocket of the Fibonacci retracement tool marked from $16.881 – $25.241 on the third touch of the flag's resistance, triggering a fakeout, it now rests in the first Fair Value Gap.
- The strong wick rejection on the 3rd retest of the resistance/supply indicates bearish strength, momentarily pushing price lower.
- Despite this, the overall pattern remains valid as long as price respects the Golden Pocket and FVG zone below.
✅ If price closes above the golden pocket, it could present an excellent leveraged entry or spot position, with high reward potential off 67%.
🔴 Bearish Scenario
- So far, every test of the **4H supply zone** has resulted in rejection — showing persistent seller control at short-term resistance.
- If buyers fail to defend the golden pocket and recover the bullish trendline, the structure confirms a break. (Downtrend)
The confirmation of bearish pressure is the:
1) Large wick (Creating a shooting start candle pattern)
- Signaling bearish reversal.
2) Large Bearish Marubozu Candle.
- Indicates strong continuation of a downtrend.
3) Candle close below Trend line support.
- Showing Bears were able to successful make a major move.
🔽 In that case, we look to short after FVG confirmation and scalp down toward the daily demand zone.
📌 Patience is key. Let the price show intent before entering.
Please let me know what your thoughts are!
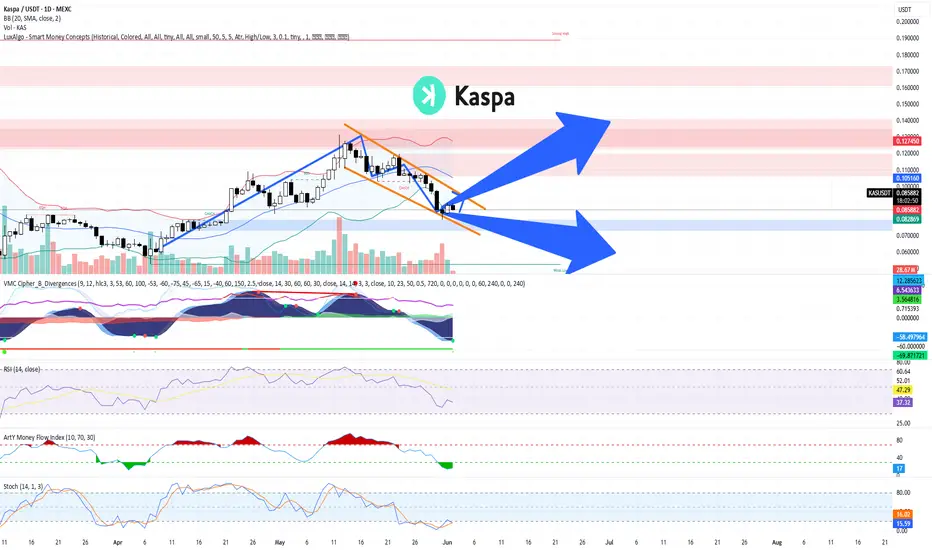
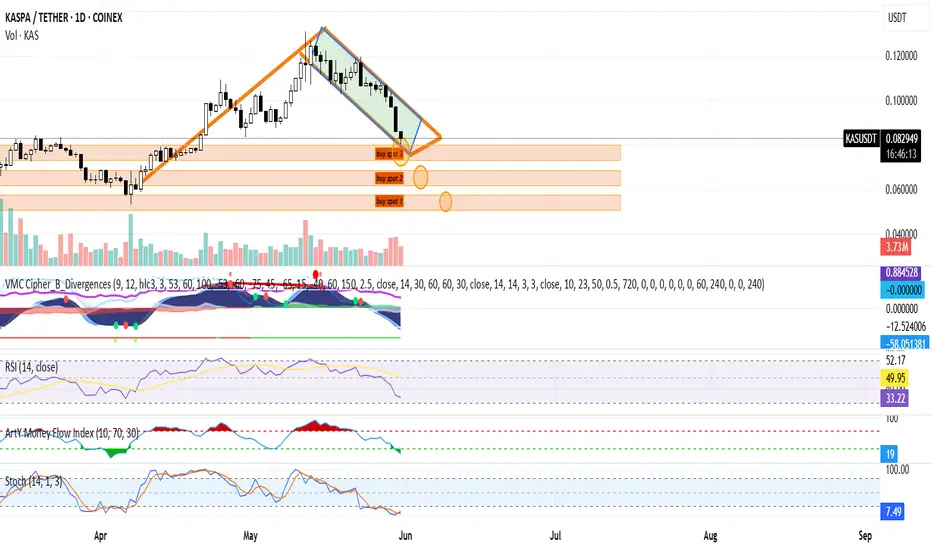
TECHNICAL ANALYSIS – KASPA/USDT (Daily Chart) + TRADE PLANTECHNICAL ANALYSIS – KASPA/USDT (Daily Chart)
Chart Pattern & Price Action:
Descending Channel (Falling Wedge): KASPA has been trading within a falling wedge pattern, typically a bullish reversal setup.
Breakout Zone Approaching: Price is currently testing the upper resistance of the wedge (~$0.086–$0.088). A breakout from this level may indicate trend reversal.
Key Resistance Zone:
$0.105 – $0.127: Significant supply area (marked in red). Previously rejected, it is the next target if price breaks out upward.
Support Zone:
$0.073 – $0.082: Demand zone. Coincides with the Bollinger Band lower range and historical support.
Indicators Overview:
Bollinger Bands:
Price is trading at or near the middle band, showing a neutral-to-slightly bearish bias.
A breakout above the upper band (~$0.0895) could trigger bullish momentum.
MACD (VMC Cipher_B_Divergences):
Strong bearish momentum continues, but we can observe potential bullish divergence forming.
Green dot signal at the bottom may indicate a possible local bottom.
RSI (Relative Strength Index):
Currently at 37.06, near oversold territory.
Could signal a bounce if RSI climbs above 40 and confirms strength.
Money Flow Index (Art’ Money Flow):
MFI is deep in negative; however, these levels often precede trend reversals.
Watch for a crossover into positive territory as confirmation.
Stochastic RSI:
Bullish crossover around 14.53 / 15.67 in the oversold zone.
Early sign of potential short-term bounce.
TRADING PLAN
Entry Points:
Zone Type Price Range Reason
Buy Spot 1 Conservative $0.073 – $0.082 Strong historical support & bottom of wedge
Buy Spot 2 Aggressive ~$0.086 – $0.089 Breakout of descending wedge
Buy Spot 3 Momentum Break above $0.105 Bullish confirmation + breakout of major resistance
Take Profit Zones:
TP Level Price Notes
TP1 $0.105 First resistance / psychological level
TP2 $0.127 Strong resistance – expect rejection here
TP3 $0.15–0.16 Major extension target if strong momentum
Stop-Loss Strategy:
Strategy Type Placement
Conservative Below $0.073
Aggressive Below $0.080
Risk Management:
Use position sizing relative to account size (e.g., 1–3% risk per trade).
Adjust stop-loss dynamically if entering at breakout.
Combine with on-chain metrics or volume spikes for higher conviction.
SCENARIOS:
🔼 Bullish Scenario (Blue Up Arrow):
Breakout above wedge → retest → rally toward $0.105+
Break $0.105 confirms macro uptrend continuation
🔽 Bearish Scenario (Blue Down Arrow):
Rejection at wedge top → breakdown of $0.082 → revisit $0.073 support
Below $0.073 would invalidate short-term bullish structure
PIXELUSDTThe outcome of this analysis is that based on the structure of a zero - D wave, which may be a pig or triangle, or even a pig, we should look for the optimal areas to buy Spot …
In the event that this analysis is correct, it may be ideal to purchase Spot in the vicinity of Beijing to the tribes.
A cautious target for the Chinese outbreak and a more risky target could be a dollar casualty.
In time terms too, mid - June and more accurately the beginning of the third week of June would be the ideal approximate time for the start of the DC wave …
As indicated in the chart late July and early September are important times in the chart that will probably work depending on the structure and my guess is that the mentioned times are the ideal time for the end of the larger D - wave …
Technical Analysis – KASPA/USDT (1D) + spot trade planTechnical Analysis – KASPA/USDT (1D)
Trend Structure & Price Action
KASPA experienced a strong bullish rally (highlighted in orange) starting in mid-April, followed by a descending channel (bullish flag) correction (highlighted in green).
Currently, the price is approaching major support zones, indicating a potential reversal opportunity.
Support & Buy Zones (Marked)
Buy Spot 1: ~$0.062–$0.067 → Key historical support, potential bottom range.
Buy Spot 2: ~$0.070–$0.075 → Moderate support, former resistance turned support.
Buy Spot 3: ~$0.078–$0.081 → Current local demand zone and trendline interaction.
These zones represent incremental buying opportunities during correction.
Indicator Analysis
Market Cipher / Divergence Indicators
Multiple bullish divergence signals are forming (green dots), suggesting buyer interest is growing.
Momentum is in deep negative territory and may be bottoming.
RSI (14)
RSI is at 32.95, which is approaching oversold territory (below 30), signaling a potential reversal.
Money Flow Index (MFI)
MFI is at 19, which is also considered oversold, showing capital is leaving but likely nearing exhaustion.
Stochastic RSI
Stochastic RSI is below 10 (6.22) and starting to cross, indicating a strong potential bullish reversal in the short term.
Trading Plan – KASPA/USDT (Spot Strategy)
Entry Strategy (DCA)
Buy Spot Entry Range Allocation Reason
Spot 1 $0.062 – $0.067 50% Major long-term support, deep oversold zone
Spot 2 $0.070 – $0.075 30% Mid-range support, confirmation zone
Spot 3 $0.078 – $0.081 20% Early entry for aggressive traders
Risk Management
Stop Loss (optional): Below $0.060 (break of long-term structure)
Average Entry (if all 3 zones are filled): ~$0.071 (estimated)
Capital Allocation: Use max 3–5% of total capital per setup for risk control.
Profit Targets
Target Level Price Rationale
TP1 $0.092 – $0.095 Top of descending channel
TP2 $0.105 Previous swing high (April peak)
TP3 $0.120 Breakout and continuation target
KASPA is currently in a healthy correction within a bullish continuation pattern (falling channel). The confluence of oversold indicators (RSI, MFI, Stoch RSI), support zones, and bullish divergence suggests a favorable buying opportunity for swing or position traders. If the price respects these zones, a bounce toward the prior high or breakout levels is likely.
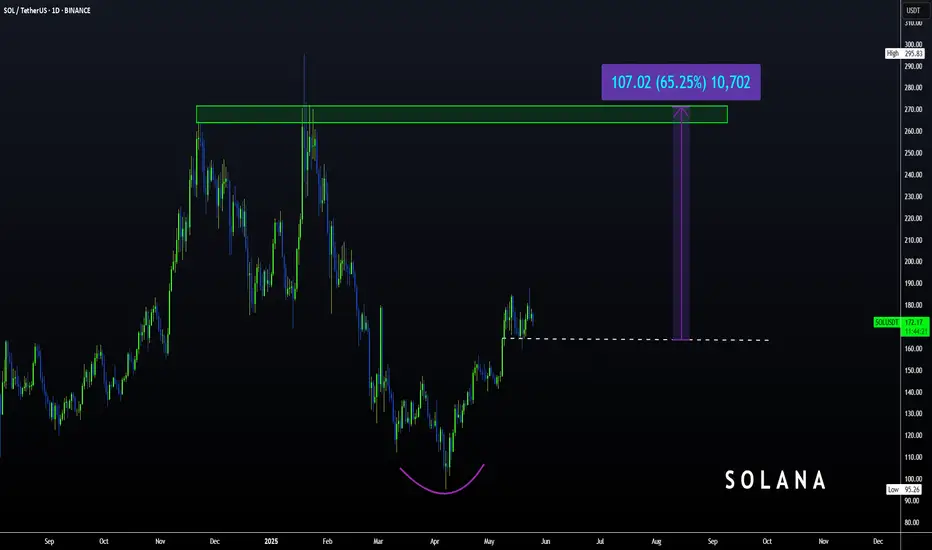
Solana | SOL spot TRADE SETUP +65%Firstly, let's look at the SOL chart from a larger view to confirm the agreement for a bullish setup.
What we see above is a clear bullish bottom, followed by a sharp V-Shaped recovery in the daily timeframe.
From here, the ideal entry could be within this zone, either dollar-cost average or just one spot buy:
With the STOP-LOSS around here:
And THREE TP (take profit) points:
1️⃣
2️⃣
3️⃣
Naturally with the timeframe of your HOLD increasing as your target moves higher.
_________________________
BINANCE:SOLUSDT
Potential break and retest of ATH's on SPOT!OptionsMastery:
🔉Sound on!🔉
📣Make sure to watch fullscreen!📣
Thank you as always for watching my videos. I hope that you learned something very educational! Please feel free to like, share, and comment on this post. Remember only risk what you are willing to lose. Trading is very risky but it can change your life!

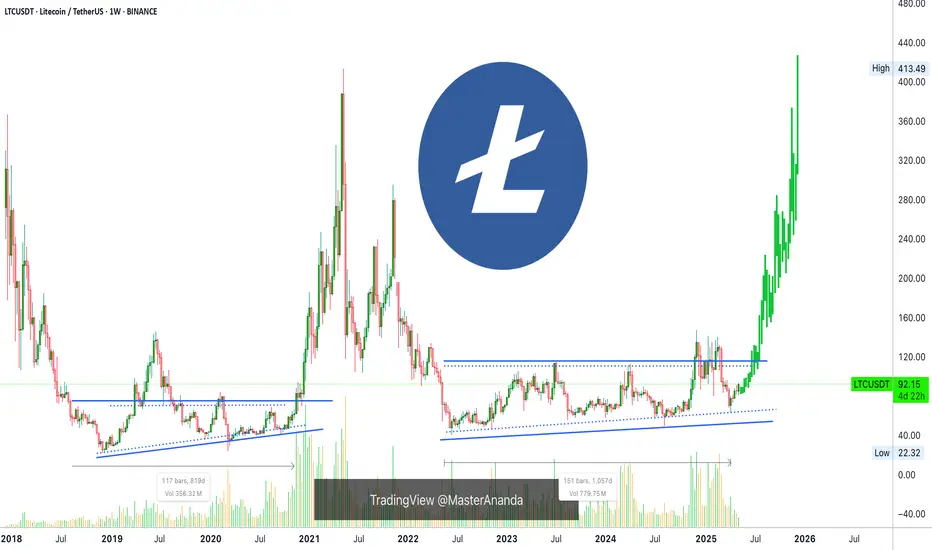
Litecoin Bull Market Bullish Wave Now In The MakingUsing the leverage or not will really depend on what you buy. Bitcoin is trading right now almost at 100K and very close to its All-Time High but this isn't the case for Litecoin or other Altcoins.
Not all your capital should be used for leverage or spot, it can be divided a portion here and a portion there, it is not black or white there is a full color spectrum to choose from and each color have a huge range of gradation. Think about that one for a minute.
If you have to ask the question, "Can I use leverage now?" the answer is always no. The person that can use it don't need to ask. If you have to ask means that you are not prepared or don't know what to expect. Since it is risky and the game is not only the first step, it is better to be prepared.
Using leverage, you can have positions open and "winning" for months and when correction time comes, one mistake can lead to the next until the whole house of cards breaks down and you are left with nothing. It is a complex game to say the least. Learning of course requires practice and for success it is very important to have great entry price and right timing.
How you choose to trade is up to you.
Maybe nobody can beat index funds with compounded interest after tax for 20 years straight or with billions of dollars but individually it can be done in so many ways. It can be done and has been done a countless number of times for 3 years, 5 years, 10 years, 15 years and so on. You don't need a lifetime of this system you just need a big hefty profit and continue with a strategy that adapts to market conditions as you trade and grow.
Investing is not the same as trading. Investors always vouch for buy and hold and do nothing, but trading can be a great asset yet requires work and big money makes it harder, and harder it becomes the bigger the pot.
Individually, as in us, we can make a fortune easy with the right timing, mindset and buy and hold. Buy near the bottom of the bear market or a strong correction. It doesn't have to be the perfect bottom, can be just close and even months away. Sell when prices are high or going up. It doesn't have to be the top nor the exact All-Time High date.
If we can put our capital to grow between 200-500% within each cycle with Crypto, we are not talking billions as we are all small, we can make millions of times more profits than choosing stocks or the investor favorite stock index funds.
The index funds are paying less and less with each passing decade. Crypto is here to shake things up a little bit. A breath of fresh air.
We can go back to high earnings, high profits with very little effort and easy enough that anybody who invest time to actually studying the systems will get their moneys worth. The stock market is so 1950s... Crypto is the future of finance, I don't think there is any doubt anymore.
As long as your money is in the market, you will win long-term.
Namaste.
BTC Range Bound | Breakout Imminent ?👀 Welcome to my Trading View Analysis and Trading Channel Here , we share the latest market analysis, trading signals, and key insights together .
Ready for smarter trades ? ⭐️
⚡️Today , we're going to analyze the BTC( BitCoin) coin together on the daily timeframe and find triggers for our positions .
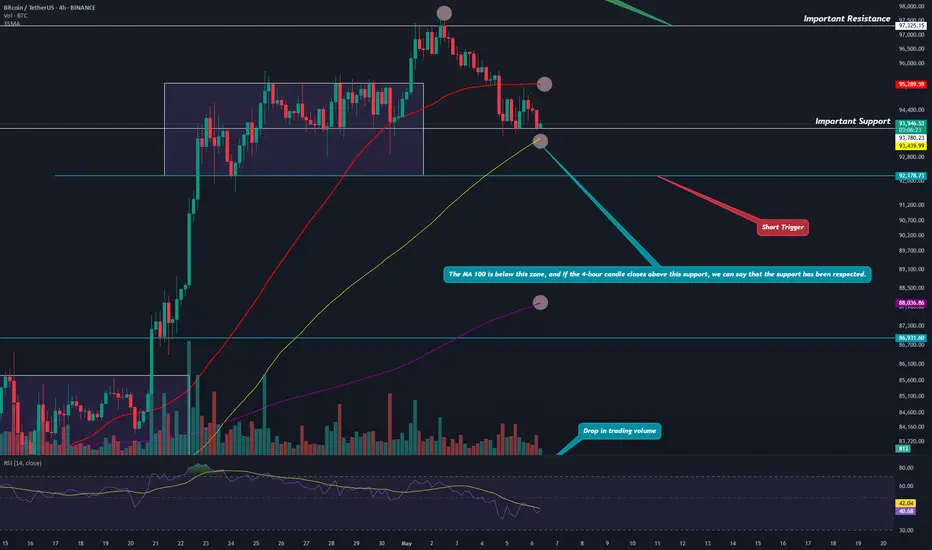
📊✨ Bitcoin 4H Technical Analysis & Weekly Outlook – May 6, 2025
🔸 BTC is currently trading within a consolidation range between $97,325 and $93,780, indicating a potential accumulation zone before the next major move. 🌀
🔍 Key Technical Levels:
📈 Resistance: Break above $97,325 could trigger a long entry, suggesting bullish continuation. 🚀
📉 Support: Drop below $93,780 may activate a short setup, signaling bearish pressure. ⚠️
📐 Indicators Breakdown:
🔹 EMA 100 & 200: Positioned below price, supporting the bullish bias. 🟢
🔹 EMA 50: Currently sitting above the 4H candle, posing short-term resistance. 🔴
📉 Volume: Noticeable decline, showing market indecision – a common pre-breakout signal. 📊
📌 Key Pivot: A candle close above $94,021 would validate it as strong support. 🧱
📰 Positive Market Developments:
🏦 Morgan Stanley plans to offer spot BTC trading via E*Trade – institutional adoption accelerating. 📈
🏢 Strategy (MicroStrategy) signals further Bitcoin accumulation – corporate trust remains strong. 💼
💰 Over $1.8B flowed into U.S. BTC ETFs last week – investor appetite is growing rapidly. 🧲
📈 Analysts forecast BTC reaching $120K–$200K by end of 2025 – fueled by macro trends & halving cycle. 🌕
💡 Final Takeaway:
🔐 Bitcoin continues to prove itself as a valuable long-term asset, backed by rising institutional interest, robust on-chain fundamentals, and strong technical signals. 🌟
📊 Triggers for both long and short positions are clearly marked on the chart – stay sharp and manage risk! 🎯
I love you all so much . 👀
don't forget about capital management and risk management .
Be careful with your positions . 🥇
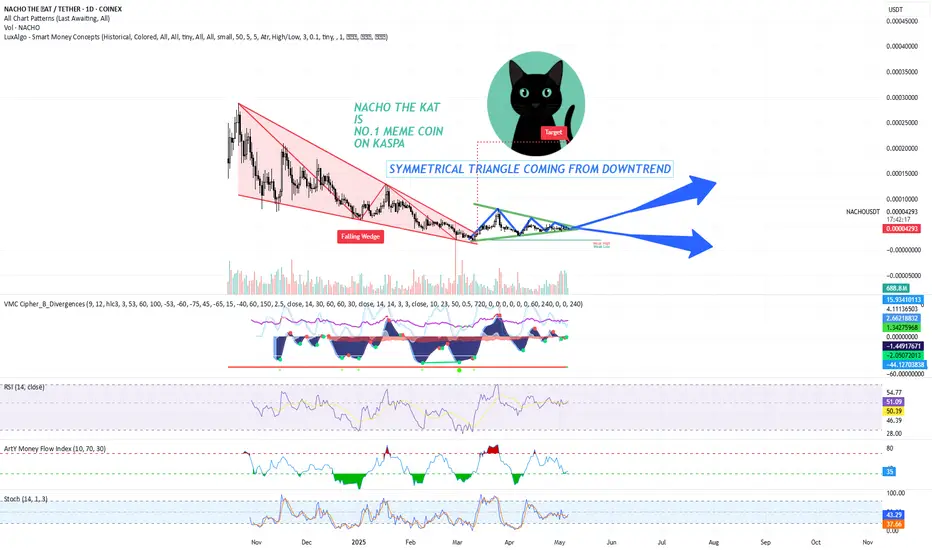
NO.1 MEME COIN ON KASPA IS NACHO THE KAT - DYORThe chart shows a symmetrical triangle pattern forming after a falling wedge. A falling wedge is typically seen as a bullish reversal pattern, indicating that the price may break out to the upside after the convergence of the trendlines. The symmetrical triangle, which is forming after the falling wedge, suggests consolidation before the breakout, likely pointing towards higher price action.
Key Points
Price Action and Trend:
NACHO has been in a downtrend, creating a falling wedge. The falling wedge has converging trendlines, which is a common setup for a bullish breakout.
Currently, the price is consolidating within a symmetrical triangle pattern, with lower highs and higher lows, indicating indecision in the market. The breakout from this triangle is likely to be significant, either continuing the previous downtrend or initiating a bullish reversal.
Volume Analysis:
The volume profile at the bottom shows an increase in volume as the price approaches the apex of the symmetrical triangle, suggesting potential strength behind the breakout.
It's important to monitor if volume increases further upon breakout to confirm the strength of the move.
Key Indicators:
RSI (Relative Strength Index): The RSI is currently around 50.39, suggesting a neutral market sentiment. The RSI has been ranging between oversold and overbought territories, which indicates that NACHO has not yet entered a strong trend but may be preparing for one.
Stochastic RSI: The Stochastic RSI is hovering around 37.57, showing a neutral stance, but it is closer to the oversold region, which could indicate that NACHO is near a potential reversal.
Money Flow Index (MFI): The MFI is at 35, indicating that the market is not yet in a strong buying or selling pressure zone. This shows that there is room for price movement based on volume.
VMC Cipher B Divergences: Positive divergence could suggest bullish momentum emerging, even if the price remains in consolidation.
Target and Resistance Levels:
If NACHO breaks out to the upside from the symmetrical triangle, the target is likely near the upper trendline of the wedge, which aligns with previous highs, possibly reaching the 0.00004500-0.00005000 USDT range.
Immediate resistance is near the 0.00004300 price level.
Support levels to watch are 0.00003000 and 0.00002000, which are key levels from previous price action.
Trading Plan
Entry Strategy:
Breakout Strategy: A strong breakout above the upper trendline of the symmetrical triangle would be a potential buy signal. If the price breaks and closes above 0.00004200, consider entering a long position with a target at 0.00004500-0.00005000.
Volume Confirmation: Ensure that the breakout is accompanied by an increase in volume. A low-volume breakout could be a false signal.
Stop-Loss Strategy:
Initial Stop-Loss: Place a stop-loss just below the symmetrical triangle's lower trendline or 0.00003000. This provides a reasonable distance to avoid being stopped out on small fluctuations.
Trailing Stop: As the price moves up towards your target, consider adjusting your stop-loss to lock in profits, especially if the price exceeds the 0.00004300 resistance level.
Take-Profit Strategy:
First Profit Target: Set a take-profit order around 0.00004500, the first resistance level. This is a key point based on the historical price action and previous swing highs.
Secondary Target: If the price breaks past 0.00004500, adjust the target to 0.00005000, which is the next logical resistance zone.
Risk Management:
Position Sizing: Risk no more than 1-2% of your total capital on this trade. For example, if your trading account is $5,000, you should risk no more than $100-$150 per trade.
Risk-Reward Ratio: Aim for a minimum 2:1 risk-to-reward ratio. For example, if you risk $150 on a trade, aim for a potential reward of $300 or more.
Additional Considerations:
Market Sentiment: As NACHO is a meme coin, market sentiment plays a huge role. Watch for social media trends and any news related to meme coins or Kaspa-based coins that could drive the price action.
Macro Conditions: Stay updated on the general market conditions for cryptocurrencies, as a broader downtrend in the market could limit the upside potential, even if technicals suggest a breakout.
NACHO THE KAT presents a technical setup with the potential for an upward move following a breakout from the symmetrical triangle. A close watch on volume and key price levels will be critical for confirming the breakout and determining the right moment for entry.