SPOT: BUY BCH⏳ SPOT
🪙 Coin: BCH
📥 Enter: 476.02
🎯 Target: 490.78
⚠️ Stop Loss: Don’t Panic
Tell me your ideas. Like and Share 🗣✅
Spot

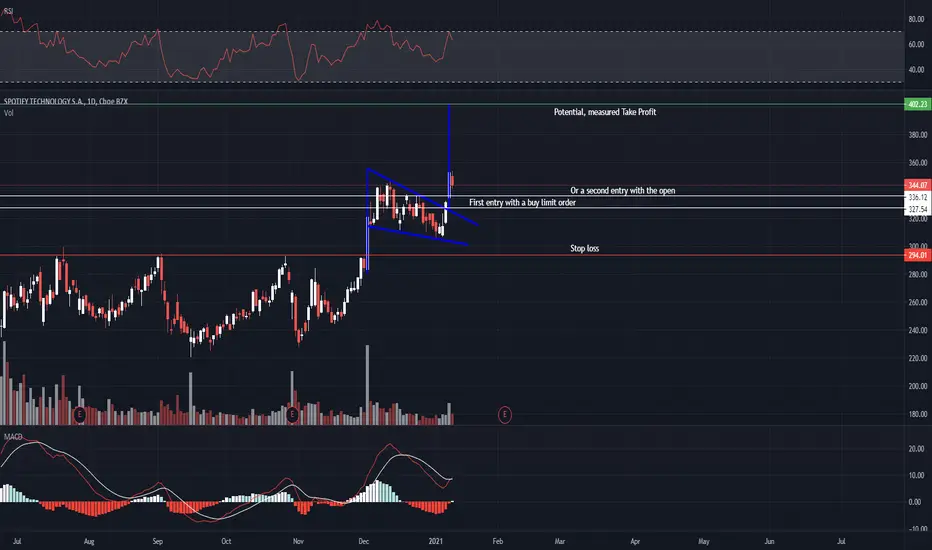
Bullish flag: Example with SpotifyOne of the most commong chart patterns is the flag and it can be a bullish or a bearish depending on the direction it is formed. Usually they are trend - confirming patterns and are occuring after a strong impulse of buying or selling activity, some brief consolidation, and then the price continues in the same direction as the first impulse. The target of the pattern is the "handle" of the flag, meassured from the moment of breach. Sometimes the buying can continue agressively and the price may reach higher than the initial target zone. Traders though interpret differently the target level in regards to the meassurement of the handle. The stop loss is usually placed below the configuration itself, not the handle. That of course can be adjussted by everyone's personal view and risk management. The decision to enter may vary. The first entry can be aggressive with a sell or buy limit near the pattern. Order can be executed after the breach and on the next open, or you can wait out for a correction back to the figure. We say that the flag is complete and confirmed when the initial target level is reached.
In the example we see current development of a bullish flag in Spotify. The breach here was minimal and not that convicning, but the next open was strong and with a gap. Yesterday's close is a classic correction of the initial impulse of 40% to 50% of the candle.
SPOT: BUY LTCUSDT⏳ SPOT
🪙 Coin: LTC
📥 Enter: 131.95
🎯 Target: 136.04
⚠️ Stop Loss: Don’t Panic
Good Luck 🎲
Tell me your ideas. Like and Share 🗣✅

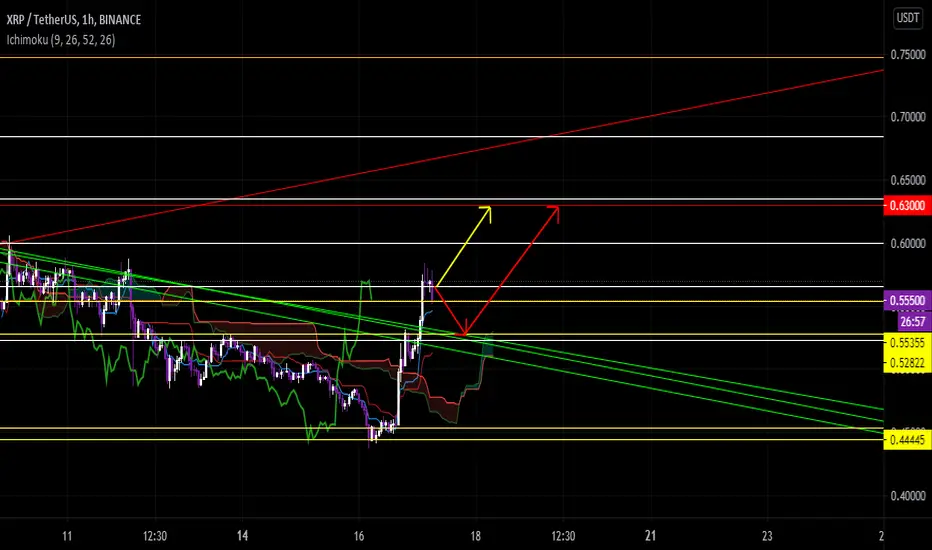
SPOT: BUY XRPUSDT⏳ SPOT
🪙 Coin: XRP
📥 Enter: 0.27335
🎯 Target: 0.28182
⚠️ Stop Loss: Don’t Panic
Good Luck 🎲
Tell me your ideas. Like and Share 🗣✅

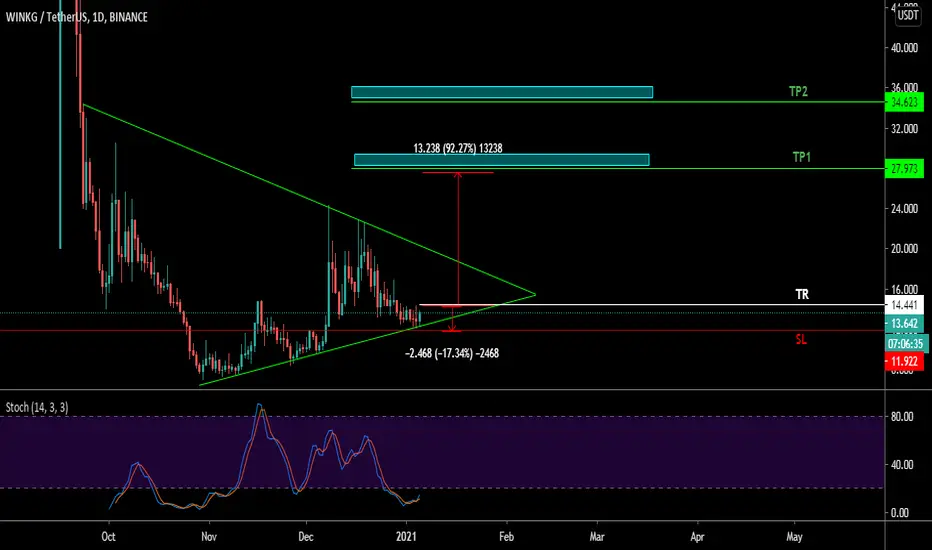
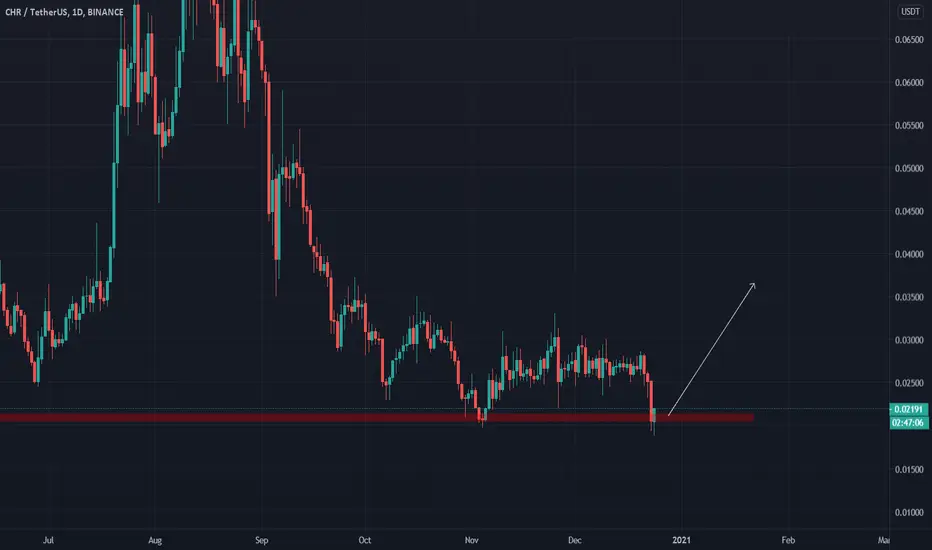
$KMD/BTC 1D (Binance Spot) Descending channel breakout & retestKomodo time is coming, after such downtrend next move up will be massive in my opinion!
Current Price= 0.0000155
Buy Entry= 0.0000155 - 0.0000135
Take Profit= 0.0000238 | 0.0000308 | 0.0000361
Stop Loss= 0.0000361
Risk/Reward= 1:2.02 | 1:3.54 | 1:4.7
Expected Profit= +64.14% | +112.41% | +148.97%
Possible Loss= -31.72%
Fib. Retracement= 0.382 | 0.618 | 0.786
Margin Leverage= 1x
Estimated Gain-time= 1080h


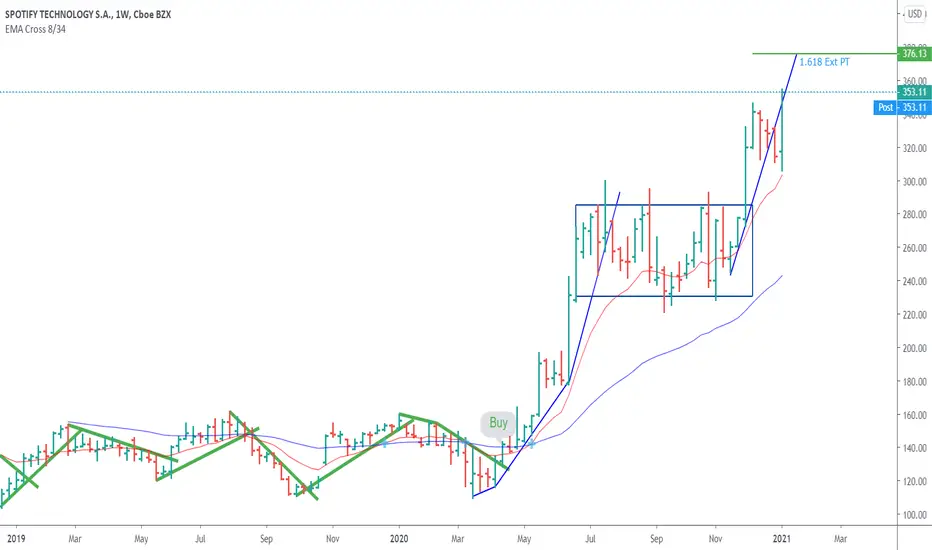
Spotify Fib Price TargetUsing the Fib Retracement tool here is my swing trade price target for Spotify. It has broken out of a parallel channel strongly. Trail up your stop losses on this one using a lower time frame such as the 30 minute or 1 hour.
Update on Spotify: bullish flag triggered Buyers were able to pinch trough the flag's resistance level and thus trigger the formation.
Two scenarios in this case may follow:
1. Price tests again the figure and continues it's way up;
2. Price aggressively starts to rise and complete the flag fast with big volumes;
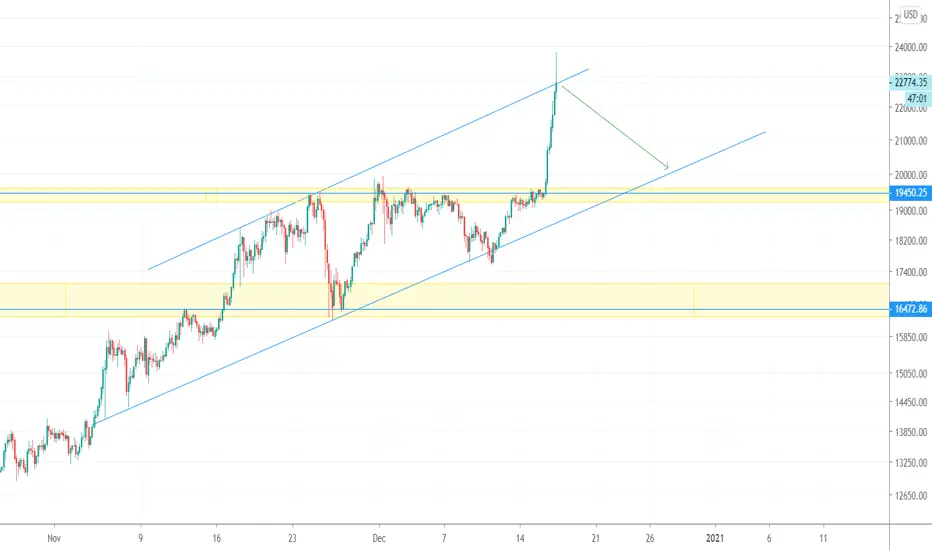
Bitcoin (BTC) • OKEX and Binance now trading above spotFollow-up on my previous video. We end up having another leg up as Binance and OKEX perpetual swaps been trading bellow spot trying to frontrun the market. Now that we saw another $13M being added to liquidations books an perps trading above spot once again is making the correction more likely.
However we need to understand that we are currently in a spot-dominated market boosted by liquidity shortages on the supply side. As such even with perps trading above spot it can keep climbing up due to the frenetic demand coming from spot.

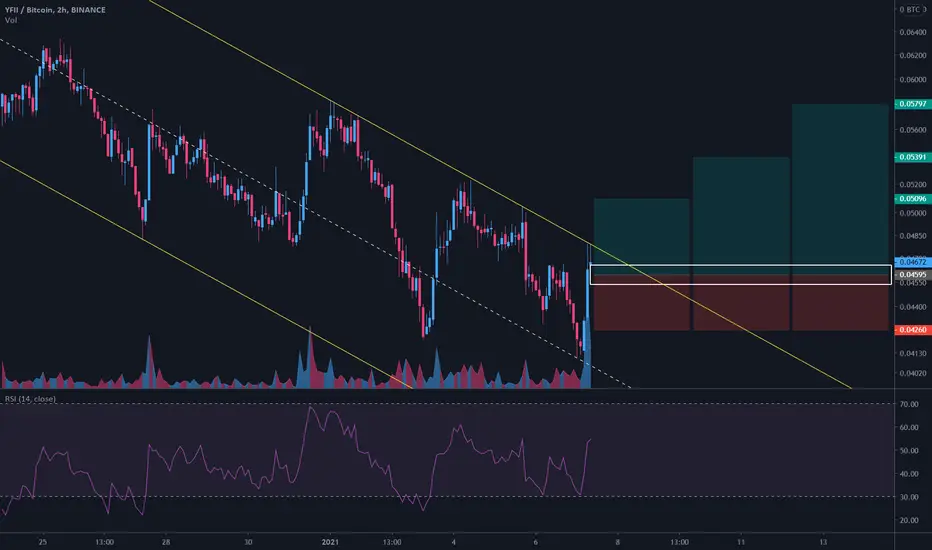
$YFII/BTC 2h (Binance Spot) Descending channel near breakout#DFiMoney seems to be preparing for a big move up, watch for breakout!
Current Price= 0.04672
Buy Entry= 0.04655 - 0.04535
Take Profit= 0.05096 | 0.05391 | 0.05797
Stop Loss= 0.04260
Risk/Reward= 1:1.5 | 1:2.38 | 1:3.59
Expected Profit= +10.90% | +17.32% | +26.16%
Possible Loss= -7.29%
Fib. Retracement= 0.618 | 0.786 | 1
Margin Leverage= 1x
Estimated Gain-time= 180h
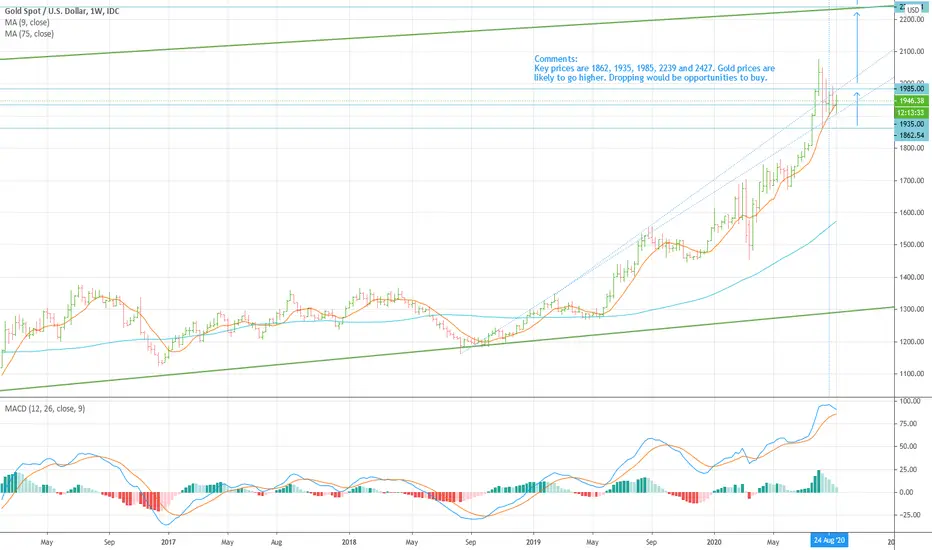
Spot Gold (XAU/USD) prices : up to 2239Key prices are 1862, 1935, 1985, 2239 and 2427. Gold prices are likely to go higher. Dropping would be opportunities to buy.
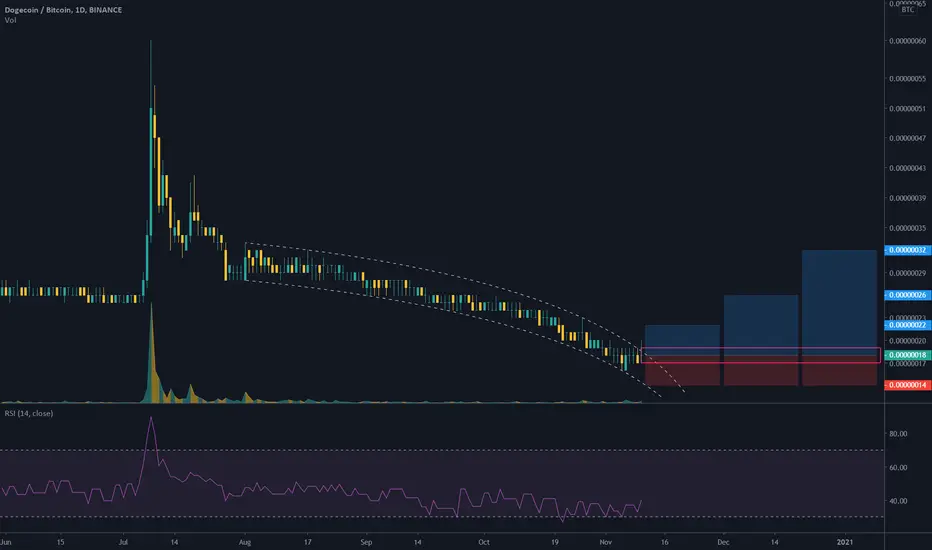
DOGE/BTC 1D (Binance Spot) Descending parabolic channel breakoutDogecoin is used to react well during Alt Season, let's jump in after that clear break-out.
Current Price= 0.00000018
Buy Entry= 0.00000019 - 0.00000017
Take Profit= 0.00000022 | 0.00000026 | 0.00000032
Stop Loss= 0.00000014
Risk/Reward= 1:1 | 1:2 | 1:3.5
Expected Profit= +22.22% | 44.44% | 77.78%
Possible Loss= -22.22%
Fib. Retracement= 0.236 | 0.382 | 0.618
Margin Leverage= 1x
Estimated Gain-time= 1440h
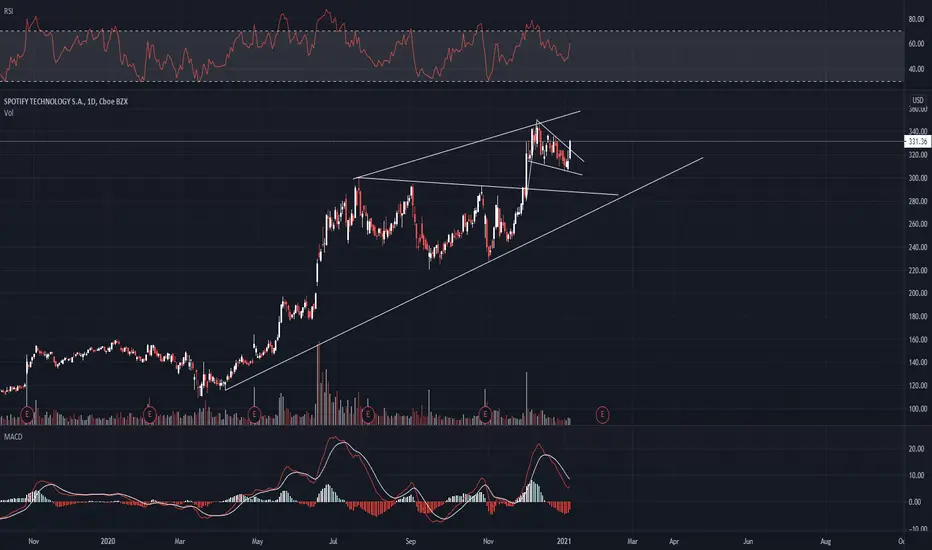
Long Spotify (Spot). Stop loss on a close around 314 or lowerSpotify has shown weakness this week. However, it is offering a great risk reward entry here around 316. Target top of channel


US Stock In Play: $SPOT (Spotify Technology S.A)The successful breakout of $SPOT that was previously highlighted (a five months consolidated range pattern), have seen Spotify rallied to an all time high establishment at $346.44 on 11th December 2020. This breakout is also accompanied with its ATR (14D) peaking at $15 per day average volatility, signifying substantial attention of $SPOT from the Wall Streets at the moment.
This week, $SPOT have not been able to capitalize on the broad market rally, with an accumulated correction of -5% from its peak. The current immediate support to watch is at $312 this week.

BCH/BTC 6h (Binance Spot) Descending triangle near breakoutBitcoin Cash is preparing for next big move, I believe it will be upwards.
Current Price= 0.015772
Buy Entry= 0.015898 - 0.015408
Take Profit= 0.017398 | 0.018854 | 0.021621
Stop Loss= 0.014495
Risk/Reward= 1:1.5 | 1:2.75 | 1:5.13
Expected Profit= +11.11% | +20.41% | +38.08%
Possible Loss= -7.43%
Fib. Retracement= 0.5 | 0.786 | 1.272
Margin Leverage= 1x
Estimated Gain-time= 480h
