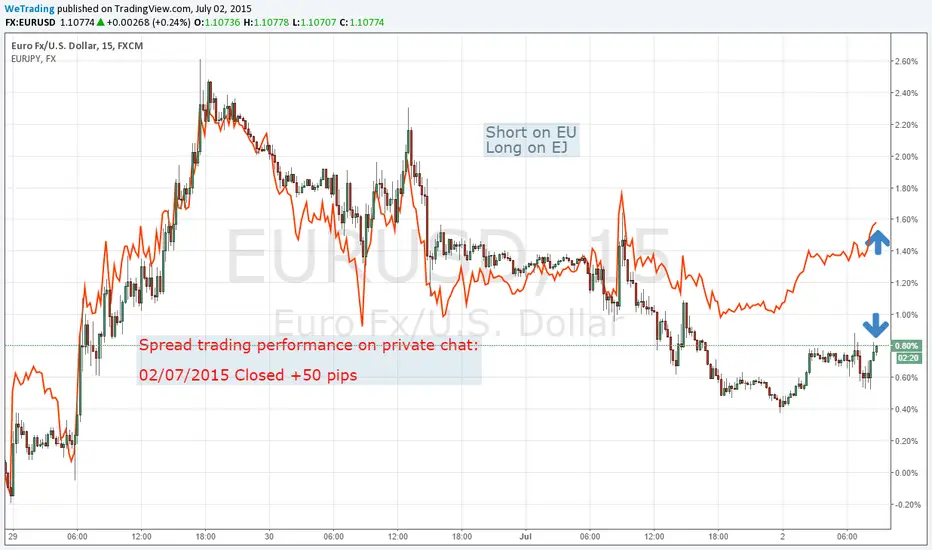
Still long on EJ and short on EUToday we have closed the spread trading opened yesterday with +50 pips.
Now the spread is still long on EJ and short on EU.
We are waiting for a new trades
Spread
ITALY vs GERMANY - SPREAD AT THE HIGHEST EVER - STOCKS... "when they tell you that the Spread with Germany is at its lowest ever not believe... this is the only one that is important"...
01/01/2002 - 01/08/2009 : Spread vs DAX FTSE MIB lows . Divergence contained
01/08/2009 - 01/12/2014: BOOM BREAKS Spread between DAX and FTSE MIB . After 2000 days DAX " Overperforming " FTSE MIB approximately 130% since 2002 ( euro entry)
01/12/2014 - 13/04/2015: Stocks "fee" the ECB QE . Spread vs DAX FTSE MIB at the highest ever. DAX " Overperforming " FTSE MIB 167% since 2002 ( euro entry)
EURO IS GERMAN RULES

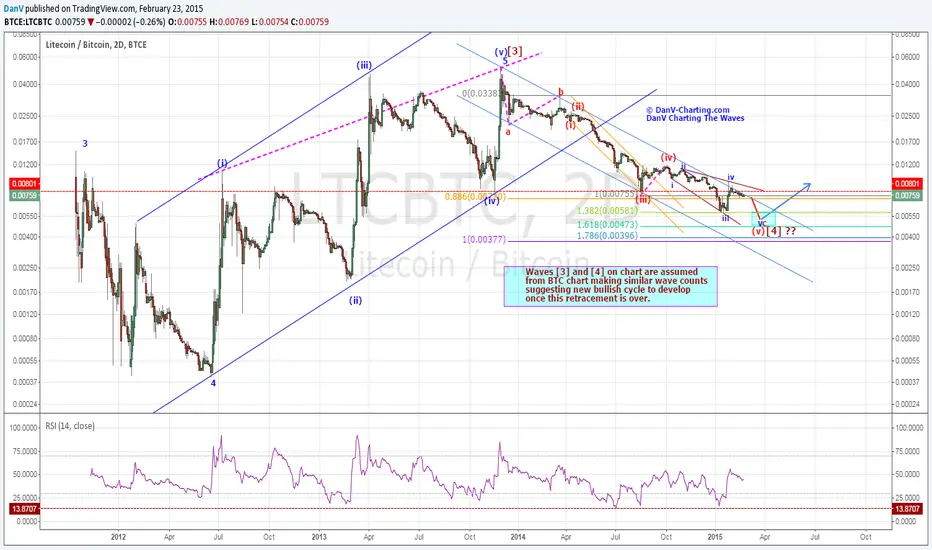
LTCUSD/BTCUSD - BEARISH CYCLE STILL IN PROGRESSWhilst I have shared this spread chart of LTCUSD/BTCUSD several times over the last 18 months or so, I have not directly published this as a main chart.
However, as requested by quite few Crypto traders, I feel it is appropriate to so.
This spread charts like any ratio charts can help to gauge potential trend change, but it must be used with care. Since what you are doing is looking at price behaviours of one instrument against another similar instruments in the form of price ratio.
When this is compared with the actual price of the 2 instruments concerned, it would be observed that during the bullish cycle the riskier of the 2, tends to lead to the upside and also during the bearish cycle to the downside.
Logic behind this is that, in rising market traders are willing to take on higher risk for potentially higher return, in doing so they tend to buy instrument that could give them potentially higher return but which also exhibit higher risk profile.
In my experience, this types of relationships could be observed in ratio charts of SP500/Dow Ind, Silver/Gold etc,. Similar ratio analysis is very powerful part of intermarket analysis and could give advance warning of potential trend change or help to confirm it.
Ration analysis could be applied by anyone interested in adding unique perspective on major trend analysis. I covered this topic in details during a relatively long live session which you could view on Youtube - link www.youtube.com
However, caution needs to be exercised as the ratio chart could have potential trend change whilst both the base instruments might still be continuing the trend, except one might move less than the other and temporarily consolidate. On resolution of this in might continue in the existing trend. Nevertheless, strength and weakness are often seen first in the ratio chart.
In this instance both LTCUSD & BTCUSD formed major all time high in Nov 2013, which was accompanied by corresponding high in the ratio chart.
Applying similar technical analysis on ratio chart as applied on the base instruments, it is evident that the ratio chart has continued declining along with them.
Elliott Wave analysis on the ratio suggests, that this ratio chart has some way to go before completing this cycle. Cross checking the ratio chart with the based instrument's respective price charts, it might be possible to get heads up when this bearish cycle or phase is near completion.
Once the low is formed, both the base instruments too would have or be close to posting similar price lows but it might not be the final low in the sense that this might be just the larger cycle wave A from Nov 2013 high and any price progressions to the upside might be retracement. Just a thought to keep in mind at this stage.
As always, do your own analysis for your trade requirement.
Select to follow me and the chart for notification of future updates. If you like the analysis then please indicate this by thumbs up, comments and sharing it with others. If you have an alternative idea then please share for all to learn from.
Thank you for taking the time to read my analysis.
DanV
danv-charting.com
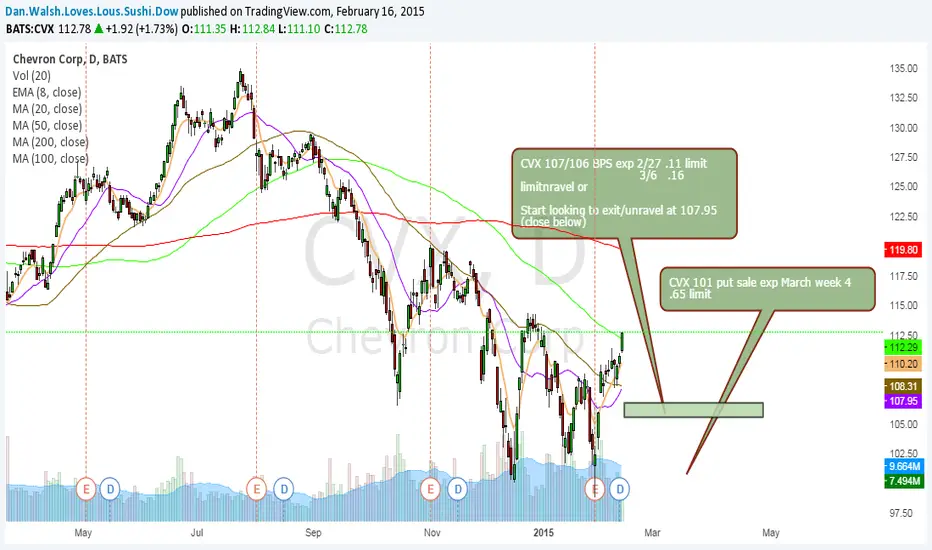
CVX Bull Put Spread and or sell putsCVX has made a strong bullish moved from it low about 102.36 close on 1/30/14 There has been a strong gap and is trading above 10 20 and 50 EMA , and just closed above the 100 SMA. The gap at 107.37 should offer a strong support for a BPS 107/106 EXp 2/27 for .11 or 3/6 for .16.
Should your want to own the shares a 101 put sale will bring in .65 approx.
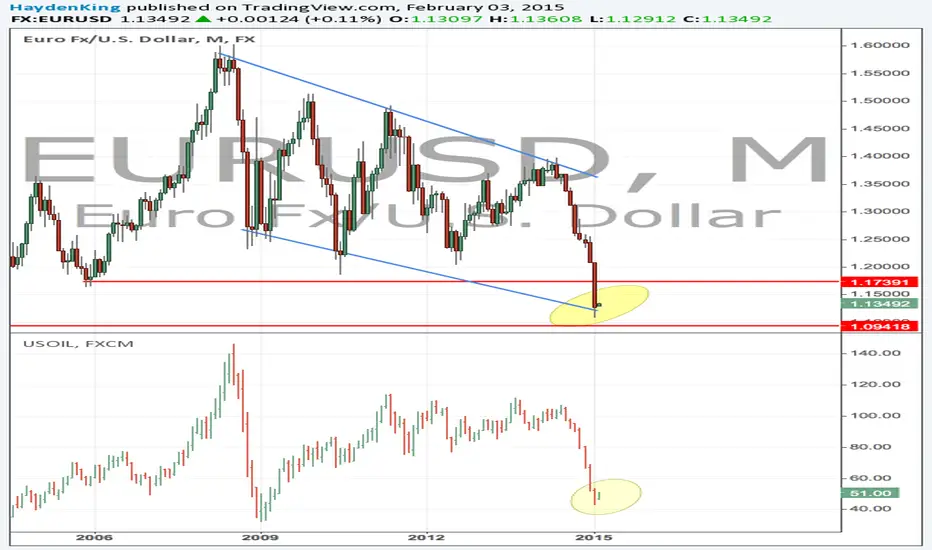
Somthing to Think AboutIn the grand scheme of things it looks as though a shift is ready to take place. It has taken me some time to realize that shift but it is finally here. Take look at the GBPEUR to the left. Notice how its price moves are converse to that of WTI, EURUSD, and XLE.
The yellow circles you see are areas where similar behavior is forming. In the GBPEUR the opposite behavior is forming to the downside. You can see this correlation is approaching a long time resistance level. Just as the EURUSD is approaching a long term support level.
Oil looks to correlate positively with the movement of the EURUSD. As it also moves in exaggeration to the XLE. Using specific points on the XLE as support and resistance. Could I be on to something.....YESSSSS or Maybe I"m reaching...?
This can all simply be money moving back and forth. Most regular people like to sit in cash. There are times where this is good reasoning. Don't just sit in it. Swim in it till you are ready to strike and when you strike do it with the speed to the Millennium Falcon in hyperdrive.
Note: Might be a good idea to run some spreads on these instruments.
Should we be watching the EU and UK to know where we are going?
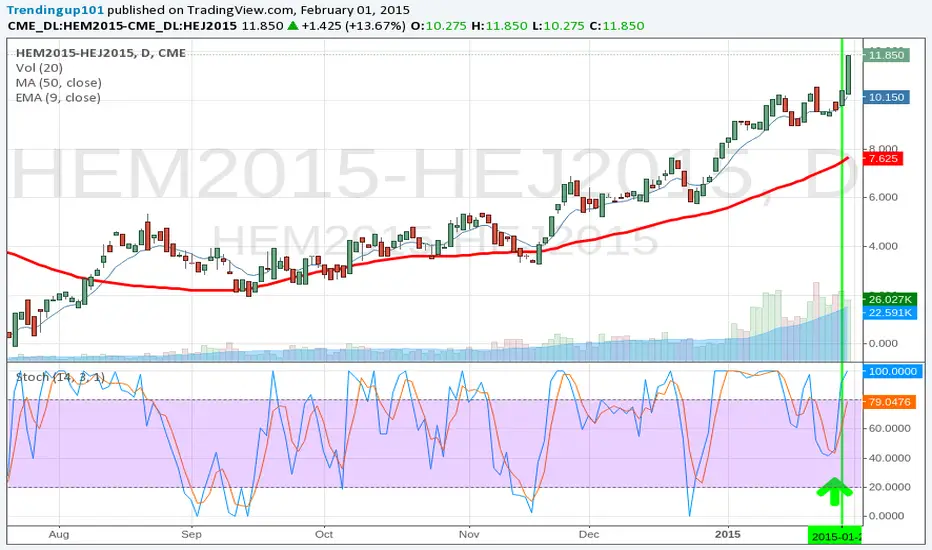
Another Livestock Calender Spread huge move Stoch crossSee how this dip forecasts the strength of the next move above overbought.

Short Hog Spread entered 1-22-15. $480 profit, $990 margin. What an extremely sharp move after a crossover deep below overbought range, right before a huge day on 1-30-15. I wish I could say that I rode this all the way up to it's top but I had a nice little profit at 10.875 and exited when it leveled off after it's strong open just over 11.000. Looking at it now, a trailing stop using the last 14 days Average True Range, which was .6220, I would've given it room to do it's thing and captured it's peak right at close, but that's $250 worth of wiggle room, and it could've gone against me too. For those of you tracking me, this was the recommendation I emailed out on 1-22-15. Trade 4212, 15/15 years profitable, $681 avg profit, which we caught 70.4%. But this is a spread that's been profitable historically for the next 17 days, until 2-19. So I'll be looking for a dip to do it again. Will you be with me?
Trading AUDUSD vs XAUUSD stat arb style. StatArb is one of the most profitable trading strategies employed by trading professionals, Hedge Funds and Proprietary Trading firms. Now the same signals are available for everyone.
Green circle is "Buy Spread" when you buy the higher pair and sell the lower pair, red circle is the opposite. "+" and "-" are suggested stop loss and take profit levels. The grey area chart represents normalized spread between two pairs

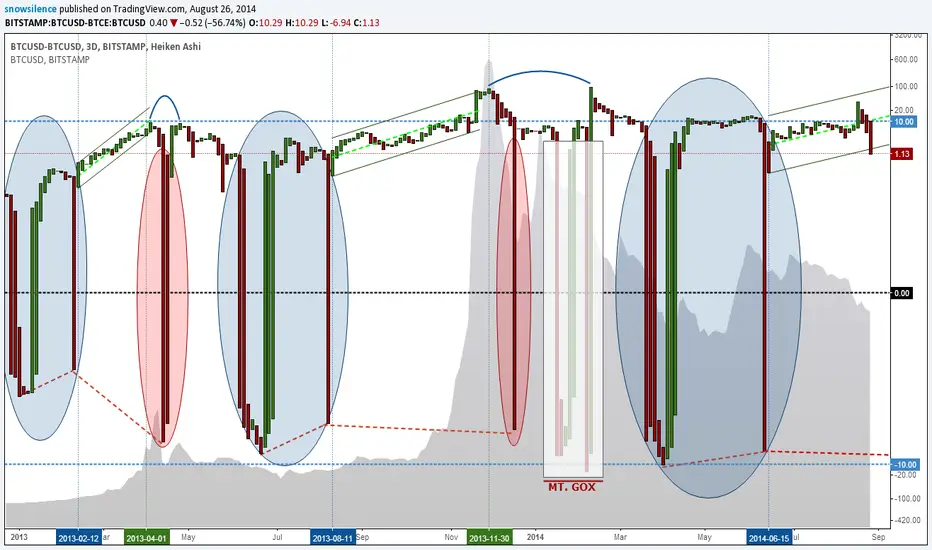
Bitstamp–BTC-e Spread Exhibits Deep StructureThere is a recurrent and long-standing pattern within the spread between these two exchanges. A few months before every "bubble" begins, the spread funnels itself into a tidy channel, which it essentially remains in until the price peaks, though displays no other internal order. There are also clearly other structural self-similarities. As you look back in time you see that the signal become noisier but, moving forward, these characteristics are emerging and becoming amplified with each new pass/cycle. —On another note, you can also see the effects from the "Mt. Gox" section were essentially like having a mini bubble and subsequent crash, inside the crash from the main bubble.— Deep market mechanisms must account for this behavior, and there will likely be much to infer from it. Obviously, for the current cycle, there is no way for me to draw the "correct" channel without knowing the future, so the existing one is merely illustrative.
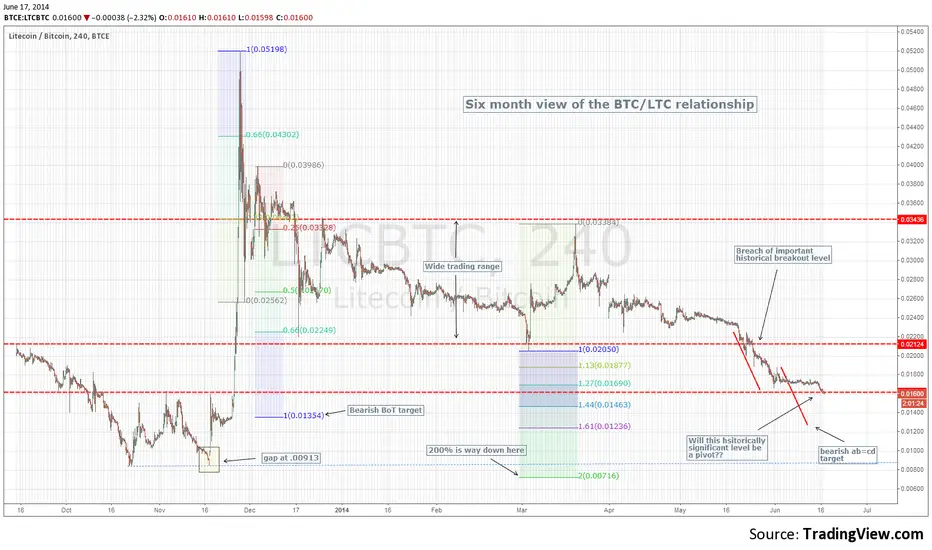
BTC/LTC Spread - no bottom yet I'm affraidWith the recent topping action in BTC it has been interesting and a little disappointing to watch LTC's outright failure. Indeed, Litecoin's inability to hold significant support levels has both broken its bullish bias and once again brought it's relevance as #2 to BTC into question. With this relationship continuing to decouple, I thought I would take a moment today and look at the historical relationship between the two to see if the spread's relationship (and really its trend) may hint at future expectations.
Here then is a nice four hour chart of that spread (LTC/BTC) going back to last fall. Needless to say, it has been a very tough past six months for the bulls. A bear market is defined simply as lower highs and lower lows and that is basically what has transpired; especially so since the failure of the winter trading range lows at .02124. The sky's did brighten a bit through the end of May as it looked like a capitulation bottom had been formed. After a two week consolidation, bull's hearts where broken once again as we have now broken through the bottom of that range. Price has now reached the original double bottom that started the meteoric rise late last November and the bulls are left to ponder if this old significant level is 'the bottom'. Unfortunately, until we stop making new lows and start making new relative highs, I can't make the bullish case here. Indeed, with the recent failure of the top of the original double bottom (.1625) three very real downside targets present themselves.
1. Bearish BoT target .01354
2. Gap at .00913
3. 200% extension of the winter trading range failure: .00716
So what can we infer from this rather negative outlook? Here are a few of my thoughts: While attractive, there is no long trade on this spread at the moment. One could argue that bear "BoT' setups (a way to play bear ab=cd harmonic price patterns) are perfectly realistic into stated downside targets. Until we start to see a pattern of higher highs and higher lows, bulls must sit and wait.
Cheers all and hope it helps
If my charts help you, or you use my indicators...
please consider a BTC donation to allow me to
continue my work :
1EBttA56cWsgtsZn83VGiNT8si7inZV5Z5
& follow me on Twitter @CRInvestor