S&P500 (CASH500) (SPX500) SHORT - Head and shoulders 30minRisk/reward = 3.3
Entry price = 6314.8
Stop loss price = 6318.4
Take profit level 1 (50%) = 6301.3
Take profit level 2 (50%) = 6297.5
Waiting on validation from a few other variables.
For example, waiting for the current 30min candle to close in range.
Letssss goooooo
SPX (S&P 500 Index)

SPX500 Eyes Further Upside After Breaking to New HighSPX500 | Technical Overview
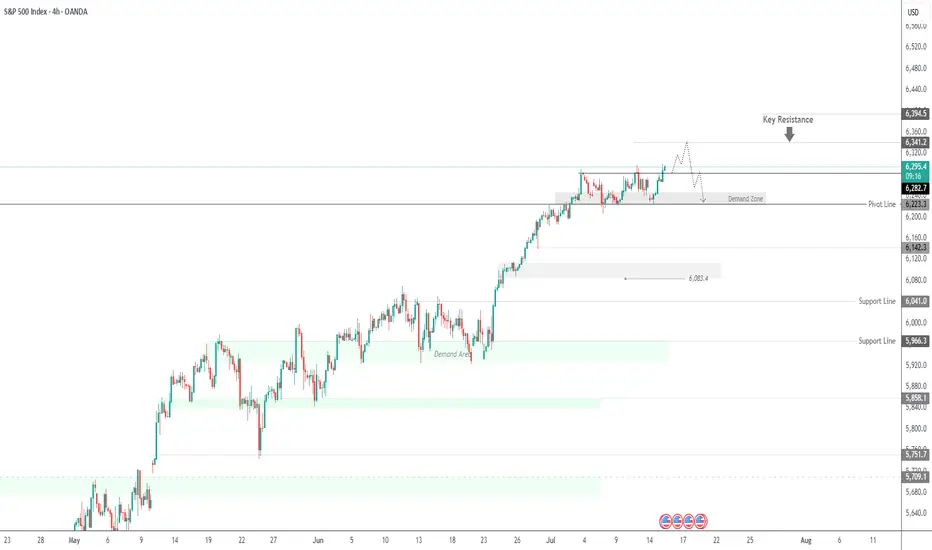
The price continued its bullish momentum after stabilizing above the 6283 support level, as anticipated. It has since posted a new all-time high (ATH) and is currently aiming for the next key resistance at 6341. A confirmed breakout above this level may open the path toward 6393.
On the downside, a break and sustained close below 6283 would shift the structure bearish in the short term, potentially targeting 6223.
Pivot line: 6283
Resistance: 6341 – 6393
Support: 6247 – 6223
previous idea:

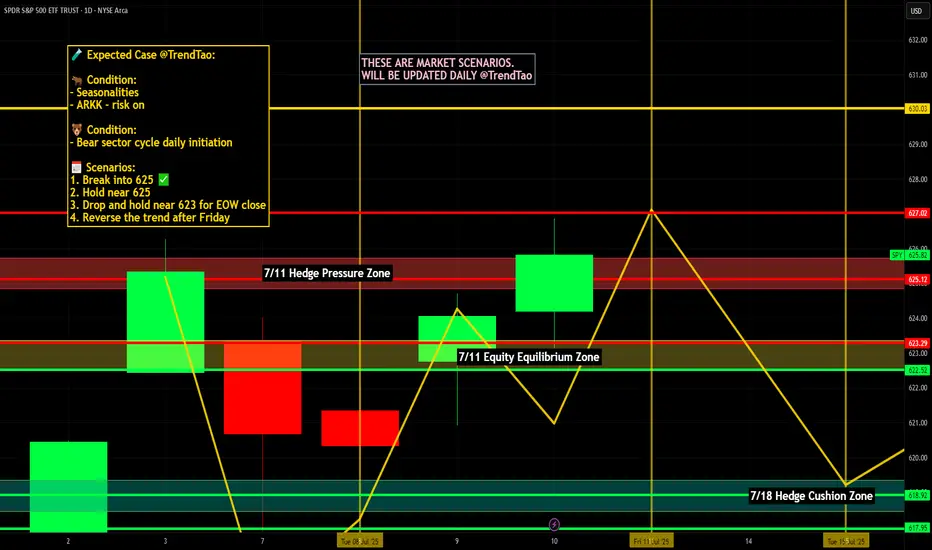
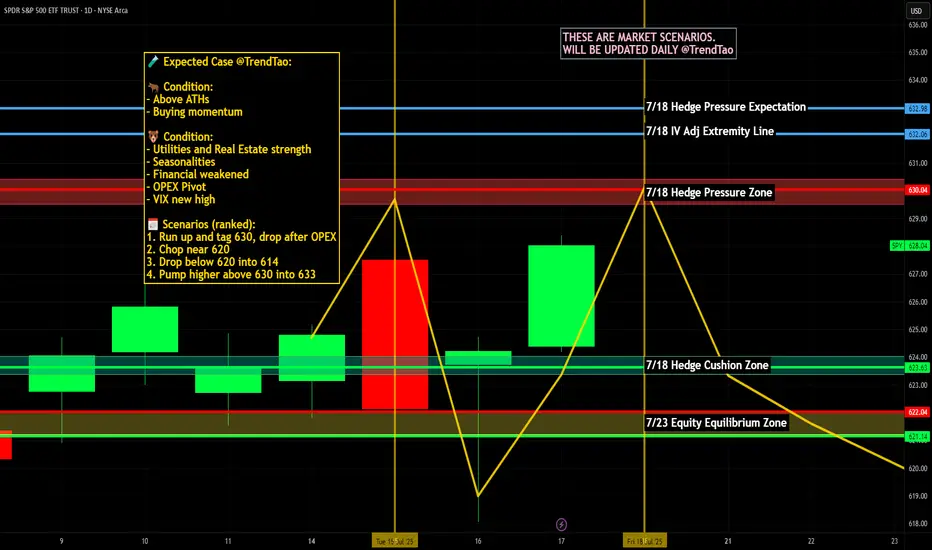
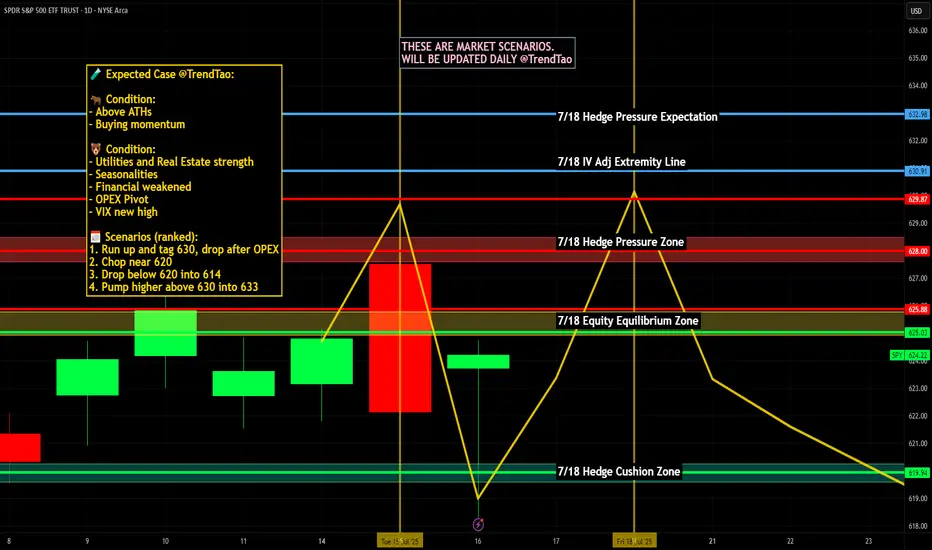
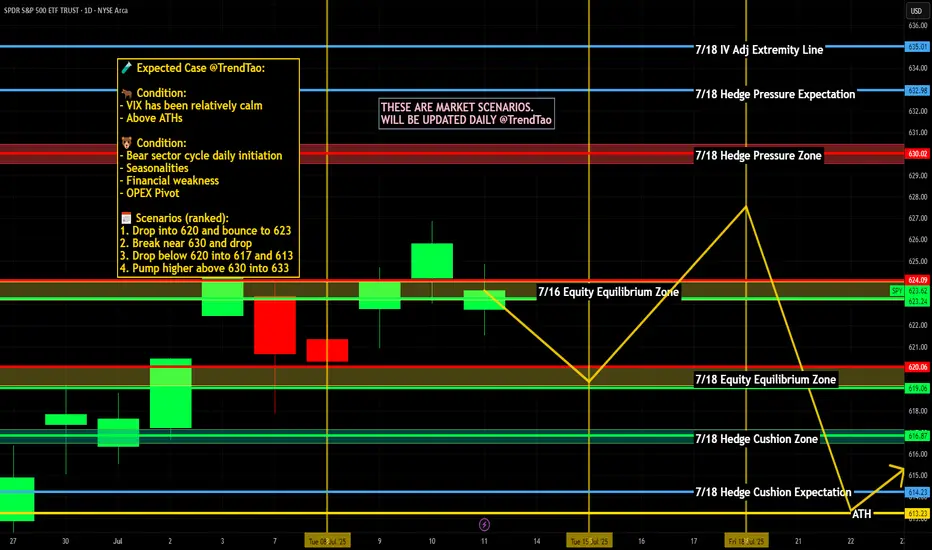
Nightly $SPY / $SPX Scenarios for July 19, 2025🔮 Nightly AMEX:SPY / SP:SPX Scenarios for July 19, 2025 🔮
🌍 Market-Moving News 🌍
🏢 U.S. Corp Buybacks Set to Propel Stocks
Citadel Securities expects U.S. companies to repurchase roughly $1 trillion of stock in 2025. With the blackout period ending in August, buybacks—historically strong in July, the stock market’s best month—could bolster valuations
⚖️ Fed Independence Debate Intensifies
President Trump’s continued criticism of Chair Powell has already weakened confidence in Federal Reserve autonomy. The fallout shows up in a weaker dollar, elevated Treasury yields, and rising inflation expectations—though stocks have remained resilient
🇺🇸 Immigration Rollback Sparks Economic Concern
The rescinding of Temporary Protected Status for ~900,000 immigrants could remove up to 1.1 million workers from the labor force. Analysts warn of potential stagflation risks, with GDP growth potentially down 0.3–0.4 percentage points and labor-market tightening ahead
💵 Massive T-Bill Issuance Incoming
Following the debt-ceiling deal, the Treasury plans over $1 trillion in T-bill issuance in the next 18 months. Money-market funds are expected to absorb much of it, influencing short-term rates and cash-market dynamics
📊 Key Data Releases & Events 📊
📅 Friday, July 19:
8:30 AM ET – Initial Jobless Claims
Weekly figure on new unemployment filings—a real-time indicator of labor-market resilience.
8:30 AM ET – Existing Home Sales (June)
Measures signed contracts on previously owned homes; key for gauging housing-market health.
All Day Events:
Ongoing corporate buybacks entering open window
Treasury auctions and T-bill issuance updates
⚠️ Disclaimer:
This information is for educational and informational purposes only and should not be construed as financial advice. Always consult a licensed financial advisor before making investment decisions.
📌 #trading #stockmarket #economy #monetarypolicy #debt #housing #labor #technicalanalysis
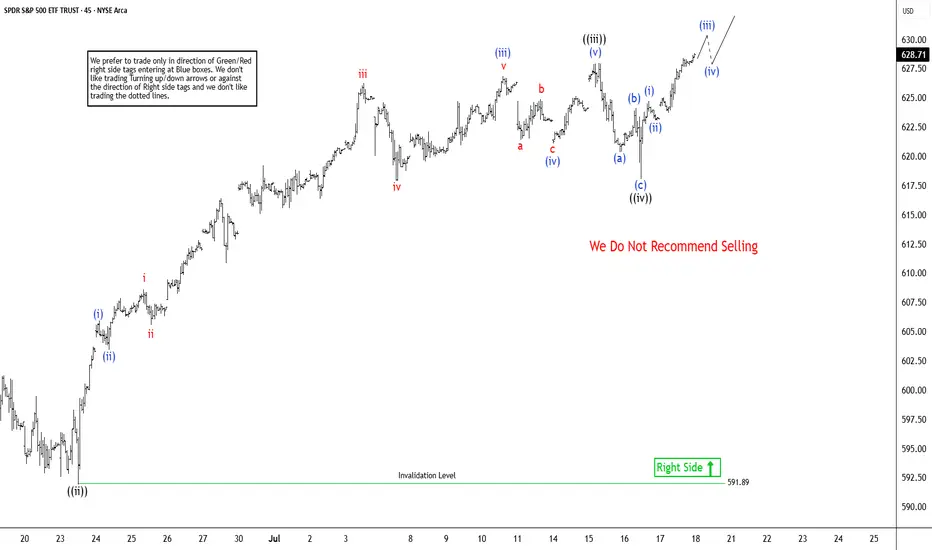
Elliott Wave Analysis: SPY Poised To Extend Higher In Bullish SeElliott Wave sequence in SPY (S&P 500 ETF) suggest bullish sequence in progress started from 4.07.2025 low. It expects two or few more highs to extend the impulse sequence from April-2025, while dips remain above 6.23.2025 low. SPY ended the daily corrective pullback in 3 swings at 480 low on 4.07.2025 low from February-2025 peak. Above there, it favors upside in bullish impulse sequence as broke above February-2025 high. Currently, it favors wave 3 of (1) & expect one more push higher from 7.16.2025 low in to 630.31 – 651.1 area before correcting in wave 4. In 4-hour, it placed 1 at 596.05 high, 2 at 573.26 low as shallow connector & extend higher in 3. Within 3, it placed ((i)) at 606.40 high, ((ii)) at 591.89 low, ((iii)) at 627.97 high & ((iv)) at 618.05 low.
In 1-hour above ((ii)) low of 591.89 low, it ended (i) at 605.96 high, (ii) at 603.17 low, (iii) at 626.87 high as extended move, (iv) at 620 low & (v) as ((iii)) at 627.97 high. Wave ((iv)) ended in 3 swing pullback as shallow connector slightly below 0.236 Fibonacci retracement of ((iii)). Within ((iii)), it ended (a) at 619.8 low, (b) at 624.12 high & (c) at 618.05 low on 7.16.2025 low (this week). Above there, it favors rally in ((v)) of 3 targeting in to 630.31 – 651.1 area before correcting in 4. Within ((v)), it placed (i) at 624.73 high, (ii) at 623.08 low & favors upside in (iii) of ((v)). We like to buy the pullback in clear 3, 7 or 11 swings correction at extreme area in 4 and later in (2) pullback, once finished (1) in 5 swings.
Trade Journal: Missed Morning Move & Trading Into New Highs07/17/25 Trade Journal, and ES_F Stock Market analysis
EOD accountability report: +447.50
Sleep: 5 hours
Overall health: My health ring is signaling that my body isn't well the last few days.
VX Algo System Signals from (9:30am to 2pm)
— 8:53 AM Market Structure flipped bullish on VX Algo X3!
— 12:17 PM VXAlgo ES X1 Sell Signal (triple sell signal)
— 1:12 PM VXAlgo ES X3 Sell Signal
— 1:40 PM VXAlgo NQ X1DD Buy Signal
What’s are some news or takeaway from today? and What major news or event impacted the market today?
Today was a bit of a rough trading day, I missed the morning move and was a bit hesitant to make trades.
Saw a lot of MM positioning high up around 6340s and wasn't sure where to get a good entry. Wanted to go in at the MOB but they never went down there.
Sell signals were not as effective today because MM wanted to make ATH but i couldn't figure out the reasoning.
News
S&P 500 ENDS AT A NEW RECORD HIGH, VIX FALLS AS STOCKS RALLY ON SOLID EARNINGS, STRONG ECONOMIC DATA
What are the critical support levels to watch?
--> Above 6300= Bullish, Under 6290= Bearish
Video Recaps -->https://tradingview.sweetlogin.com/u/WallSt007/#published-charts

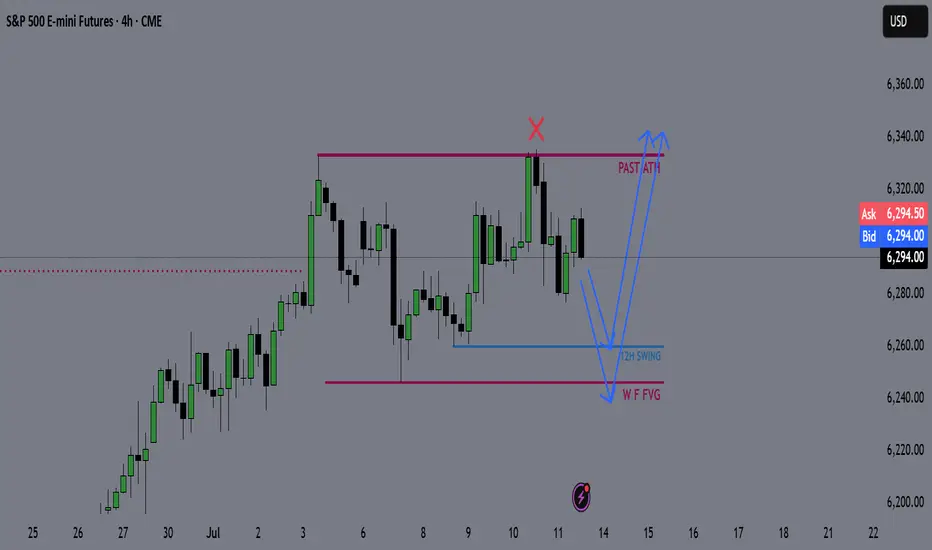
SP500 ES Weekly Recap | ATH Deviation → Pullback or Powell Pump?Overview:
ES made a new all-time high last week, sweeping the previous high with strong momentum.
However, the move ended up being a deviation, and the price quickly reversed — suggesting short-term exhaustion.
Bearish Scenario (Baseline):
🔻 Rejection from ATH
🔻 Possible retracement targets:
12H Swing Low (turquoise line)
Weekly Fair Value Gap (purple zone)
I believe a pullback into those levels could provide bullish continuation setups for new highs. I’ll look for LTF confirmation once price reaches those zones.
Bullish Scenario (Catalyst-Driven):
🚨 If Fed Chair Powell resigns this week (a circulating macro rumor), the market may not wait for retracement.
This could lead to an aggressive breakout, driving ES and risk assets straight into new ATHs again.
Plan:
✅ Watch for LTF confirmation after pullback
✅ Stay open to both scenarios
✅ Focus on HTF bullish structure as long as key levels hold
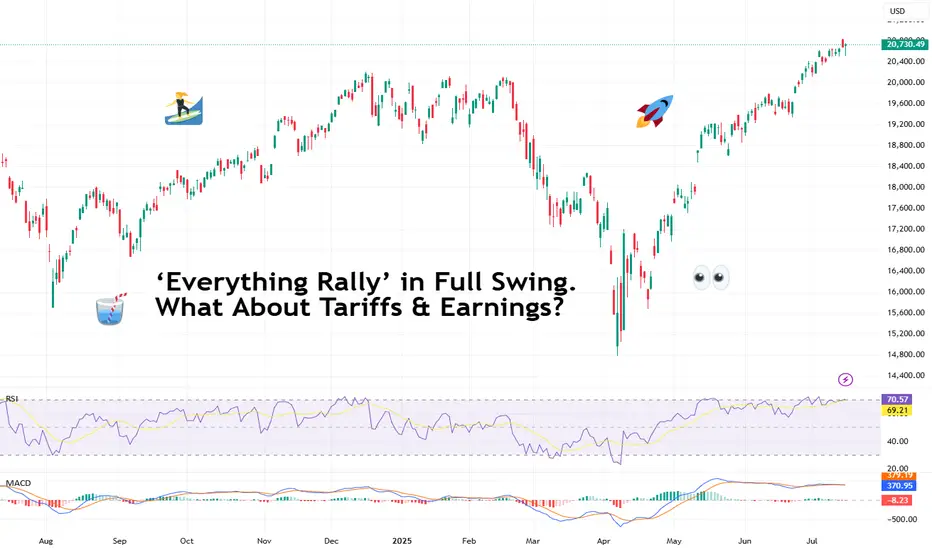
‘Everything Rally’ in Full Swing. What About Tariffs & Earnings?It’s official: we’re witnessing one of those rare, confounding moments when nearly every big risk-on thing is screaming ATH! (All-Time High, for those who haven’t worn out that abbreviation on X this month).
Bitcoin BITSTAMP:BTCUSD blew past $122,000 on Monday — a turbo rally that made anyone who stepped away to brew coffee rethink their life choices.
Meanwhile, Nvidia NASDAQ:NVDA ? It didn’t just approach the $4 trillion milestone — it showed up, took the crown as the world’s most valuable company , and made the Nasdaq Composite NASDAQ:IXIC pop a fresh record close for dessert.
And the S&P 500 SP:SPX ? The broadest slice of US equities did its part too, hitting a record high last week, despite the world’s loudest tariff chatter from Trump 2.0. So, what gives?
💎 Bitcoin: Too Fast to Chart
Let’s start with the fire-breathing dragon. Bitcoin BITSTAMP:BTCUSD rocketed to $122,500 on Monday morning, bruising all those short sellers and juicing up the memes. The OG coin now has a market cap above $2.3 trillion — bigger than most economies, enough to make gold bugs break into cold sweats. (True, it did pare back some of those gains to float at $119,000 Thursday morning.)
What’s fueling it? Institutional FOMO. Forget diamond hands — big money managers, ETF behemoths , and corporates are scooping up every sat they can find.
When you see that, plus macro tailwinds — a weaker dollar, simmering inflation that nudges the Fed toward cuts — the rocket fuel writes itself. But we all know what traders really want to know: is $125,000 next? Short answer: if momentum holds, you bet. Long answer: mind the next Fed move and the tariff chess match.
🎯 Nvidia: From GPUs to GDPs
If you thought Bitcoin’s wild run was the only headline, look again. The real flex this month came from Jensen Huang’s chip juggernaut. Nvidia NASDAQ:NVDA didn’t just break a record — it basically invented a new category for corporate mega-caps.
The world’s biggest semiconductor firm hit the $4 trillion mark — the first company ever to do so. And this isn’t some overnight fad. Back in 2019, Nvidia crossed $100 billion for the first time on the back of crypto mining booms.
Five years later, it’s stacked on 4,000% gains, riding the AI hype like it’s a permanent bull market. Governments, hyperscalers, cloud titans — they’re all shoving billions at Huang’s AI chips.
💻 Nasdaq: AI, Chips, Crypto — Party On
The Nasdaq Composite NASDAQ:IXIC logged yet another record close , up about 7.5% on the year so far.
Just three months ago, this index looked battered — trade war threats, tariff rants, sticky inflation. Who’s doing the heavy lifting? The Magnificent Seven, mostly. But it’s Nvidia’s chart that’s turned this whole index into a de facto AI ETF.
Is it healthy? That depends. As long as earnings season doesn’t break the dream — and there’s no rug-pull from the Fed — traders are letting the momentum do its thing.
🏦 S&P 500: The Record Chaser
What about the S&P 500 SP:SPX — the broadest barometer of America’s corporate muscle? It rose to set its own record high last week before coming down on Friday on renewed tariff jitters.
The Wall Street darling looks less explosive than its tech-packed peer, the Nasdaq. But it’s still up nearly 7% year-to-date — and up 26% from the April dip when tariffs spooked everyone out of their leveraged longs. Now? It’s back in record territory, brushing aside GDP contraction and inflation that won’t quit.
Why? Because the market is forward-looking. Tariffs may sting, but when the Fed hints at cuts and Trump sticks to his MAGA narrative, risk assets catch a bid.
🧨 What About Those Tariffs, Though?
Speaking of tariffs, let’s not pretend they’re not looming. Trump threatened over the weekend to ramp up levies on EU goods to 30% starting August 1 if no new deal emerges. Canada got an earful too: 35% on certain Canadian exports — and Ottawa announced a $21 billion tit-for-tat.
The “pause” on reciprocal tariffs ends in a few weeks. So, is this noise or real risk?
For now, markets are calling the bluff. Investors have tuned out the saber-rattling, choosing to front-run the Fed’s next move instead. If tariffs spark a deeper trade war, stocks may get a reality check. Until then, the melt-up rules.
🔮 What’s Next? Eyes on Earnings
Earnings season is around the corner (be sure to follow the Earnings Calendar ), and you can bet every fund manager is watching Nvidia NASDAQ:NVDA , Microsoft NASDAQ:MSFT , and the rest of the Mag 7 for cracks in the AI gold rush.
If the big names keep printing double-digit revenue growth, investors should be happy. But any hint of deceleration, cautious guidance, or margin pressure could slam the brakes on this record run.
Your turn : Do you see this melt-up stretching into the second half of the year? Or are we due for a rude awakening once the earnings calls roll in? Drop your take below!

Nightly $SPY / $SPX Scenarios for July 17, 2025🔮 Nightly AMEX:SPY / SP:SPX Scenarios for July 17, 2025 🔮
🌍 Market-Moving News 🌍
🇮🇳 India–U.S. Inflation Divergence Dampens Dollar
India’s June retail inflation tumbled to a six-year low, while U.S. CPI hit its fastest pace since February—driven by tariff effects. This divergence is weakening the U.S. dollar against the rupee, pushing down dollar‑rupee forward premiums
📜 Treasury to Ramp Up T-Bill Issuance
Following the recent debt-ceiling increase, the U.S. Treasury plans to issue over $1 trillion in T-bills over the next 18 months. Money-market funds, flush with cash, are expected to absorb the supply, which could influence short-dated yields
💱 Dollar Eases Amid Fed-Related Volatility
Headline news that President Trump “highly unlikely” to fire Fed Chair Powell, coupled with stable PPI data, calmed markets. The dollar dipped slightly after earlier turmoil, while gold and bonds saw modest gains
📊 Key Data Releases & Events 📊
📅 Thursday, July 17:
(No major U.S. economic releases)
Markets will track T-bill issuance plans, dollar forward dynamics, and statements from the Treasury and Fed regarding debt and rate strategy.
⚠️ Disclaimer:
This is for educational purposes only—not financial advice. Consult a licensed financial advisor before making investment decisions.
📌 #trading #stockmarket #economy #dollar #tbills #inflation #Fed #technicalanalysis
BRIEFING Week #29-30 : BTC stalling, ETH & then Alts ?Here's your weekly update ! Brought to you each weekend with years of track-record history..
Don't forget to hit the like/follow button if you feel like this post deserves it ;)
That's the best way to support me and help pushing this content to other users.
Kindly,
Phil

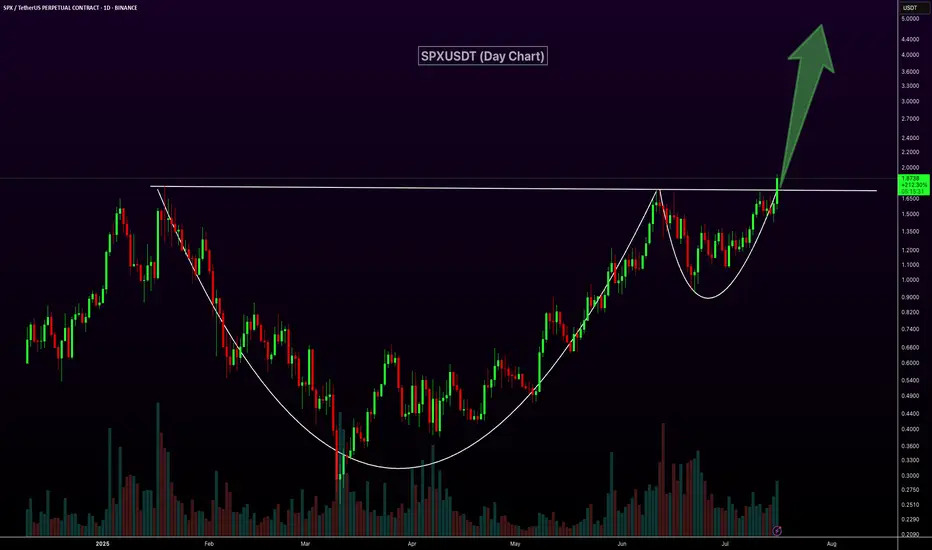
SPXUSDT Forms Classic Cup and HandleSPXUSDT daily chart is showcasing a strong Cup and Handle breakout with high volume, a classic bullish continuation pattern. After a well-formed, rounded base, price has cleanly broken above the neckline resistance around the $1.80 level, supported by strong momentum and a sharp bullish candle. This breakout signals the potential for a significant upside move, with the next leg likely to push toward much higher price levels.
SP:SPX MEXC:SPXUSDT
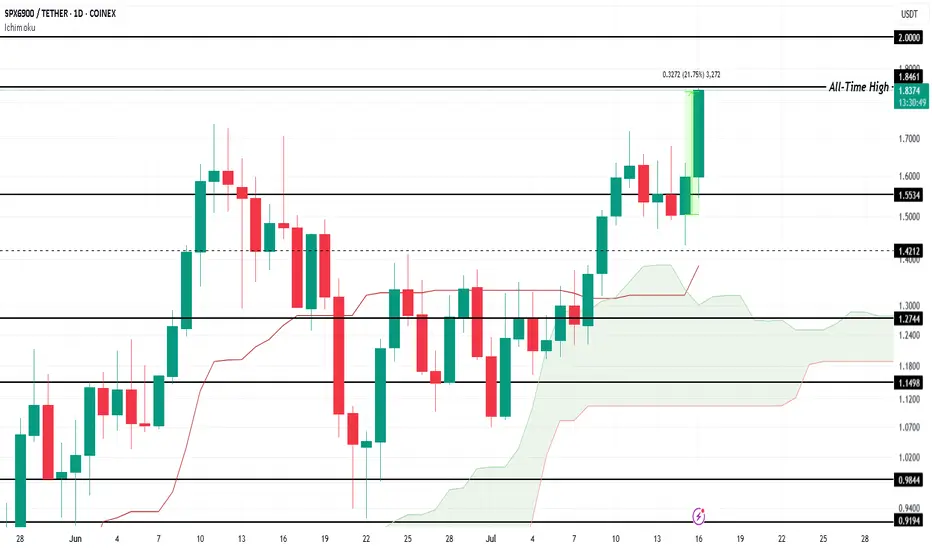
SPX Forms New All-Time High, Price Nears $2.00COINEX:SPXUSDT price has surged by 21.75% over the last 24 hours , reaching a new all-time high (ATH) of $1.84 . At the time of writing, SPX is trading at $1.83, showing promising signs of further upward movement. The altcoin's strong performance reflects growing investor interest and market optimism.
The Ichimoku Cloud, which lies beneath the candlesticks, signals that bullish momentum is currently prevailing for $COINEX:SPXUSDT. This technical indicator suggests that the altcoin could continue its ascent, potentially breaching the $2.00 level in the near future . If the trend persists, SPX could set new price milestones.
However, if COINEX:SPXUSDT experiences significant selling pressure from investors, the altcoin could face a correction. A drop below $1.55 would indicate a shift in momentum and potentially erase some of the recent gains. A failure to maintain key support levels could lead to further downside risks.
SPY/QQQ Plan Your Trade Special Update : BUCKLE UPThis video is a special update for all TradingView members. I felt I needed to share this information and present the case that I believe poses the most significant risk to your financial future - and it's happening right now.
Several weeks ago, I identified a very unique mirror setup in the SPY and kept an eye on how it was playing out. I needed to see confirmation of this setup before I could say it had any real likelihood of playing out as I expected.
As of today, I'm suggesting that we now have excellent confirmation that the US/Global markets are about to enter a deep consolidation phase, lasting through the rest of 2025 and possibly into 2026 and early 2027.
The interesting thing about this price pattern/structure is that it is almost exactly the same as the 2003-2007 structure, which I believe is the origin of this mirror setup. Almost down to the exact type of price bars/patterns I'm seeing.
Many of you are already aware that I've been calling for a critical low cycle in the SPY on July 18 for many months. What you may not realize is that the pattern is based on Weekly price data. The July 18 cycle low can have a span of +/- 1-3 weeks related to when and how the cycle low pattern plays out.
Watch this video. If you have any questions, message me or comment.
I'm still here, doing my best to identify and unlock the secrets of price action and to help as many traders as I can.
Price is the Ultimate Indicator.
Get some.
#trading #research #investing #tradingalgos #tradingsignals #cycles #fibonacci #elliotwave #modelingsystems #stocks #bitcoin #btcusd #cryptos #spy #gold #nq #investing #trading #spytrading #spymarket #tradingmarket #stockmarket #silver

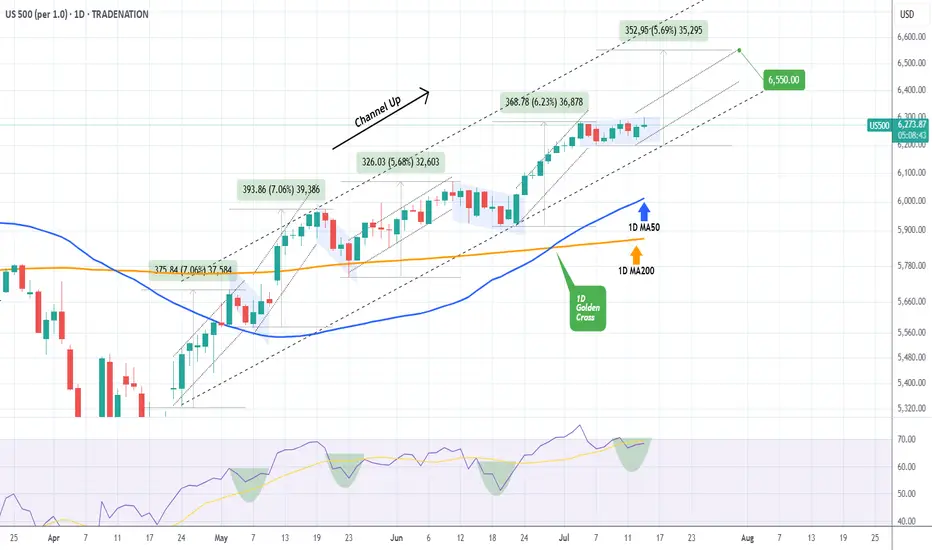
S&P500 Accumulation almost over. New rally begins.The S&P500 index (SPX) has been trading within a 3-month Channel Up pattern, within which, it's been replicating almost the same structure. This involves an aggressive Bullish Leg Phase (dotted Channel Up), followed by a correction/ Accumulation Phase (blue Channels), which eventually leads to the new Bullish Leg.
The 1D RSI fractals among those patterns are similar and right now it seems that we are about to complete the latest Accumulation Phase. Having completed a 1D Golden Cross 2 weeks ago, the time-frame looks more bullish than ever and as long as the 1D MA50 (blue trend-line) holds, we expect at least a +5.68% rise (the minimum of the previous Bullish Legs), targeting 6550.
-------------------------------------------------------------------------------
** Please LIKE 👍, FOLLOW ✅, SHARE 🙌 and COMMENT ✍ if you enjoy this idea! Also share your ideas and charts in the comments section below! This is best way to keep it relevant, support us, keep the content here free and allow the idea to reach as many people as possible. **
-------------------------------------------------------------------------------
Disclosure: I am part of Trade Nation's Influencer program and receive a monthly fee for using their TradingView charts in my analysis.
💸💸💸💸💸💸
👇 👇 👇 👇 👇 👇
Bulls and Bears zone for 07-15-2025ETH session market is trading higher and expected to Open gap up.
Would traders be able to keep that momentum going rest of the RTH session.
Level to watch: 6328 --- 6330
SPX500 Outlook – CPI Data in Focus, Key Pivot at 6282SPX500 – Market Outlook
U.S. futures are climbing as Nvidia plans to resume chip sales to China, fueling positive momentum across tech and growth sectors.
However, investor caution remains ahead of key events:
Major banks ( NYSE:JPM , NYSE:WFC Wells Fargo, NYSE:C Citigroup) will report earnings, offering insights into the financial sector.
All eyes are on the June CPI report, expected at 2.6%. A higher reading could reinforce bearish pressure, while a softer print would support continued bullish momentum.
Technical Outlook:
SPX500 has bounced from the demand zone and is now trading above the pivot at 6282, which keeps the bullish trend in play.
As long as the price holds above this level, we expect continuation toward 6341, and if broken, extended upside toward 6394.
To shift bearish, price must break and close below 6223, which would open the path toward 6142.
Pivot: 6282
Resistance: 6341 – 6394
Support: 6225 – 6191 – 6142
Event Watch : CPI data release today – anything above 2.6% may trigger downside; below 2.6% could support further upside.
Previous idea:
SPX 6300 Highs to 6200 Lows - Watch Key LevelsThis week earnings season kicks off
-Notables include JPM, GS, BAC, WFC, NFLX, KMI, PEP and others
US Inflation (CPI and PPI) this week
-forecasts are showing HIGHER inflation
-consumers care, but markets may not
6300-6350 key resistance area for SPX
6200 key support area for SPX
If we break the 6200 floor, there's room to fall to 6000-5700 to find stronger support
I discuss the 50 day moving averarages on the S&P and Nasdaq as levels to watch
For the remainder of the month...
7/18 July Monthly Expiration
7/30 US FOMC (with Press Conference)
8/1 US Non-Farm
8/1 US Tariff Deadline (per Trump)
Markets will have to really love a slew of good earnings and good news to see more highs and melt-ups through this typically bumpy season (Aug-Sep)
Thanks for watching!!!

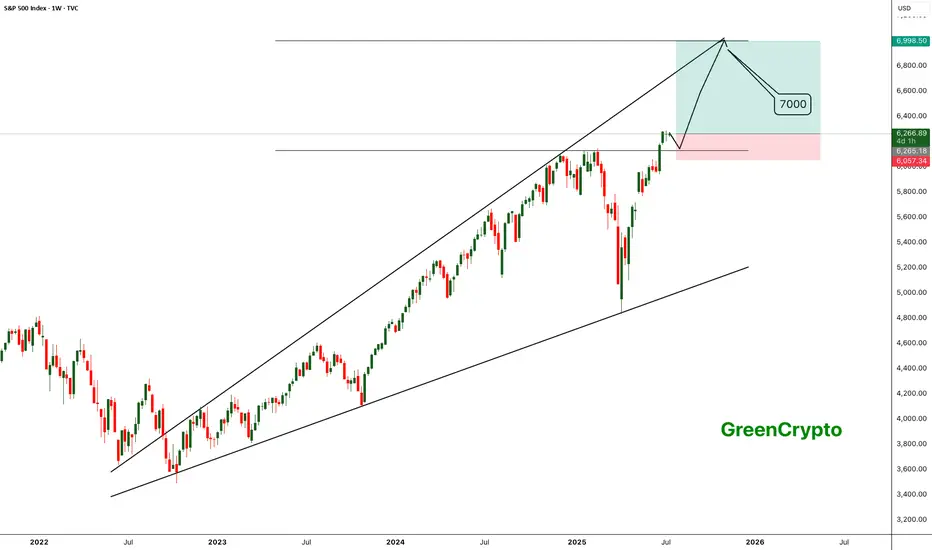
SPX - Next Target is 7000- SPX is currently trading around 6200 after breakout previous all time high.
- Price has formed a nice broadening wedge pattern and currently heading towards the next resistance line.
- We can expect a slight correction upt o 6100, and reversal towards 7000.
- I'm expecting SPX to hit 7000 target by Q1 of 2026.
Trade Opportunity
Entry: 6200
TP1: 6400
TP2: 6600
TP3: 6800
TP4: 7000
SL at: 6057
Stay tuned frequent updates
Cheers
GreenCrypto
Weekly $SPY / $SPX Scenarios for July 14–18, 2025🔮 Weekly AMEX:SPY / SP:SPX Scenarios for July 14–18, 2025 🔮
🌍 Market-Moving News 🌍
⚖️ Powell Faces ‘Epic’ Trade‑Inflation Dilemma
Former Fed economists warn Chair Powell is navigating nearly unprecedented terrain: tariffs are pushing up prices even as the labor market cools. Striking a balance between inflation control and growth support remains a formidable challenge
📊 Tariff‑Driven Inflation May Peak This Week
June’s CPI is expected to show a 0.3% month-on-month increase, potentially lifting core inflation to ~2.7%—its highest level in 18 months. These data will heavily influence the Fed’s decision-making process
🏦 Big Bank Earnings Kick Off
Earnings season begins with JPMorgan ( NYSE:JPM ), Goldman Sachs ( NYSE:GS ), Wells Fargo ( NYSE:WFC ), and Citigroup ($C) reporting. Strong results could offset trade and inflation anxieties; expect volatility in financials
📈 Goldman Sees Broader S&P Rally
Goldman Sachs projects the S&P 500 to climb roughly 11% to 6,900 by mid‑2026, underpinned by firm earnings and expected Fed rate cuts. But warns that breadth remains narrow, increasing downside risk without robust participation
⚠️ Summer Volatility Risk Lingers
Deutsche Bank warns that summer’s low liquidity and the looming Aug 1 tariff re‑imposition deadline may spark sudden market turbulence—even amid bullish sentiment
📊 Key Data Releases & Events 📊
📅 Monday, July 14
Quiet start—markets digest back-to-back CPI, tariffs, and clearing post‑earnings.
📅 Tuesday, July 15
8:30 AM ET – Consumer Price Index (June)
Watch for potential tariff impact in CPI; core inflation data are crucial.
8:30 AM ET – Core CPI (June)
10:00 AM ET – Empire State Manufacturing Survey (July)
Early view on Northeast factory trends.
📅 Wednesday, July 16
8:30 AM ET – Producer Price Index (June)
Wholesale inflation signals to validate CPI trends.
10:00 AM ET – Housing Starts & Building Permits (June)
📅 Thursday, July 17
8:30 AM ET – Initial & Continuing Jobless Claims
A gauge on labor-market resilience amid talks of cooling.
📅 Friday, July 18
10:00 AM ET – Federal Reserve Beige Book Release
Fed’s regional economic snapshot ahead of next FOMC.
⚠️ Disclaimer:
This is for educational/informational use only—not financial advice. Consult a licensed professional before investing.
📌 #trading #stockmarket #economy #tariffs #inflation #earnings #Fed #CPI #technicalanalysis
SPX: earnings sentiment aheadPrevious week was another optimistic week on financial markets. Regarding the approaching deadline for a delay in the application of trade tariffs set by the US Administration, which came due on July 9th, the market did not show much of a concern. The green trend line of the S&P 500 continued during the week, where the index managed to reach another new all time highest level on Thursday, at 6.290. During the previous week there has not been any currently important US macro data posted, in which sense, the market sentiment remained optimistic. However, Friday's news regarding trade tariffs spoiled a bit of an up-trend, so the index ended the week, just a bit lower from its ATH level, at 6.259.
Weekly tariffs news include a 35% imposed tariffs on imports from Canada, and 50% on goods imported from Brazil in the U.S. There are also some comments on a potential increased universal 10% tariff on the majority of other nations, noting 15% and 20%, as well as a 50% tariff on copper. Analysts are noting that the market is already adjusted to the comments regarding trade tariffs, in which sense, there are no more strong market reactions on any incoming news.
The week ahead brings some important US macro data, as well as gearing up for the earnings season, starting with major banks like JPMorgan. The June inflation data as well as PPI will be posted in the week ahead, closing with University of Michigan Consumer Sentiment. This data might bring back some volatility to the S&P 500, however, the general investors sentiment remains positive at this moment.
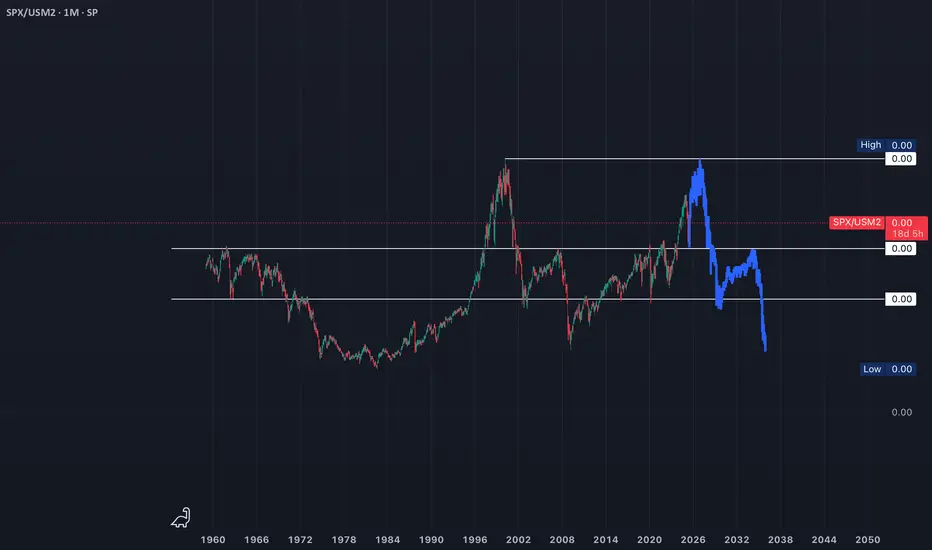
Is SP500 / US M2 Money Supply telling us a story?Historically this ratio has inflected from key levels. Last week the upper boundary of what 8 would call a normal range has acted as support. If history rhymes to dot com bubble, this AI bubble can bounce from these levels and see an increase until Q4 2026, then a sharp fall will follow. To the lower boundary of that normal range.
DIYWallSt Trade Journal: Missed Entry & Climbing Back From Loss **07/11/25 Trade Journal, and ES_F Stock Market analysis **
EOD accountability report: -46.25
Sleep: 5 hours
Overall health: Good
** VX Algo System Signals from (9:30am to 2pm) 3/3 success**
— 9:41 AM Market Structure flipped bearish on VX Algo X3!
— 10:15 AM VXAlgo ES X7 Buy signal,
— 10:23 AM Structure flipped bullish
— 11:30 AM VXAlgo ES X3DD Sell Signal
**What’s are some news or takeaway from today? and What major news or event impacted the market today? **
I was a little busy this morning and missed the chance to short the market at MOB with Bearish market structure at 9:30, so I had to wait for the next chance but when i shorted the MOB on the move up, the X7 buy signal came out and pushed market structure bullish.
Ultimately If i had a better entry on my short, I would have been okay, but since i shorted early, i got stopped at at 6306 and it ended up dropping right after that. So the day actually started pretty bad and i was -300 from there and was just trying to climb back and forth the next few hours.
News
*LATEST TARIFF THREATS COULD DELAY RATE CUTS, CHICAGO FED’S GOOLSBEE SAYS - WSJ
**What are the critical support levels to watch?**
--> Above 6290= Bullish, Under 6280= Bearish
Video Recaps -->https://tradingview.sweetlogin.com/u/WallSt007/#published-charts

Nightly $SPY / $SPX Scenarios for July 11, 2025🔮 Nightly AMEX:SPY / SP:SPX Scenarios for July 11, 2025 🔮
🌍 Market-Moving News 🌍
🏦 Strong Bank Earnings Amid Tariff Churn
Next week’s Q2 forecasts point to robust earnings from U.S. banks—JPMorgan, Citi, Bank of America, Goldman Sachs, Morgan Stanley, and Wells Fargo—as trading and investment-banking revenue recover, offsetting uncertainties from ongoing tariffs
💬 Dimon Flags Fed Risk Pricing
JPMorgan’s Jamie Dimon cautioned that markets may be underestimating upside in interest rates. He sees a 40–50% probability of higher U.S. rates, driven by inflation from tariffs, migration, and fiscal deficits
⚖️ Tariff “Scattergun” Sparks Sector Disconnect
Trump’s plans to levy up to 200% tariffs on pharma and 50% on copper triggered uneven market reactions—copper prices rose 30% in six months, while European drugmakers remain flat, highlighting divergent sector sensitivities
📉 Tech & Macro Still Bullish
Despite policy turbulence, Nvidia climbed back above a $4 trillion valuation, and JPMorgan projects a $500 billion inflow into equities in H2—supporting gains even as broader macro pressures linger
📊 Key Data & Events
📅 Friday, July 11:
(No major U.S. economic data scheduled)
Markets will focus on bank earnings previews, tariff headlines, and the hold of the tech rally into a thin summer trading week.
⚠️ Disclaimer:
This information is for educational and informational purposes only and should not be construed as financial advice. Always consult a licensed financial advisor before making investment decisions.
📌 #trading #stockmarket #economy #tariffs #banks #tech #Fed #investing