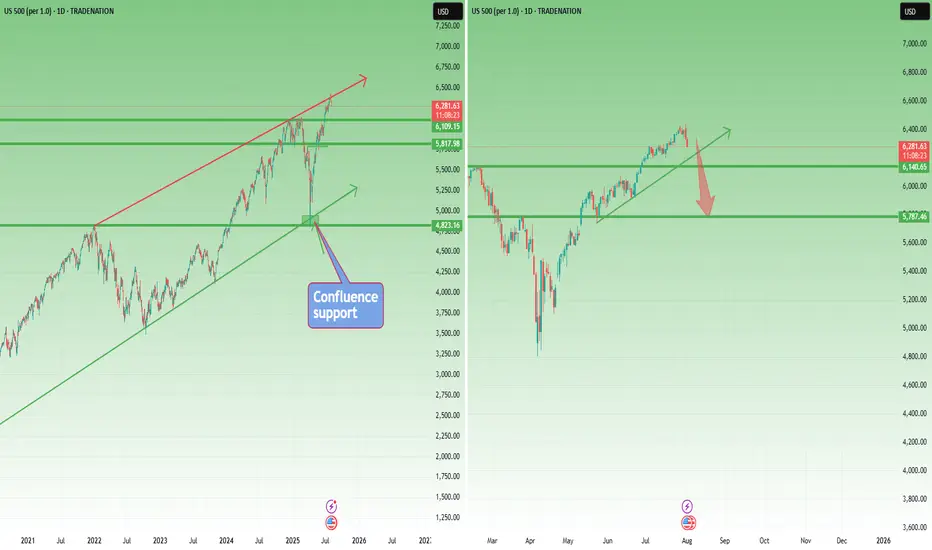
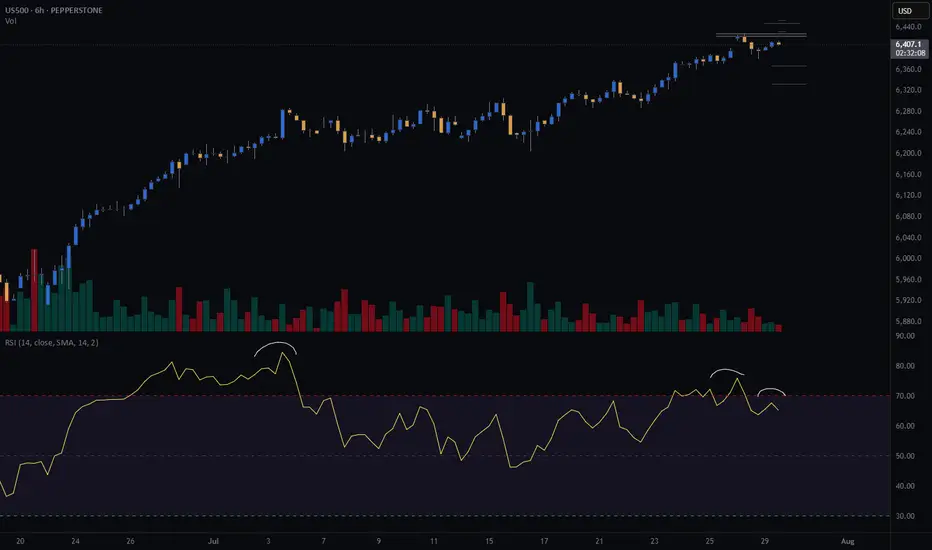
Correction Ahead? SP500 Prints Reversal Signal at Key Resistance📘 This market moves like a textbook chart
SP500 is acting like a perfect case study from a trading manual. Back in early April, the index dipped just below 5,000, right into a confluence support zone ( I had spoken about this at the time ) – formed by the long-term ascending trendline and the 2022 all-time high. Just like other U.S. indices, the market reversed aggressively from that area.
🚀 A 30% rally in 4 months
From that low, SP500 rallied around 30% in just four months. An incredible move that brought the index straight to the upper boundary of the yearly rising channel.
🕯️ Bearish signal at the top
And just like in NAS100’s case , the index printed a strong Bearish Engulfing candle exactly at that resistance level. This kind of signal, after such a rise, shouldn’t be ignored.
📉 A correction is not only probable – it’s needed
A pullback from here is not just likely, but in my opinion, healthy and necessary . Short-term speculators could look for a move toward the 6,150 zone, which would already offer decent room for profit.
🔍 What if it goes deeper?
I wouldn’t be surprised to see a correction down to 5,750–5,800. That’s about a 10% decline, which wouldn't even classify as a bear market, just a normal reset after a euphoric rally.
🧠 Perspective matters
In a market that gained 30% in four months, a 10% correction is not a crash — it’s discipline being restored.
Disclosure: I am part of TradeNation's Influencer program and receive a monthly fee for using their TradingView charts in my analyses and educational articles.
S&P 500 (SPX500)
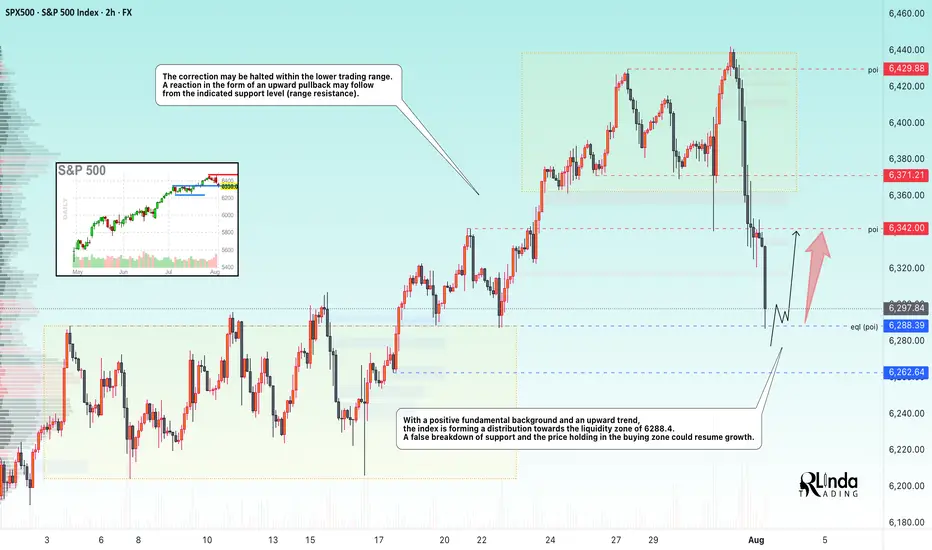
SP500 → Countertrend correction before growthFX:SPX500 is correcting against an upward trend. In the second half of the week, the market received fairly positive fundamentals during the reporting period.
S&P 500 futures found support after strong reports from Meta and Microsoft, which exceeded earnings expectations and forecasts thanks to AI. The rise in futures supported demand for the “Magnificent Seven” despite Powell's hawkish comments. The focus is on Apple and Amazon reports in the evening, which could strengthen the tech rally. On Friday, we are seeing a countertrend correction in which the market is testing the 6288 zone of interest.
Support levels: 6288.4, 6262.6
Resistance levels: 6342, 6371
Most likely, the market will form a false breakout of support during the correction. If the bulls keep the index above the key level, we can expect continued growth in the short and medium term.
Best regards, R. Linda!
Simple Psychology Tips Using Volume for Better TradingMany newer traders assume that when someone says "psychology" in trading, they are referring to mindset.
It is also widely believed that trading is about the BEST entries.
Now, think of it this way. It is not about winning trades, it is actually about managing losses well to allow you to take the winners over and over again. You might think that a 3 to 1 risk-to-reward strategy is boring, you might have gone all in on your favourite crypto project. But what makes the difference between gambling and trading is actually very, very simple. So simple, in fact, many overlook it or simply ignore it.
Most seek a silver bullet - high win rates and perfectly timed entries, then they overleverage and move stops on the one "good trade" they are seeking to make.
Whilst doing this, they tend to overload the 6 monitors they have purchased to trade with a thousand indicators, which they don't really need.
The candlesticks tell a story, volume supports that story. When you learn any technique from Elliott Waves to Wyckoff, they all have a dependence on volume - even if the correlation is not apparent.
Look at this first image.
Price had moved down since the vertical line, the AD line also moved down - sell-off, in full swing. But then volume starts to shift before the AD line starts to increase.
Now, look at what happens next...
As we move forward and the new vertical line shows where volume spiked, the AD line starts to decrease as the price continues to rise.
This is enough of a story to start your analysis.
We then get a move with a lower high formed.
As this plays out, the sell-side volume rises, creating momentum for the short position.
Look a little closer and you will see, that the volume on the move up just before the drop was also decreasing. Making a divergence to price.
You might feel that the market is against you, or that the big players are single-handedly seeking your stops. But the truth is, the psychology in moves such as this one shown is where most retail traders either have greed that markets will only go up for ever or the fear that they are missing out on a market that only goes up forever.
It is that herd mentality that generates the liquidity for the professionals.
Losing 1% on a trade, is part of the process, risking 80%> on a single move will make you paper rich for about 10 minutes before the real losses set in.
This is where the psychology and the basic techniques such as risk management and understanding what candlesticks and volume bars are telling you, will make a world of difference to your results.
A/D line and volume are free on @TradingView and to be fair you don't need to overcomplicate it more than that!
Stay safe, have a great weekend all!!!
Disclaimer
This idea does not constitute as financial advice. It is for educational purposes only, our principal trader has over 25 years' experience in stocks, ETF's, and Forex. Hence each trade setup might have different hold times, entry or exit conditions, and will vary from the post/idea shared here. You can use the information from this post to make your own trading plan for the instrument discussed. Trading carries a risk; a high percentage of retail traders lose money. Please keep this in mind when entering any trade. Stay safe.
SPX500 Dips Ahead of NFP as Tariff Risks RiseSPX: S&P 500 Dips to Close July — Still Positive for the Month Amid Tariff Tensions & Fed Uncertainty
The S&P 500 retreated in the final session of July, weighed down by renewed tariff concerns and lingering uncertainty around the Fed’s next move. Despite the late pullback, the index remains positive for the month overall.
Looking ahead, non-farm payrolls (NFP) and U.S. jobs data are expected to have a strong impact on market direction. In addition, August 1st marks a key date for potential tariff developments, which could trigger further volatility.
Technical Outlook – SPX500
The index has dropped approximately 2.5% since yesterday and maintains a bearish bias as long as it trades below 6283. If the price continues to slide, the next downside target is 6246, with further support at 6223.
However, if the price manages to close above 6289 on the 1H timeframe, it could trigger a bullish recovery toward 6320 and 6341.
Pivot Line: 6283
Support Levels: 6246 • 6223
Resistance Levels: 6320 • 6341
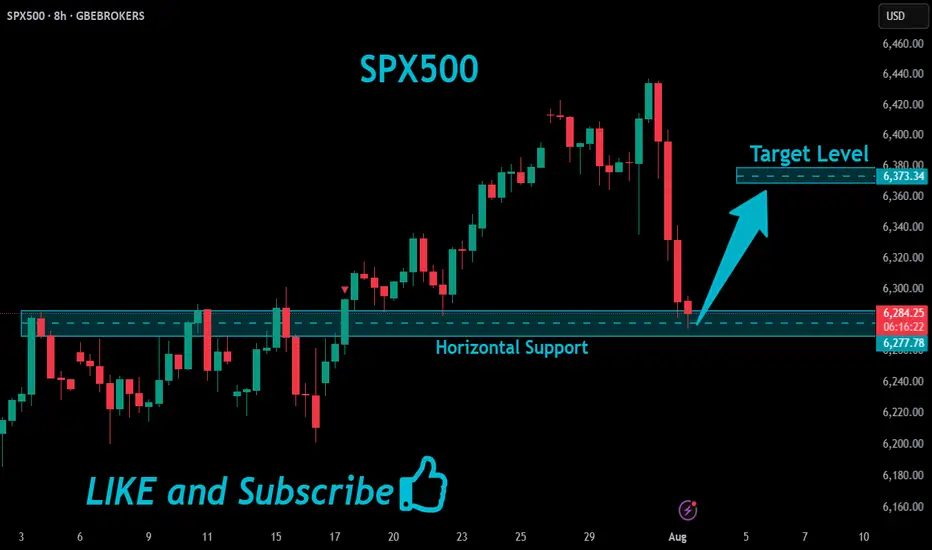
SPX500 Will Go UP!
HI,Traders !
#SPX500 made a retest
Of the horizontal support
Level of 6277.78 and we
Are already seeing a
Bullish rebound so we are
Locally bullish biased and
We will be expecting a
Further bullish move up !
Comment and subscribe to help us grow !
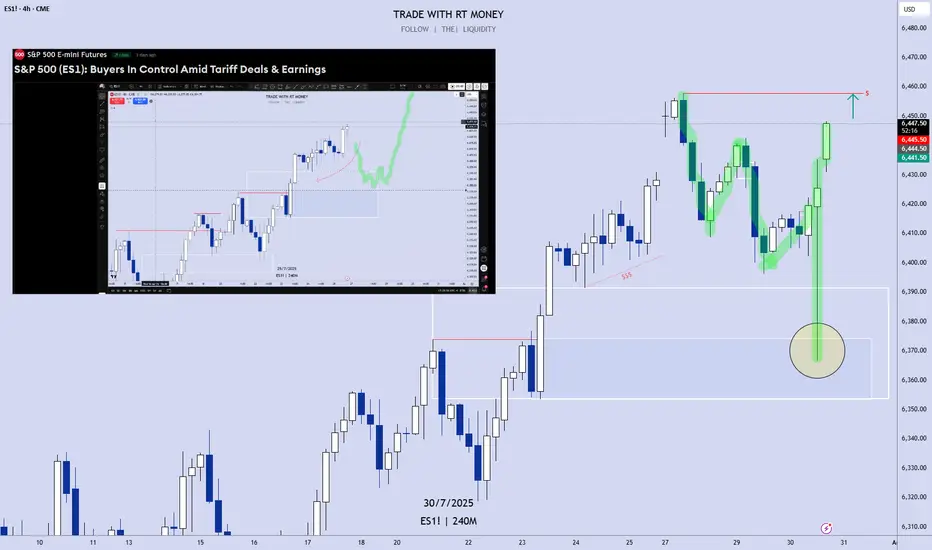
S&P 500 (ES1): Post FOMC, Buyers Pushing Back To The Highs!In this video, we will analyze the following FX market for July 31 - Aug 1st.
S&P 500 (ES1!)
In the Weekly Forecast for the S&P 500, we highlighted:
- price is bullish, and expected to go higher. It did move to ATH before pulling back.
- the sell side liquidity under the ascending lows would draw price.... which it did.
- the Area of Fair Value below the lows, with the Demand Zone as the potential level where a
a high probability long could setup.... which was spot on!
Did you benefit from the forecast? Let me hear from you if you did, in the comment section.
Enjoy!
May profits be upon you.
Leave any questions or comments in the comment section.
I appreciate any feedback from my viewers!
Like and/or subscribe if you want more accurate analysis.
Thank you so much!
Disclaimer:
I do not provide personal investment advice and I am not a qualified licensed investment advisor.
All information found here, including any ideas, opinions, views, predictions, forecasts, commentaries, suggestions, expressed or implied herein, are for informational, entertainment or educational purposes only and should not be construed as personal investment advice. While the information provided is believed to be accurate, it may include errors or inaccuracies.
I will not and cannot be held liable for any actions you take as a result of anything you read here.
Conduct your own due diligence, or consult a licensed financial advisor or broker before making any and all investment decisions. Any investments, trades, speculations, or decisions made on the basis of any information found on this channel, expressed or implied herein, are committed at your own risk, financial or otherwise.
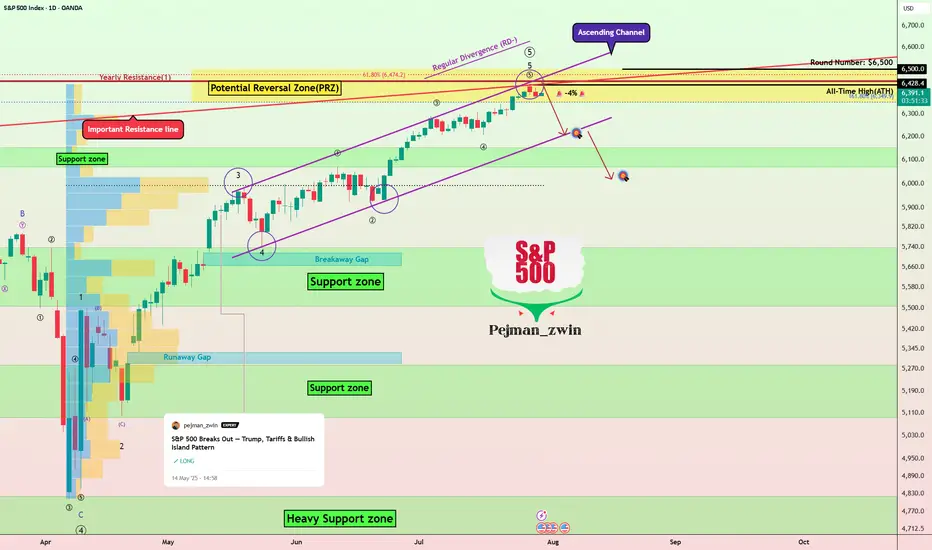
S&P500’s Bullish Island Turns Risky: Elliott Wave Says “Top”The S&P500 Index( SP:SPX ) started to rise and even created a new All-Time High(ATH=$6,428) with the help of the Bullish Long Island Pattern , as I published in my previous idea on May 14, 2025 .
The S&P500 Index is currently moving near the Potential Reversal Zone(PRZ) , upper line of the ascending channel , the Important Resistance line , and the Yearly Resistance(1) .
In terms of Elliott Wave theory , the S&P500 Index appears to be completing microwave 5 of microwave 5 of the main wave 5 .
Also, we can see the Regular Divergence(RD-) between Consecutive Peaks .
I expect the S&P500 Index to correct at least -4% and fall to the lower line of the ascending channel .
First Target: $6,233
Second Target: $6,033
Note: Stop Loss(SL) $6,513
Do you think S&P500 Index can create a new ATH above $6,500 !?
Please respect each other's ideas and express them politely if you agree or disagree.
S&P 500 Index Analyze (SPX500USD), Daily time frame.
Be sure to follow the updated ideas.
Do not forget to put a Stop loss for your positions (For every position you want to open).
Please follow your strategy and updates; this is just my Idea, and I will gladly see your ideas in this post.
Please do not forget the ✅' like '✅ button 🙏😊 & Share it with your friends; thanks, and Trade safe.
S&P Correction Window is official - VOLATILITY AHEADIt's that time of year where the pre-summer push wraps and the summer lull and potential
pause gets underway.
July 31 finished on a bit of a sour note with over 67% of stocks declining today and US indexes finishing RED despite the big gaps and bullish pops on MSFT and META post earnings.f
SPX Key Levels
-watch the 21 day moving average
-watch the 50 day moving average
-more dynamic support in the 100/144/200 moving average cluster
I'll be taking bites at the 5/10/15% correction levels with options and looking for this dip
to be bought by retail and institutions.
Will August 1 US Tariff Deadline matter? After Japan and Eurozone came in and said a deal is being done, I was thinking this would be a dud. BUT, Dr. Copper says "maybe" on the global
tariff deadline with the largest single day move in history (bearish). Being the perfect time of year for a correction (the other being Feb-Apr), and the technicals looking so clean for an
orderly pullback, VIX may float higher and make things more interesting in the next 30-60 days.
Strategies matter, I'll be trading risk defined, but there are great opportunities ahead. A pullback is sure better than literally watching all-time highs every single day.
Thanks for watching!!!

SPX500 Hits New Highs but Fed Caution Limits MomentumSPX500 Overview
Market Context:
The Fed's reluctance to commit to a rate cut in the upcoming September meeting has forced markets to reassess their outlook. This hesitation pushed Treasury yields and the US dollar higher in late trading, weighing on equities.
As it stands, the probability of a rate cut appears to be pushed further out on the timeline, introducing short-term headwinds for risk assets.
Technical Outlook:
SPX500 printed a new all-time high and maintains bullish momentum after stabilizing above the previous ATH at 6427. As long as the price holds above this level, the bullish continuation toward 6454 remains likely, with a further extension to 6480 possible.
A bearish correction would only be confirmed by a break below 6415.
Resistance Levels: 6454, 6480
Support Levels: 6415, 6389
S&P500 (CASH500) SHORT - Double top H6Risk/reward = 3.7
Entry price = 6432.6
Stop loss price = 6 454.1
Take profit level 1 (50%) = 6367.7
Take profit level 2 (50%) = 6332.6
Still need confirmation from some variables before entering the trade
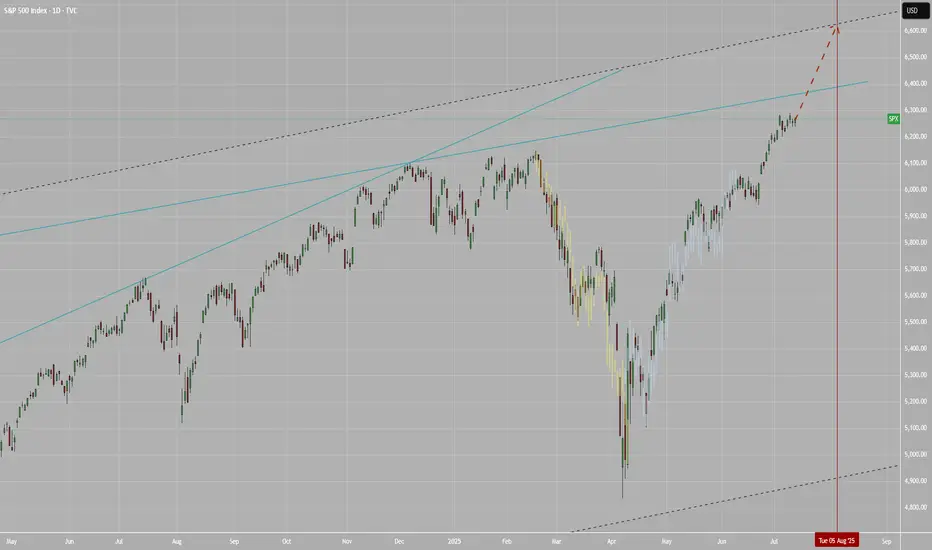
SPX to 6600+ by Aug 5This leg up in SPX is not over yet. Target at upper bound of the channel around 6.6K+ by Aug 5.
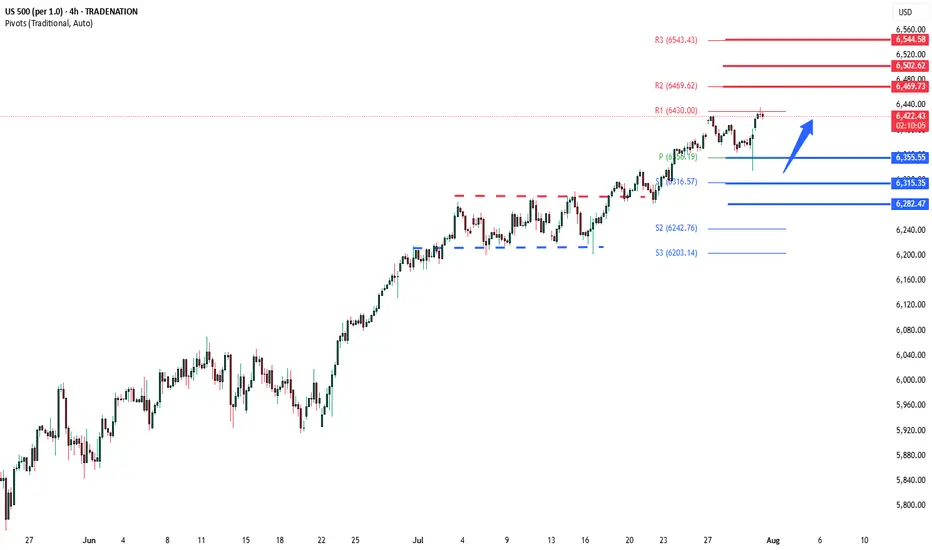
S&P500 uptrend pause supported at 6355The S&P 500 slipped -0.12% after initially rising +0.3%, as Fed Chair Powell’s cautious “wait-and-see” stance on rate cuts dampened sentiment. The metals and mining sector dragged the index lower, falling nearly -4% after the U.S. announced surprise copper tariff details—excluding refined metal until 2027—leading to a sharp -20% drop in COMEX copper futures.
However, market sentiment rebounded overnight, driven by strong tech earnings. Meta surged +11.5% post-market on upbeat Q3 guidance and rising AI-driven ad revenues, while Microsoft rose over +8% thanks to better-than-expected Azure cloud growth and a $30 billion AI infrastructure investment.
Conclusion:
Despite short-term pressure from the Fed’s tone and commodity weakness, strong AI-driven earnings from major tech firms are likely to support a positive bias for the S&P 500 in the near term, especially in the tech-heavy growth segments. Broader gains may depend on upcoming inflation data and Fed clarity.
Key Support and Resistance Levels
Resistance Level 1: 6470
Resistance Level 2: 6500
Resistance Level 3: 6545
Support Level 1: 6355
Support Level 2: 6315
Support Level 3: 6282
This communication is for informational purposes only and should not be viewed as any form of recommendation as to a particular course of action or as investment advice. It is not intended as an offer or solicitation for the purchase or sale of any financial instrument or as an official confirmation of any transaction. Opinions, estimates and assumptions expressed herein are made as of the date of this communication and are subject to change without notice. This communication has been prepared based upon information, including market prices, data and other information, believed to be reliable; however, Trade Nation does not warrant its completeness or accuracy. All market prices and market data contained in or attached to this communication are indicative and subject to change without notice.
FOMC rate decision 30-07-2025FOMC announced no change to interest rate, but the new tariffs is the major player for the upcoming quarter, we shall see its effect on the economy and corporates earnings soon, then the fed can make better judgment whether to lower interest rate or not.
Disclaimer: This content is NOT a financial advise, it is for educational purpose only.

SPX500 Bearish Bias!
HI,Traders !
#SPX500 broke both the
Rising and horizontal
Support line which are
Now resistance areas
And the breakout is
Confirmed so we are
Bearish biased and we
Will be expecting a
Further bearish move down !
Comment and subscribe to help us grow !
What will go down VIX or SPX?When SPX pushes fresh highs while the VIX floor makes higher lows, fragility rises.
This post is for informational/educational purposes only and is not investment advice or a solicitation to buy/sell any security. Past performance is not indicative of future results. I may hold positions related to the instruments mentioned.
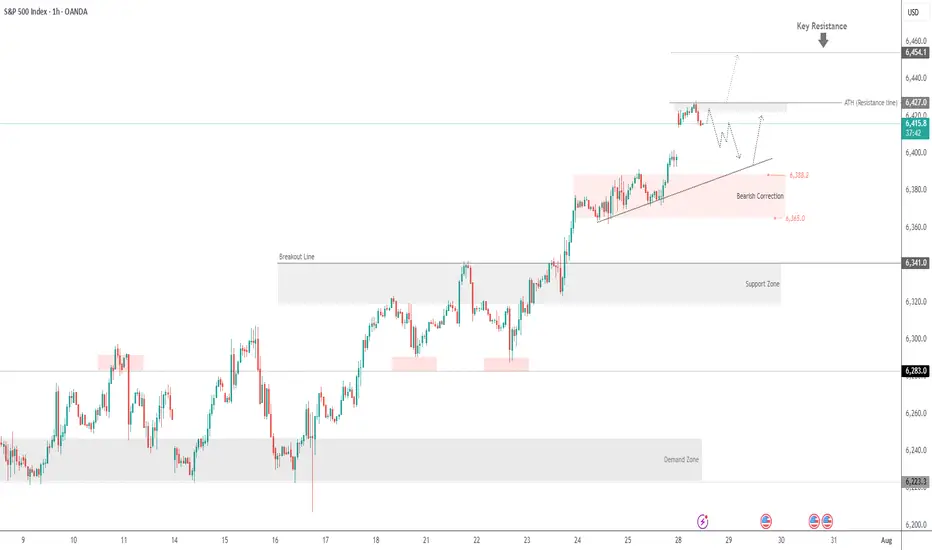
SPX500 Awaits Fed – Key Support at 6388 in FocusSPX500 Awaits Fed Decision – Breakdown Below 6365 Could Deepen Correction
Following the registration of a new all-time high at the beginning of the week, the price has started to decline. Also, investors await the Federal Reserve's policy statement later today for guidance on the future path of monetary policy.
The price is currently positioned below the 6388 level, which is a key zone in conjunction with the support line at 6365. This area signals the potential for a new downward correction if the price stabilizes below 6365.
A sustained move below 6365, confirmed by a 1H or 4H candle close, would open the door to a sharper decline toward 6341, followed by 6319, both considered critical support zones.
As for the bullish scenario: if the price finds support and manages to rebound today, the first step toward recovery would be a breakout above 6388, which may lead to a climb toward 6415. Breaking above 6415 would pave the way to retest the resistance zone at 6427, with the potential to reach a new all-time high at 6454.
Key Levels
• Support: 6365 - 6341 - 6319.
• Resistance: 6388 - 6415 - 6427.

ARKK: The Calm Before the Innovation Storm -ALTSEASON Is COMING🚀 ARKK: The Calm Before the Innovation Storm 🌪️
The markets are shifting, and disruption is about to go vertical. ARK Innovation ETF (ARKK) is quietly positioning itself for what could be the most explosive move of this decade. With high-conviction bets in AI, Bitcoin, genomics, and next-gen tech, this isn’t just a fund—it’s a launchpad for exponential growth.
This post breaks down exactly why ARKK could go parabolic—and why the smart money is already moving in. 👇
Explosive upside in 2026
ARKK is already up over 24% YTD , showing strong momentum compared to broader markets and signaling early stages of a potential parabolic move .
High-conviction concentration in game-changers
Top 10 holdings include Tesla, Roku, Zoom, Coinbase, UiPath, Block, Crispr Therapeutics, DraftKings, Shopify, and Exact Sciences. These are leaders in innovation sectors with massive upside potential .
Deep exposure to Bitcoin and digital assets
Heavy allocation to Coinbase and Block gives indirect exposure to Bitcoin . If BTC breaks into a new cycle high , ARKK stands to benefit significantly.
Positioned in exponential growth sectors
Focus on AI, genomics, EVs, fintech, robotics, and blockchain , all of which are entering accelerating adoption phases globally.
Aggressive smart-money accumulation
Cathie Wood’s team continues buying aggressively during dips, reinforcing institutional confidence in the fund’s long-term trajectory.
Technical breakout structures forming
Ascending triangle and multi-month consolidation breakouts suggest a technical setup primed for explosive upside .
Innovation supercycle aligning
ARKK's themes are aligned with major global shifts like de-dollarization, decentralized finance, and AI convergence .
High beta = massive upside leverage
With a beta above 2 , ARKK tends to outperform in bull runs , offering leveraged exposure to innovation without the need for margin.
Resurgence of top holdings
Names like Coinbase, Tesla, Shopify, and Roku are up 50%–100% YTD , driving ARKK’s NAV growth and fueling bullish sentiment .
Long-term vision with short-term catalysts
The fund projects 5x returns over the next five years , while Bitcoin halving cycles, tech innovation, and regulatory clarity serve as short-term ignition points .
Marty Boots | 17-Year Trader — smash that 👍👍, hit LIKE & SUBSCRIBE, and share your views in the comments below so we can make better trades & grow together!

S&P500 uptrend pause supported at 6355US equities were largely subdued, with the S&P 500 inching up +0.02%, marking its sixth straight record high, the longest streak since July 2023. Despite the headline gain, over 70% of S&P 500 stocks declined, revealing weak breadth and suggesting index gains are being driven by a narrow group of large-cap tech names.
Tech led the way, with the information technology sector +0.77% and the Mag-7 rising +0.79%.
Semiconductors outperformed, as the Philadelphia Semiconductor Index climbed +1.62%, driven by AMD’s +4.32% surge.
Momentum is building ahead of key Big Tech earnings: Microsoft and Meta report tomorrow; Apple and Amazon follow Thursday.
Meanwhile, traders are staying cautious ahead of a busy macro week:
FOMC decision (Wednesday),
Core PCE, Q2 GDP, ISM, and nonfarm payrolls still to come.
Geopolitical developments include a possible 90-day US-China trade truce extension and Taiwan cancelling overseas travel, which may help de-escalate tensions.
On the corporate front:
Apple's India strategy sees it surpass China as the top smartphone source for US buyers.
Harley-Davidson may sell its finance unit in a $5B deal with Pimco and KKR.
Vitol rewarded top staff with $10.6B in share buybacks—a record.
Conclusion for S&P 500 Trading
The S&P 500 continues to post record highs, but narrow leadership and weak breadth raise red flags. With tech doing the heavy lifting, near-term direction hinges on earnings from Microsoft, Meta, Apple, and Amazon. Broader market upside looks fragile ahead of critical Fed and economic data, suggesting that any disappointment could trigger a pullback. Stay cautious and watch for rotation or retracement if macro or earnings catalysts falter.
Key Support and Resistance Levels
Resistance Level 1: 6430
Resistance Level 2: 6470
Resistance Level 3: 6500
Support Level 1: 6355
Support Level 2: 6315
Support Level 3: 6280
This communication is for informational purposes only and should not be viewed as any form of recommendation as to a particular course of action or as investment advice. It is not intended as an offer or solicitation for the purchase or sale of any financial instrument or as an official confirmation of any transaction. Opinions, estimates and assumptions expressed herein are made as of the date of this communication and are subject to change without notice. This communication has been prepared based upon information, including market prices, data and other information, believed to be reliable; however, Trade Nation does not warrant its completeness or accuracy. All market prices and market data contained in or attached to this communication are indicative and subject to change without notice.

SPX500 Correction Before Rally? Key Levels in FocusSPX500 Correction Before Rally? Key Levels in FocusSPX500 OVERVIEW
Fundamental Context:
The U.S. and EU have averted a tariff standoff. The agreement reduces the baseline tariff on most European imports to 15%, down from the previously threatened 30% by the Trump administration. In return, the EU has committed to investing approximately $600 billion in the U.S.
Additionally, U.S.–China trade talks are ongoing in Stockholm, with reports suggesting a possible 90-day extension to the tariff deadline.
Technical Outlook:
SPX500 maintains a bullish bias due to easing trade tensions. However, as long as the price trades below 6421, a short-term correction toward 6397 and 6388 is likely. A rebound is expected if the price stabilizes above 6388.
🔺 Bullish Continuation will be confirmed if a 1H candle closes above 6427, potentially targeting 6454 and 6470.
Key Levels
• Support: 6397 – 6388 – 6365
• Resistance: 6454 – 6470
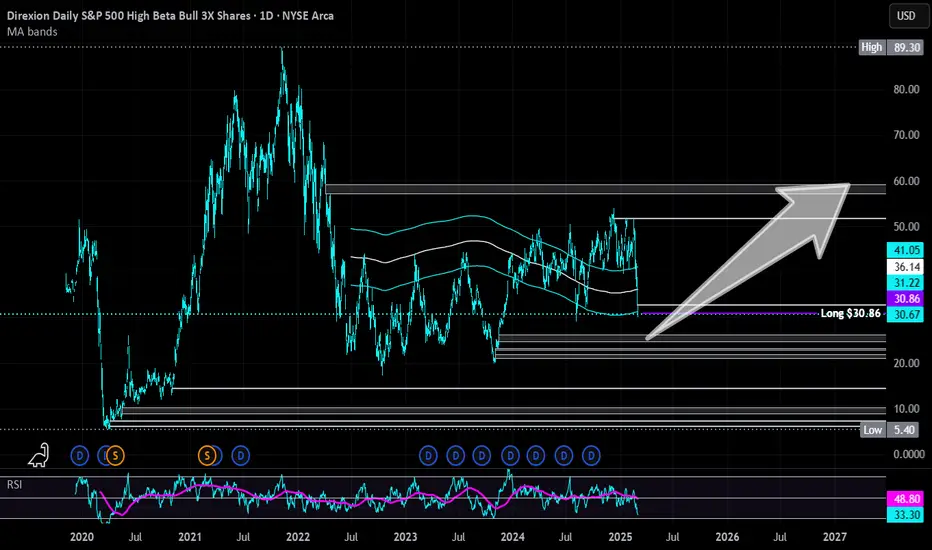
Direxion High Beta Bull S&P 500 3X | HIBL | Long at $30.86Contrarian view, despite tariffs. I don't think this rodeo is over - but I could always be wrong. Even if individual consumption drops (which I think it has for some time now), rising prices will continue to mask it. Many, but not all, companies will profit and until there is a "bigger" catalyst... bullish.
AMEX:HIBL is a personal buy at $30.86 (also noting the possibility of it going into the FWB:20S in the near-term)
Targets:
$40.00
$45.00
$50.00
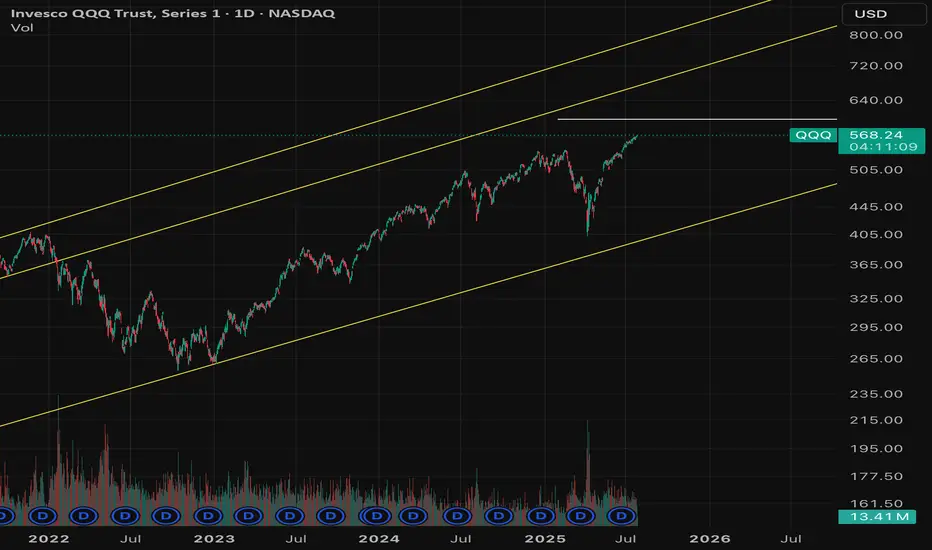
$QQQ August correction incoming?- August correction incoming? 🚨
- Greed is all time highs; People are complacent
- I believe a correction of 5-10% is healthy for the market to flush out excess and remove junk investments from the market.
- This involves people who are over-leveraged gets trapped.
- Personally, taking profits from risky bets, some profits from quality names and raising cash.
- Rotating money to defensive names.
- Not exiting the markets completely.
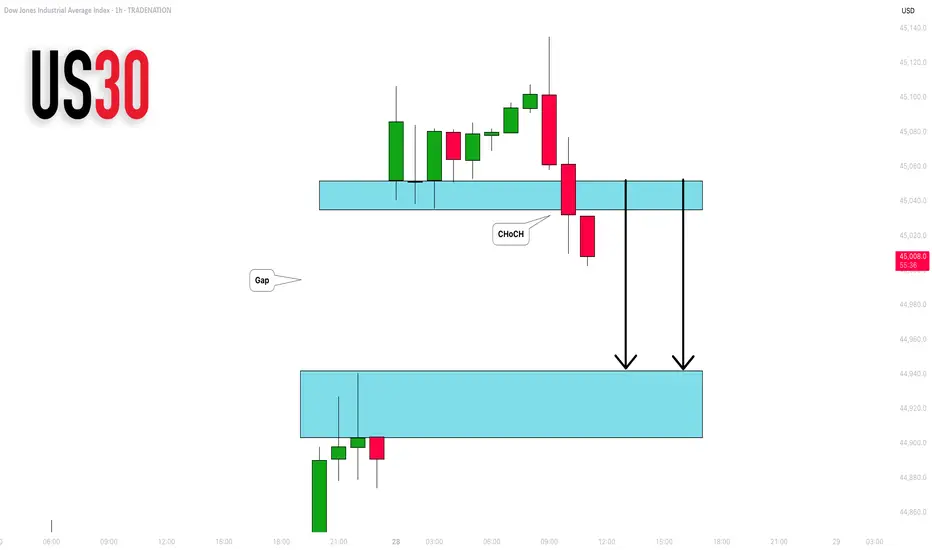
DOW JONES INDEX (US30): Another Gap For Today?
I see another gap up opening on US30 Index.
I think it will be filled today. A formation of an intraday
bearish CHoCH on an hourly time frame suggests
a highly probable bearish continuation.
Goal - 44943
❤️Please, support my work with like, thank you!❤️
I am part of Trade Nation's Influencer program and receive a monthly fee for using their TradingView charts in my analysis.
S&P 500 (ES1): Buyers In Control Amid Tariff Deals & EarningsWelcome back to the Weekly Forex Forecast for the week of July 28 - Aug 1st.
In this video, we will analyze the following FX market:
S&P 500 (ES1!)
The S&P 500 rose Friday to fresh highs, following a busy week of tariff updates and earnings. The S&P ended the week with its fifth straight record close, its longest such streak in over a year.
No reason to consider selling. Wait for pullbacks to FVGs for high probability buys.
FOMC and NFP loom. Be careful to avoid new entries during news times.
Enjoy!
May profits be upon you.
Leave any questions or comments in the comment section.
I appreciate any feedback from my viewers!
Like and/or subscribe if you want more accurate analysis.
Thank you so much!
Disclaimer:
I do not provide personal investment advice and I am not a qualified licensed investment advisor.
All information found here, including any ideas, opinions, views, predictions, forecasts, commentaries, suggestions, expressed or implied herein, are for informational, entertainment or educational purposes only and should not be construed as personal investment advice. While the information provided is believed to be accurate, it may include errors or inaccuracies.
I will not and cannot be held liable for any actions you take as a result of anything you read here.
Conduct your own due diligence, or consult a licensed financial advisor or broker before making any and all investment decisions. Any investments, trades, speculations, or decisions made on the basis of any information found on this channel, expressed or implied herein, are committed at your own risk, financial or otherwise.
