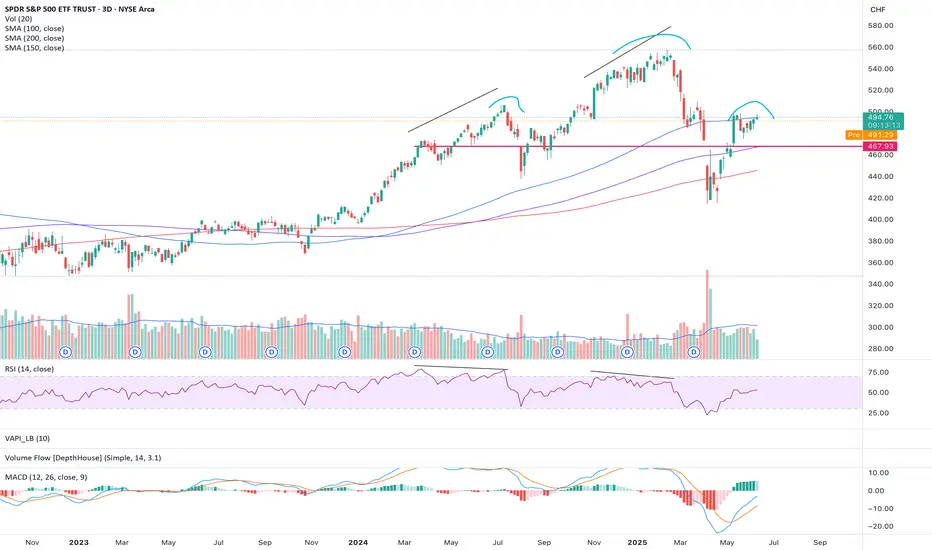
SP500 in CHF terms, bearish outlook- checking the SP500 in USD seems misleading these days
- therefore I checked it with CHF and earlier movements made more sense
- RSI bearish divergences were followed in earlier periods
- now we have a potential head and shoulders formation
- seems more likely to head south
S&P 500 (SPX500)
S&P 500 Maintains Uptrend — But for How Long?S&P 500 Maintains Uptrend — But for How Long?
As the chart of the S&P 500 (US SPX 500 mini on FXOpen) shows, price movements in June continue to form an upward trend (highlighted in blue).
The bullish momentum is being supported by:
→ News of a potential trade agreement between the United States and China;
→ The latest inflation report. Data released yesterday showed that the Consumer Price Index (CPI) slowed from 0.2% to 0.1% month-on-month.
President Donald Trump described the inflation figures as “excellent” and said that the Federal Reserve should cut interest rates by a full percentage point. In his view, this would stimulate the economy — and serve as another bullish driver.
However, as illustrated by the red arrow, the index pulled back yesterday from its highest level in three and a half months, falling towards the lower boundary of the channel. This decline was triggered by concerning developments in the Middle East. According to media reports, the US is preparing a partial evacuation of its embassy in Iraq, following statements by a senior Iranian official that Tehran may strike US bases in the region if nuclear talks with Washington fail.
Technical Analysis of the S&P 500 Chart
Currently, the price remains near the lower boundary of the ascending channel, reinforced by the psychologically significant 6,000-point level.
However, note that line Q — which divides the lower half of the channel into two quarters — has flipped from support to resistance (as indicated by black arrows). This suggests increasing bearish pressure, and there is a possibility that sellers may soon attempt to push the price below the channel support.
Be prepared for potential spikes in volatility on the E-Mini S&P 500 (US SPX 500 mini on FXOpen) chart as markets await the release of the Producer Price Index (PPI) at 15:30 GMT+3 today.
This article represents the opinion of the Companies operating under the FXOpen brand only. It is not to be construed as an offer, solicitation, or recommendation with respect to products and services provided by the Companies operating under the FXOpen brand, nor is it to be considered financial advice.
SPX'S BULLS !6200 Will get touched easily soon !
because the much vol up there waiting to be hunted at 6100+
𓄀𝓈𝓉𝒶𝓎 𝓉𝓊𝓃ℯ𝒹 𓃓
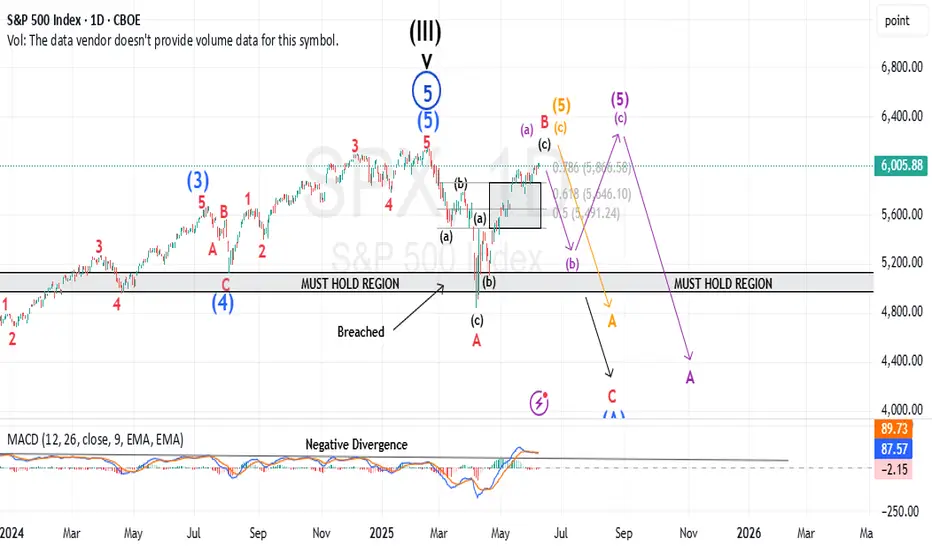
S&P500: Within reachThe S&P 500 has edged past the 88.70% retracement and is now trading within our magenta Target Zone (Coordinates: 5,880 points to 6,166 points). This places magenta wave (B) likely near its peak - a move that could soon give way to a sharper decline as part of the anticipated wave (C). At current levels, the setup remains favorable for initiating short positions. To manage risks, a stop just 1% above the upper boundary of the Target Zone is recommended. If the index breaks above resistance at 6,6675 points, however, we would shift to an alternative interpretation: a bullish continuation in the form of the wave alt.(III) in blaue. We currently assign a 40% probability to this scenario. One final note: the minimum technical requirement for wave (B) has already been fulfilled by the entry into the Target Zone. This means wave (C) could begin any time.
Over 190 precises analyses, clear entry points and defined Target Zones - that's what we do.

SPY/QQQ Plan Your Trade For 6-11: Bottom-Base Rally Counter TrndToday's counter-trend Bottom-Base Rally pattern suggests the markets may attempt to find a peak and roll over into a downtrend.
The normal Bottom-Base Rally pattern is similar to the start of a moderate price base/bottom, then moving into a moderate rally phase.
In counter-trend mode this pattern would be inverted - forming a Top and then moving into a downward price trend.
I've been warning of the potential of a rollover top type of pattern in the SPY over the past few weeks - but it never really setup/confirmed.
I'll be curious to see if this counter-trend pattern, today, sets up some type of big top formation in the SPY/QQQ. It might be related to news as well.
Gold and Silver have a Gap-Stall-Revert-FLUSH pattern. This is always an interesting pattern because is suggests price is going to attempt to either gap and trend or stall and revert. My guess is we are looking at more trending in metals today.
Platinum is RIPPING higher (PL1!). Because of this, I believe Silver and Gold will attempt to follow Platinum and move to the upside today.
BTCUSD is stalling a bit. We'll see if we get any big price move in Bitcoin today. After the big rally over the past few days, it will be interesting to see if BTCUSD reverts downward or continues higher.
Overall, today's patterns suggest the markets are seeking direction. Get ready for an exciting day in the markets.
Get some.
#trading #research #investing #tradingalgos #tradingsignals #cycles #fibonacci #elliotwave #modelingsystems #stocks #bitcoin #btcusd #cryptos #spy #gold #nq #investing #trading #spytrading #spymarket #tradingmarket #stockmarket #silver

Prepare For A Stock Market Crash
S&P 500 E-mini Futures, Daily Chart.
Potential Ending Diagonal.
Nothing serious. Just a Stop-hunt. But Fast & Furious...
......................................................................................................................
We are not registered or licensed in any jurisdiction whatsoever to provide investing advice or anything of an advisory or consultancy nature.
and are therefore are unqualified to give investment recommendations.
Always do your own research and consult with a licensed investment professional before investing.
This communication is never to be used as the basis of making investment decisions, and it is for entertainment purposes only.

SPY/QQQ Plan Your Trade For 6-10 : POP PatternToday's POP pattern suggests a potential big price move will take place. Given the overnight activity on the ES (rallying higher then rolling over), I suggest today's price move may attempt to retest these overnight highs, then repeat the breakdown phase into the close.
The markets continue to try to melt upward. This trend will continue until the markets decide to break downward.
After the deep low created by the tariff news, the markets continue to try to rally to new highs. It is very likely that Q2 earnings data may push the SPY to new ATH levels before we see any big rotation in price.
The markets have a tendency to move just above recent highs, then stall and revert downward as a pullback. This move may be no different.
The continued stalling of price trying to move higher recently suggests the markets are running into moderate resistance and I believe traders are actively pulling capital away from this rally.
The trend is still BULLISH. Stay cautious of this upward move as a breakdown could happen at any time.
Gold and Silver are moving into an impressive rally phase. Silver and Platinum have moved considerably higher over the past 10+ days. I believe Gold is lagging and will make a big move higher over the next 5 to 10+ days.
Silver is targeting $41-44+. Gold should target $3400 to $3500+ near the same time.
Bitcoin made a huge rally yesterday - reaching my 110,500 upper resistance level. Now, we see if Bitcoin has the momentum to carry higher or if it will fail and rollover into a downtrend.
It seems we are right as a MAKE or BREAK level in the markets. I'm still a believer of MELT UP until it fails.
I continue to watch for technical failure - but I've not seen it happen yet.
Get some.
#trading #research #investing #tradingalgos #tradingsignals #cycles #fibonacci #elliotwave #modelingsystems #stocks #bitcoin #btcusd #cryptos #spy #gold #nq #investing #trading #spytrading #spymarket #tradingmarket #stockmarket #silver

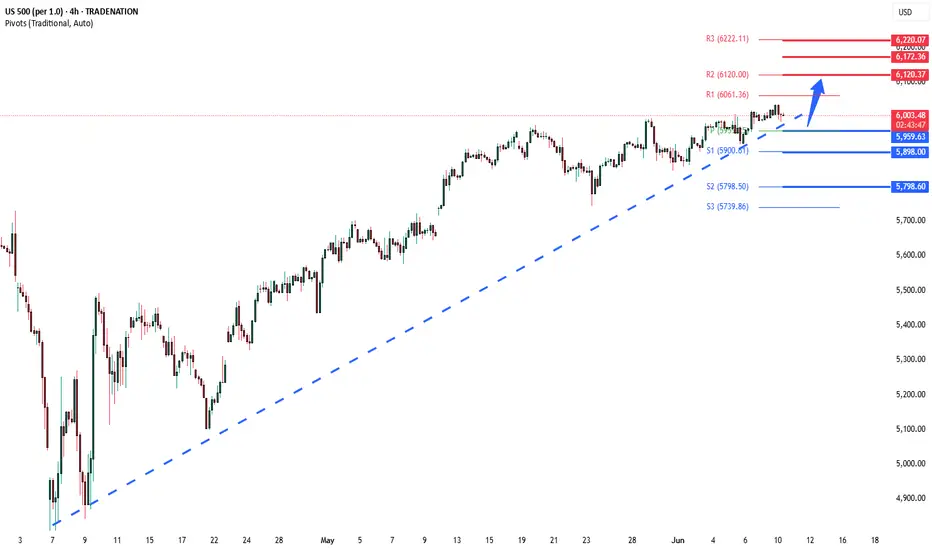
S&P500 INTRADAY uptrend continuation supported at 5960Key Support and Resistance Levels
Resistance Level 1: 6120
Resistance Level 2: 6170
Resistance Level 3: 6220
Support Level 1: 5960
Support Level 2: 5900
Support Level 3: 5800
This communication is for informational purposes only and should not be viewed as any form of recommendation as to a particular course of action or as investment advice. It is not intended as an offer or solicitation for the purchase or sale of any financial instrument or as an official confirmation of any transaction. Opinions, estimates and assumptions expressed herein are made as of the date of this communication and are subject to change without notice. This communication has been prepared based upon information, including market prices, data and other information, believed to be reliable; however, Trade Nation does not warrant its completeness or accuracy. All market prices and market data contained in or attached to this communication are indicative and subject to change without notice.
A Potentially Dangerous Pattern Takes ShapeWhile the futures market has yet to break into new all-time high territory, the previously discussed bearish micro setup has now been invalidated. In its place, we’re witnessing a complex, overlapping advance—creeping steadily toward the prior highs in the S&P 500 (ES).
At the micro level, I currently see no compelling bearish setup. However, this grinding upward move—lacking strong conviction from either buyers or sellers—is not necessarily bullish. In fact, it’s a hallmark of a potentially dangerous pattern: a primary degree ending diagonal.
If my interpretation is correct, both the “orange” and “purple” wave counts point to the same ominous conclusion. They suggest that what we're seeing could culminate in a sharp, possibly violent reversal—one that would ultimately retrace back to where this entire primary wave began. For reference, that’s just above 4,000, marked by the conclusion of Primary Wave 4 in October 2022.
This is the moment for caution—not after the damage is done.
Yes, we may push into new all-time highs. But within this fragile and overlapping structure, that outcome is far from guaranteed. Even if we get there, the looming question remains:
At what cost?
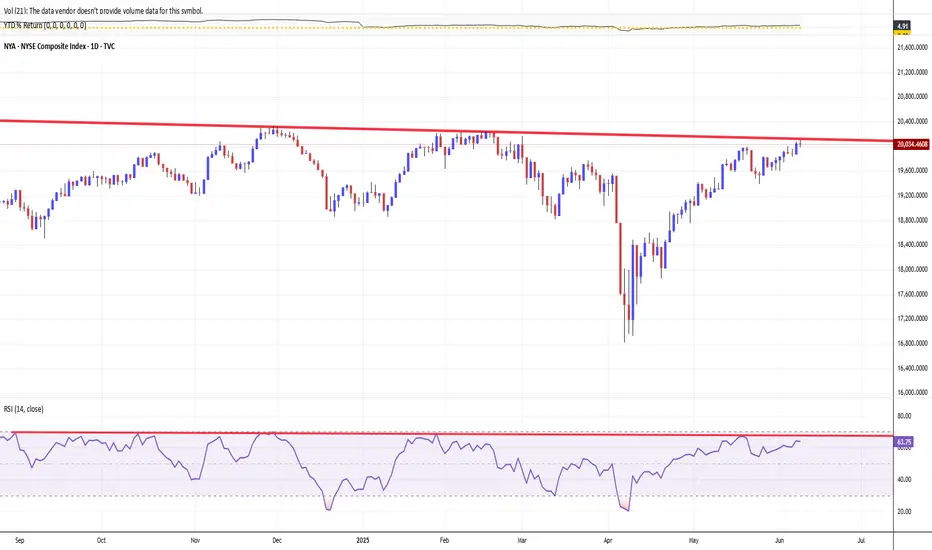
NYSE COMPOSITE INDEX. BACK TO 20 000 MARK — KEY RESISTANCE LINEThe NYSE Composite TVC:NYA is a stock market index, that covering all common stock listed on the New York Stock Exchange, including American depositary receipts, real estate investment trusts, tracking stocks, and foreign listings.
Over 2,000 stocks are covered in the index, of which over 1,600 are from United States corporations and over 360 are foreign listings.
However foreign companies are very prevalent among the largest companies in the index: of the 100 companies in the index having the largest market capitalization (and thus the largest impact on the index), more than half (55) are non-U.S. issues.
Thanks to many non-U.S. components, NYSE Composite index shows nearly 5 per cent return in 2025 so far, outperforms major U.S. stock indices like Dow Jones Industrial (+0.24%), S&P500 (+1.91%), as well as Nasdaq-100 (+3.21%).
Trade negotiations and tariff expectations have been central drivers of the NYSE Composite Index's recent recovery, shaping both market sentiment and underlying corporate fundamentals.
Trade Negotiations. Market Sensitivity and Relief Rallies
Financial markets, including the NYSE Composite, have reacted sharply to developments in trade negotiations. Historically, when trade talks break down or new tariffs are announced, U.S. stocks tend to sell off due to concerns over higher costs, supply chain disruptions, and reduced global demand. Conversely, when negotiations resume or tariffs are delayed, markets often rebound. For example, during the 2018–2019 U.S.–China trade war, U.S. stocks experienced heightened volatility, but rallied strongly after the announcement of the Phase I trade deal, as uncertainty eased and the threat of further escalation diminished. This pattern has repeated in 2025: the NYSE Composite has staged recoveries following signs of progress in trade talks or delays in tariff implementation, as investors anticipate less disruption to global commerce and corporate earnings.
Tariff Expectations. Impact on Earnings, Valuations, and Sentiment
Tariffs directly affect corporate earnings by raising input costs for companies that rely on imported goods. According to Goldman Sachs Research, every five-percentage-point increase in the U.S. tariff rate is estimated to reduce S&P 500 earnings per share by roughly 1-2%. If companies absorb these costs, profit margins are squeezed; if they pass them on to consumers, sales may decline. The NYSE Composite, which tracks a broad swath of U.S. and international companies, is similarly exposed.
Expectations around tariffs also influence equity valuations.
Elevated policy uncertainty—driven by unpredictable tariff announcements—raises the risk premium investors demand, often compressing price-to-earnings multiples and weighing on stock prices. When clarity emerges, such as the announcement of a tariff pause or the prospect of a negotiated settlement, uncertainty recedes, and valuations can recover, fueling index gains.
The Role of Policy Announcements and Market Psychology.
Trade policy announcements have acted as economic shocks, affecting global trade relationships and growth forecasts. For instance, after the U.S. announced new tariffs in early 2025, recession odds rose and GDP growth forecasts were slashed, prompting a broad market sell-off. However, the subsequent announcement of a 90-day tariff pause and renewed negotiations led to a stabilization and partial recovery in equities, as investors reassessed the likelihood of a severe downturn.
Market psychology amplifies these moves.
As trade rhetoric intensifies, investor sentiment can become excessively pessimistic, sometimes overshooting the actual economic impact of tariffs. This creates conditions for relief rallies when negotiations show progress or when the tariff outlook becomes less severe than feared.
Technical challenge
NYSE Composite index has experiencied record values on Friday, November 29, 2024, following so-called Trump-a-Rally.
The best Closing high was 20,272.04 ponts at those day and the best Intraday high was 20,332.50 points, also at the same day.
However unability to finish the year 2024 firmly above 20 000 round number, sharply pushed stock market bulls into fart and double-digit decline earlier in 2025.
The main chart indicates on major resistance again, near 20 000 point while technical indicator RSI (14) still goes sluggish.
Conclusion
The NYSE Composite Index's recovery has been closely tied to the ebb and flow of trade negotiations and tariff expectations. Positive developments in negotiations and reduced tariff threats have alleviated uncertainty, supported earnings expectations, and improved investor sentiment, all of which have contributed to the index's rebound.
--
Best wishes,
@PandorraResearch Team 😎
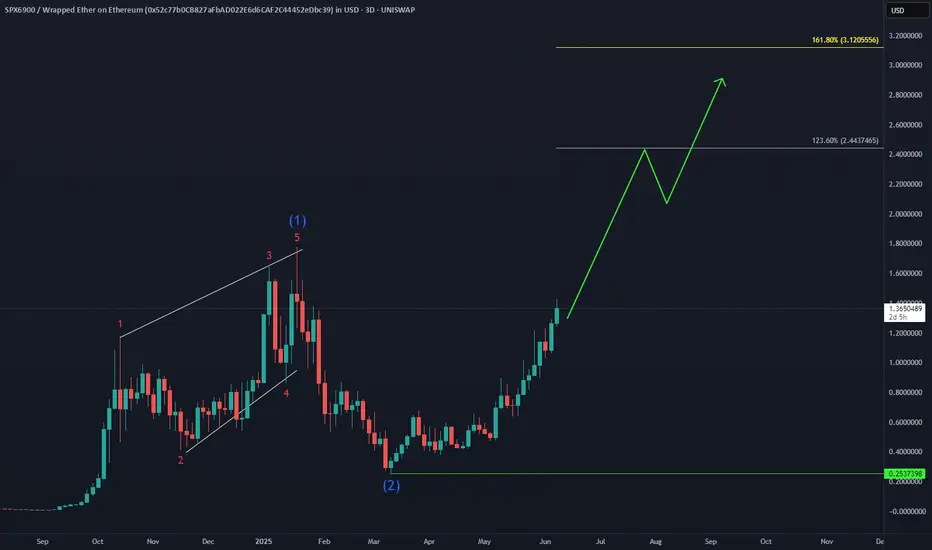
SPX6900 - Time to Get Aggressive and Flip SPX🔥 CRYPTO:SPX6USD With a new ATH on the horizon, wave (3) is eyeing $2.4 - $3.1 as the next target. But this is just the start, momentum is building and summer volatility could push prices even higher!
SPX 500 to 17,000 in 7 years.This chart represents the S&P 500, showcasing its performance over time, including quarterly data.
It captures everything.
Every recession.
Every war.
Every president.
Every variation of the monetary base as superpowers rise and fall.
Whenever I hear a bear in the stock market declare that THE TOP has been reached, and we are about to CRASH -50% to -90%
I find myself drawn to these comprehensive long term charts.
If the bulls are genuinely in control and we have merely undergone an intermediate-term correction, then the long-term bull market that commenced at the 2009 low remains robust, with many more years ahead.
The chart also illustrates that the three significant bull market phases typically last around 18-20 years following a major breakout.
And they yield a comparable number of X's.
It's all quite fascinating, if you ask me.
See you in the future!

SPY/QQQ Plan Your Trade For 6-9: Inside BreakawayToday's pattern suggests the SPY/QQQ will attempt to make a breakaway type of price move - away from Friday's open-close range.
Given the fairly tight opening price level this morning, I would stay cautious in early trading today and try to let the first 60 minutes play out - looking for that breakaway trend/momentum.
Overall, the markets are still in a Bullish price phase - trying to push higher.
But, as I continue to warn, I believe the markets could rollover and break downward at any time.
BTCUSD moved substantially higher overnight. This could be the beginning of a bigger advance higher. But, it could also be an exhaustion move higher.
Gold and Silver are still melting upward. This move in metals recently certainly shows the markets are still fearful of any potential downside price activity.
Again, I urge traders to stay cautious as we continue to struggle within the sideways price range.
Price will show us what it wants to do and I believe this move higher in BTCUSD could be a false type of breakout move to the upside.
Get some.
#trading #research #investing #tradingalgos #tradingsignals #cycles #fibonacci #elliotwave #modelingsystems #stocks #bitcoin #btcusd #cryptos #spy #gold #nq #investing #trading #spytrading #spymarket #tradingmarket #stockmarket #silver

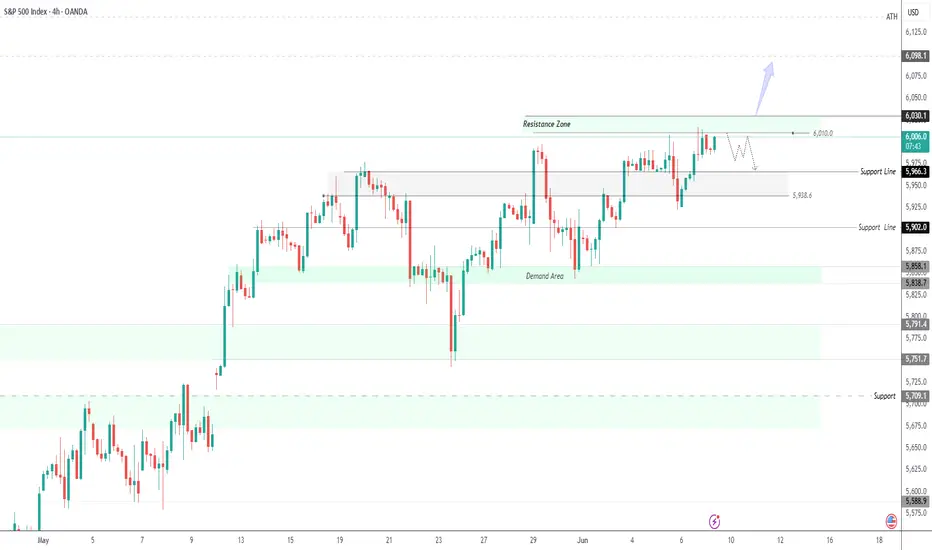
SPX500 – Volatile Week Ahead as Trade Talks and CPI LoomSPX500 | Overview
Fundamental Insight:
S&P 500 futures edged lower early Monday as traders brace for a high-impact week.
Key events include:
- US-China trade talks in London (Monday)
- U.S. inflation data (CPI) expected midweek (Wednesday)
Markets are cautious, awaiting clarity from both geopolitical developments and macroeconomic indicators, which could trigger strong directional moves.
Technical Outlook:
The price appears to be entering a correction phase, with the potential to drop toward 5966.
A confirmed break below 5966 may extend the bearish trend toward 5938 and 5902.
However, a break above 6030 would invalidate the bearish scenario and could trigger a bullish continuation toward 6098 and potentially a new all-time high (ATH).
Pivot Line: 6010
Support Levels: 5966, 5938, 5902
Resistance Levels: 6030, 6098
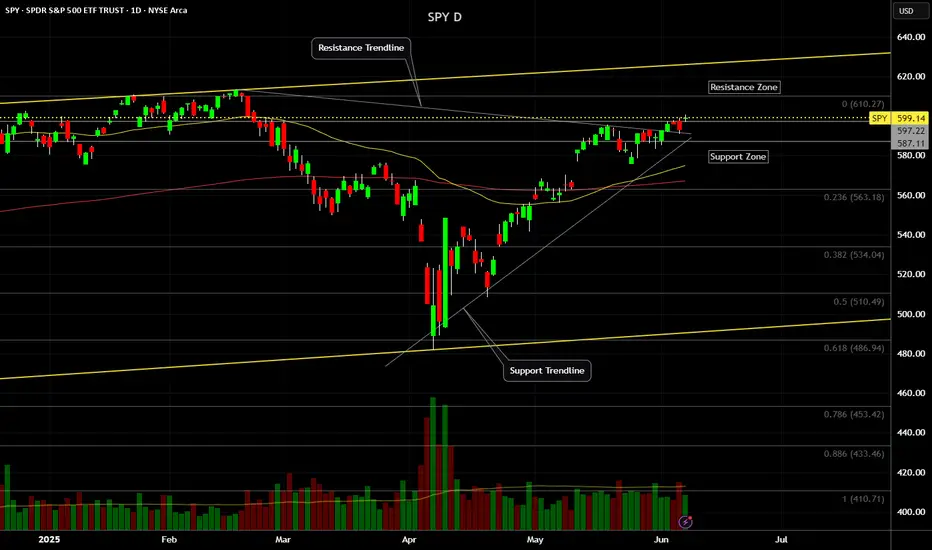
SPY (S&P500 ETF) - Price Attempting Breakout Above ResistanceSPY (S&P500 ETF) price is attempting to breakout above Daily resistance levels of $594 and $597.
SPY ETF has been in an uptrend since May 2025. A Golden Cross also occured on May 19th 2025, signaling that a potential longer term bullish rally could occur.
Friday's candle closed as a Doji signaling some potential indecision after recent price volatility.
SPY price is not at any extreme level on the Daily chart.
If SPY price ever gaps up and rallies up to the $612 to $620 resistance zone, price could sell off stronger (short-term).
In June 2025, trade deal and inflation news will most likely be the catalyst for further volatility, in addition to government news announcements.
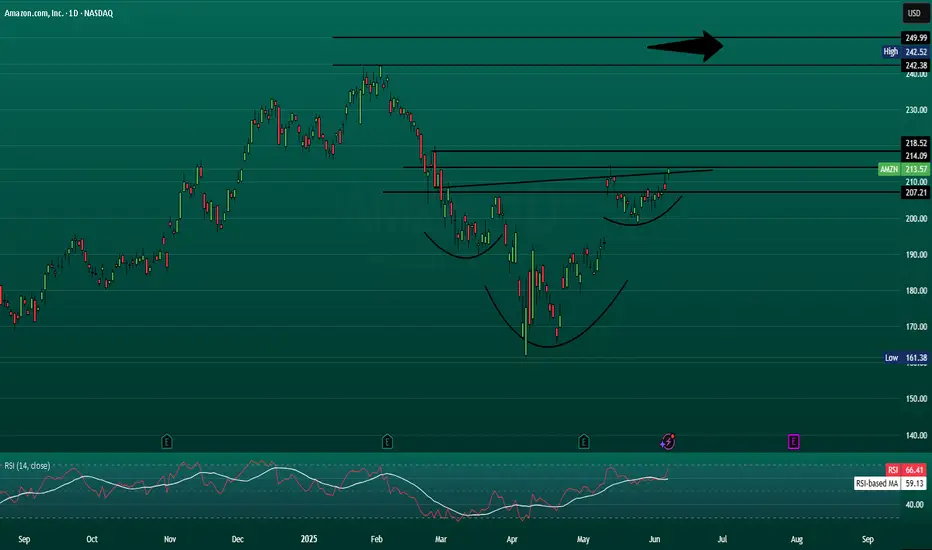
AMZNThis is a company I believe can become one of the most valuable companies by market cap I think they have a toe in every sector at this point. AI is a massive one and robots also them just possibly replacing all employees with AI and robots. That could make them extremely efficient and profitable short term target of 250 with longer term targets of 300. Not a professional and this is not financial advice just what I am speculating.
Skeptic | This Week's Most Profitable Setups: Gold, Forex & SPX!hey, traders, it’s Skeptic ! 😎 Our last watchlist was straight fire, racking up some sweet profits with tons of setups. This week’s looking just as juicy, so stick with me to catch these killer opportunities! 🚖 Welcome to my Weekly Watchlist, where I lay out the markets I’m trading with active triggers—forex pairs, commodities, and CFD indices. No FOMO, no hype, just pure reasoning to keep your trades sharp. Let’s jump in! 📊
DXY (Dollar Index)
Let’s kick off with DXY, ‘cause getting this right makes analyzing other indices and pairs a breeze. After multiple failed attempts to break support at 98.8 , it’s still ranging. This is a monthly support, so confirmation of a break needs to come on a monthly or at least weekly chart. Personally, I’m betting it’ll bounce from here. A break above 99.36 gives early confirmation of a rise, but the real deal is breaking resistance at 100 —then you can short USD pairs like EUR/USD . If 98.8 gives way, look for longs, but this monthly zone is tough, so expect some chop! 😬
EURX
EURX seems to be in a weak upward channel. A break above 1063 could push us to 1071 . On the flip side, breaking the channel’s midline at 1058 might drag us to the floor or even support at 1049 . So, our EURX game plan is clear.
Watchlist Breakdown
Let’s hit the watchlist, starting with XAU/USD (Gold ).
Triggers here are tricky, but I cloned last week’s downward channel and placed it above—this trick often gives us solid setups. If we bounce off the channel’s floor, a break above resistance at 3340 opens a long. For shorts, I don’t have a trigger yet since the market’s already dumped. If we form a 1-hour range, a break below its floor could trigger a short targeting 3249 or the previous channel’s midline.
Now, XAG/USD (Silver)
—no triggers this week. Our long trigger from last week’s analysis at 33.68 smashed it, spiking 8%! 🎉 That’s a lock even Bitcoin traders would drool over, but in Skeptic Lab :)
Next, EUR/USD.
The long trigger is set at a break above resistance at 1.14555 , which lines up with the DXY support break I mentioned. Heads-up: this trade won’t be easy. Reduce risk ‘cause we’re in for a big fight at this level—wild swings and tight stop losses get hunted fast. Stay sharp! 😤
GBP/USD Update
My GBP/USD long got stopped out, so let’s break it down. I went long after a resistance break, with crazy uptrend momentum and RSI hitting overbought (which I see as a long confirmation). Everything looked dope except my stop loss placement. The prior move was so sharp that my stop had to be wide, tanking my R/R. It hit the box ceiling target but then dumped, nailing my stop. Lesson? Either jump in before the main momentum or let the move play out and skip it. Mid-move entries with big stops? Recipe for pain...
SPX 500
Our SPX 500 long trigger from breaking the box ceiling already fired and seems to have pulled back. My target’s 6128.55 , and my open position has a stop loss below 5952.51. If you missed last week’s trade, a new trigger could be a 1-hour resistance break at 6014.20 . If you’re already long, no need to double up.
Final Note
my max risk per trade is 1%, and I suggest you stick to that or lower. I’m cooking up a Money management guide soon, diving deep into why it’s the key to outpacing 90% of traders and boosting your odds of consistent profits. Stay tuned! 🚨 No FOMO, and have an awesome week!
💬 Let’s Talk!
If this watchlist lit a spark, hit that boost—it means a ton! 😊 Got a pair or setup you want me to tackle? Drop it in the comments. Thanks for rolling with me—keep trading smart! ✌️

SPX showing break from ascending triangleSPX500 futures daily chart showing break from ascending triangle. Expecting upside move towards 6100 in coming days
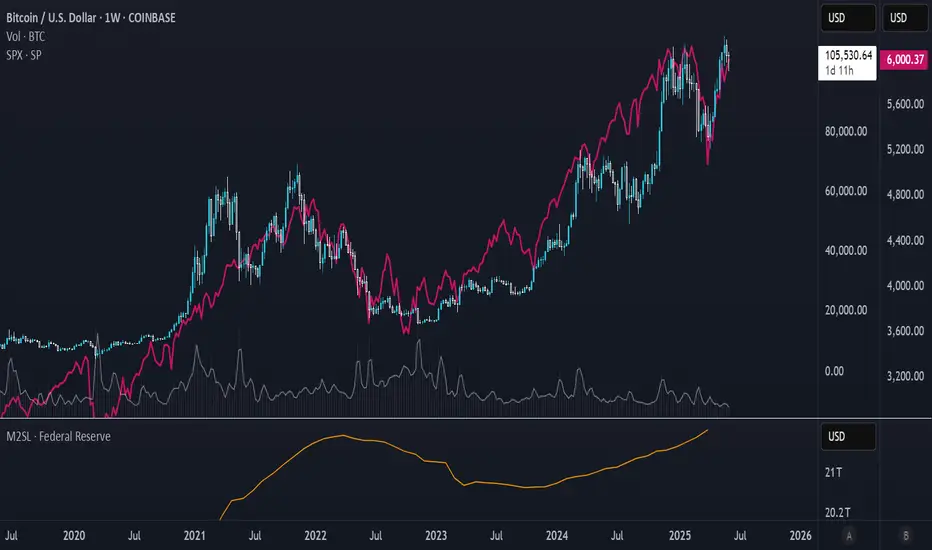
BTC is basically SPX with a higher multiplesince Wall Street got in we actually got significantly more correlated (obviously)
(it wasn't as much prior to 2021)
BTC has basically become SPX with a higher multiple.
Do with that what you will
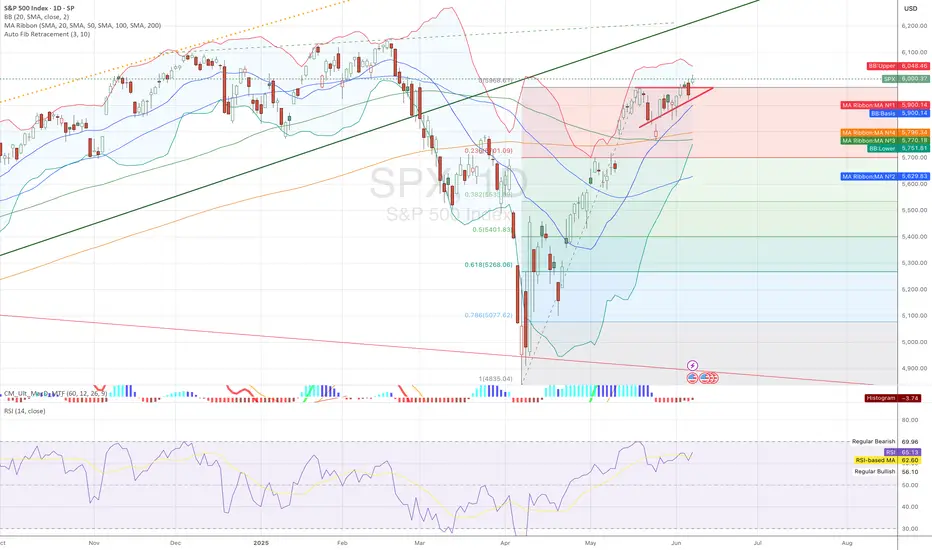
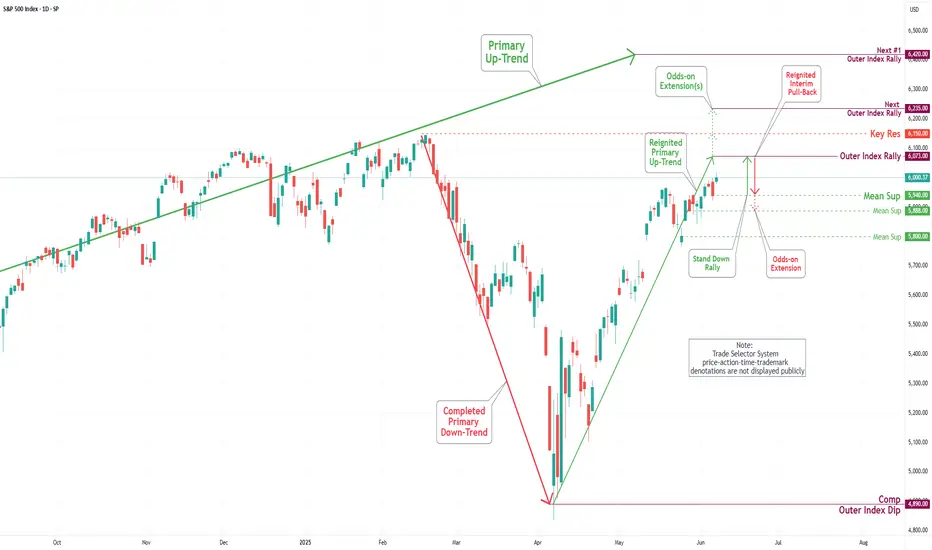
S&P 500 Daily Chart Analysis For Week of June 6, 2025Technical Analysis and Outlook:
The S&P 500 Index has demonstrated an upward trajectory during this week's trading session, surpassing the established Outer Index Rally level of 5955 and the Key Resistance level of 5965. Currently, the index is exhibiting a bullish trend, with a focus on the Outer Index Dip target, set at 6073. Furthermore, additional critical levels have been identified, including Key Resistance at 6150 and the Next Outer Index Rally at 6235. Conversely, there is a potential decline in index prices from the current level or upon completion of the Outer Index Dip 6073, which may lead to a retest of the Mean Support at 5940, with the possibility of extending the pullback to the Mean Support at 5888.
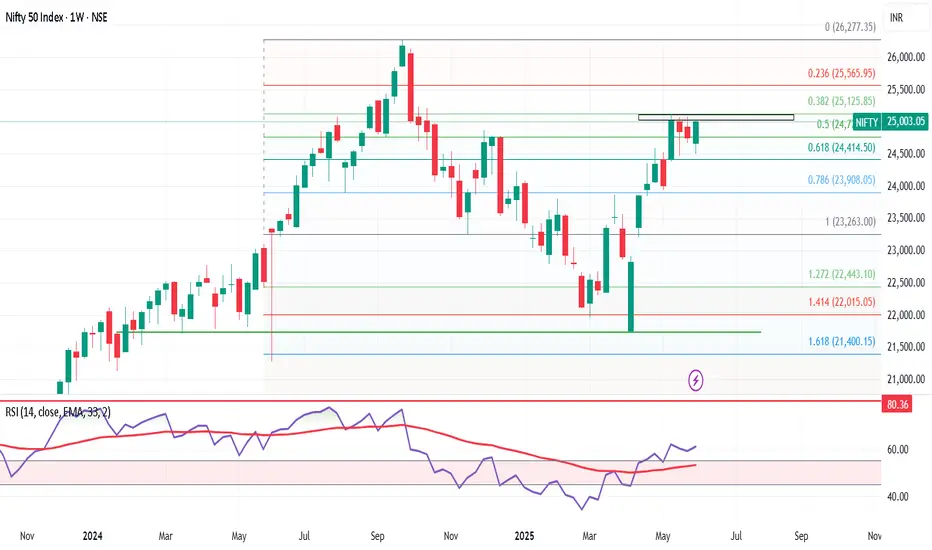
Market Outlook – Nifty Near Critical Levels! Caution Advised
Nifty Weekly Wrap-Up:
The Nifty 50 index closed the week at 25,003, posting a solid gain of +250 points from last week's close. It touched a high of 25,029 and a low of 24,502 during the week.
But here’s the twist—while the uptrend looks strong, we’re now at a crucial inflection point on the weekly chart.
Technical Outlook – Is a Bearish “M” Pattern Forming?
On the weekly timeframe, Nifty is at a level where a bearish M-pattern could potentially develop. To complete this pattern, the index could pull back towards support levels at:
24,414
24,200
24,000
If the selling deepens, the final support zone lies between 23,900–23,700, where a bounce-back is likely.
Bullish Scenario – Can Nifty Break Out?
If Nifty holds above 25,000 for at least 2 consecutive sessions, it could trigger a short-covering rally, paving the way for a move toward key resistance zones at:
25,400
25,565
26,100
Next Week’s Expected Range: 24,500 – 25,500
This range should see most of the action next week. If you're holding long positions, now is a great time to:
✔️ Lock in profits
✔️ Trail stop-losses
✔️ Prepare cash reserves for potential dip-buying opportunities
Global Watch – S&P 500 Hits Key Resistance
The S&P 500 closed near 6,000, up 100 points for the week. But heads up—it’s now testing a strong Fibonacci resistance at 6,013.
A rejection here could lead to a correction toward 5,900–5,850, a dip of 1.5–2.5%. If this unfolds alongside a Nifty pullback, it would align perfectly with our support targets around 24,400–24,500.
Final Takeaway:
Markets are looking stretched. While momentum remains positive, profit booking at higher levels is essential. Don’t get caught unprepared in case of a reversal. Stay tactical, stay liquid.
Smart money is already locking in gains. Are you?
$NIFTY: New highs incoming; 27500 can be cycle highsNSE:NIFTY the index from India which holds the top 50 stocks in India. IN the chart below we have overlayed the SP:SPX index. The NSE:NIFTY and $S&P500 have been in lockstep for more than 5 years as shown in the chart below. The indices are just 2.5% away from their ATH. Even with these levels the RSI for NSE:NIFTY is 61 and 58 in case of $SPX.
The RSI is far from overbought condition. So, this rally which started in NSE:NIFTY can have more legs. With Global liquidity on the rise and RBI easing policy rates the NSE:NIFTY can reach its all-previous highs of the Fib retracement levels. The previous peak was 0.786 Fib retracement level which on this upward sloping chart can be as high as 27500 which can indicate another 10% upside.
Verdict : Stay long $NIFTY. More upside possible. RSI still not overbought.

SPY/QQQ Plan Your Trade For 6-6 : Inside-Breakaway Counter-TrendToday's pattern suggests the markets may attempt a Counter-trend type of Inside Breakaway pattern.
I read this as a downward price trend (counter to the current upward price trend).
The markets seem to have bounced overnight - prompting a potentially strong opening price level.
If my Inside-Breakaway shows up today, things could get very interesting if a breakdown in price sets up.
Many of you know I've been expecting a broader market breakdown to take place - sending the SPY/QQQ down about 7% to 13% or more.
It hasn't happened yet and the SPY/QQQ continue to try to push a bit higher - but, until we break to new highs, the breakdown event is still possible.
Let's see how things play out today. Platinum is showing that the global markets are entering an extreme speculative phase (very similar to 2000-2008). Transports are stalling, showing the US economy is expected to weaken over the next 3+ months.
Imagine that. Speculation is ramping up while the US market may move into a recession in H2:2025. Wow.
We certainly live in interesting times.
Get some.
#trading #research #investing #tradingalgos #tradingsignals #cycles #fibonacci #elliotwave #modelingsystems #stocks #bitcoin #btcusd #cryptos #spy #gold #nq #investing #trading #spytrading #spymarket #tradingmarket #stockmarket #silver
