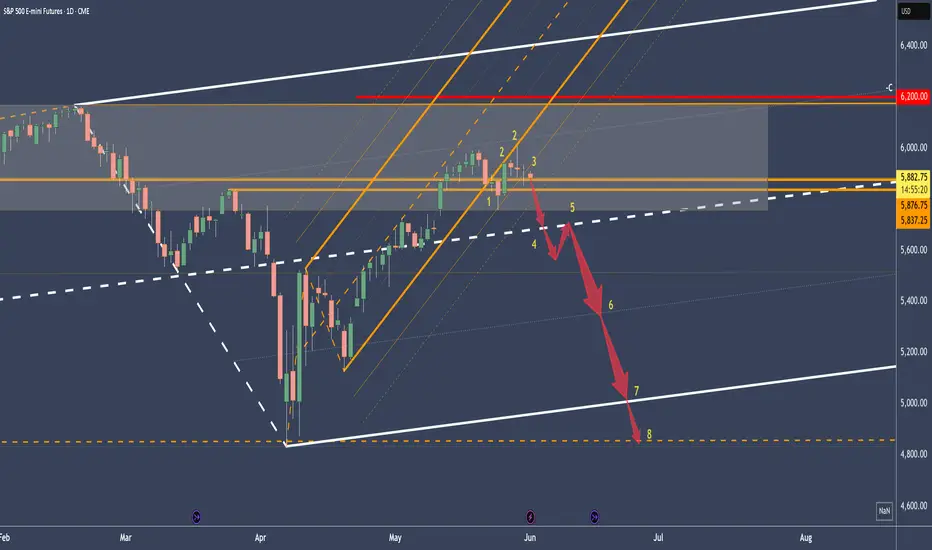
S&P 500 – Projection to the SouthLooking at the market's behavior using the orange median line/fork, one can clearly see how the market reacts when it touches one of the lines.
Median lines/forks are not an oracle. They simply project the highest probable path of the price based on a mathematical calculation inherent to the tool.
If you follow the rule set, money management, and risk management, you have a wonderful framework that offers a significant advantage in trading the markets.
Let’s take a look at the current situation:
The orange fork:
– Price closes outside the fork (1)
– Multiple retests of the L-MLH (textbook behavior) (2)
– Break of the 1/4 line, heading toward the 1st warning line (3)
Next movement pattern according to the median line framework:
– Drop to the white centerline (4)
– Retest of the centerline (5)
– 1/4 line (6)
– Lower median line parallel (7) with a possible retest
– Orange centerline of the pendulum fork (8)
Wishing everyone a wonderful start to the week.
S&P 500 (SPX500)
SPX500 (Daily) Elliot wave 4 underwaySPX appears to be printing a wave 4, potentially a triangle giving the proximity to the all the time high. Triangles are a motif wave ending pattern with a thrust up afterwards, typically a poke above the previous all time high before retracing trapping retail with FOMO.
Wave 2 is expected to retrace to the bottom of the triangle / wave 4 currently the high volume node support and .236 Fibonacci retracement at $5680
Safe trading

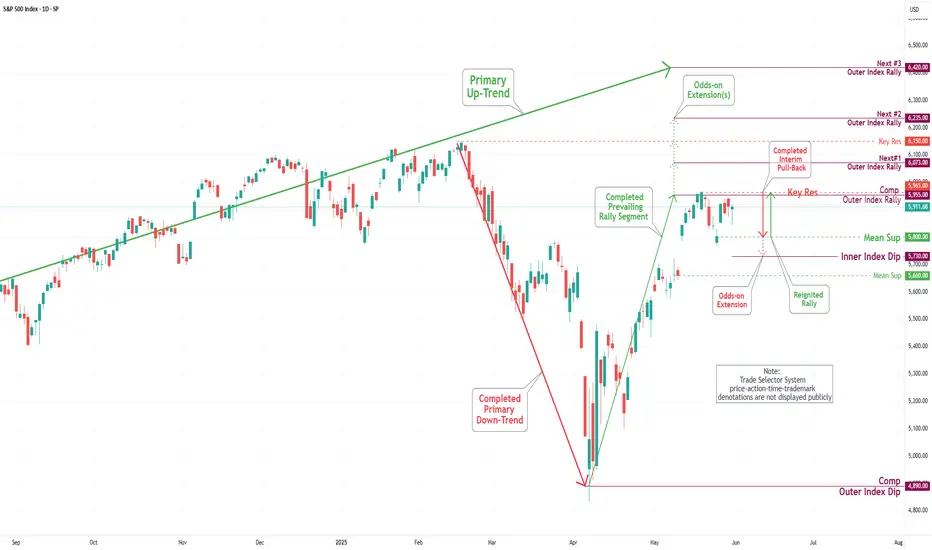
S&P 500 Daily Chart Analysis For Week of May 30, 2025Technical Analysis and Outlook:
The S&P 500 Index has undergone considerable price fluctuations during the trading sessions of this week, successfully reaching a critical target at the Mean Support level of 5800. Presently, the index is exhibiting an upward trend with a focus on the retest of the Inner Index Dip at 5955 and Key Resistance at 5965. Furthermore, additional significant levels have been identified, including the Next#1 Outer Index Rally at 6073, Key Resistance at 6150, and the Next#2 Outer Index Rally at 6235. Conversely, there is a potential for the index prices to downfall aiming to retest Mean Support 5800 and to complete the Outer Index Dip, noted at 5730.
Palantir Goes to Repeat Tycoon Buffett Early 1990s AchievementSomewhere in another Galaxy, in late December, 2024 (yet before The Second Coming of Trump), @TradingView asked at it awesome Giveaway: Happy Holidays & Merry Christmas.
1️⃣ What was your best trade this year?
2️⃣ What is your trading goal for 2025?
Here's what we answered:
1️⃣ What was your best trade this year?
- Surely Palantir NASDAQ:PLTR 💖
I followed Palantir all the year since January, 2024, from $16 per share, watch here .
Current result is 5X, to $80 per share.
Also I added more Palantir after SP500 Index inclusion in September 2024 watch here .
Current result is 2.6X, from $30 to $80 per share.
2️⃣ What is your trading goal for 2025?
- Once again, surely Palantir NASDAQ:PLTR 💖
It's gone 4 months or so... (Duh..? Ahaha.. 4 months, really? 😸😸😸)
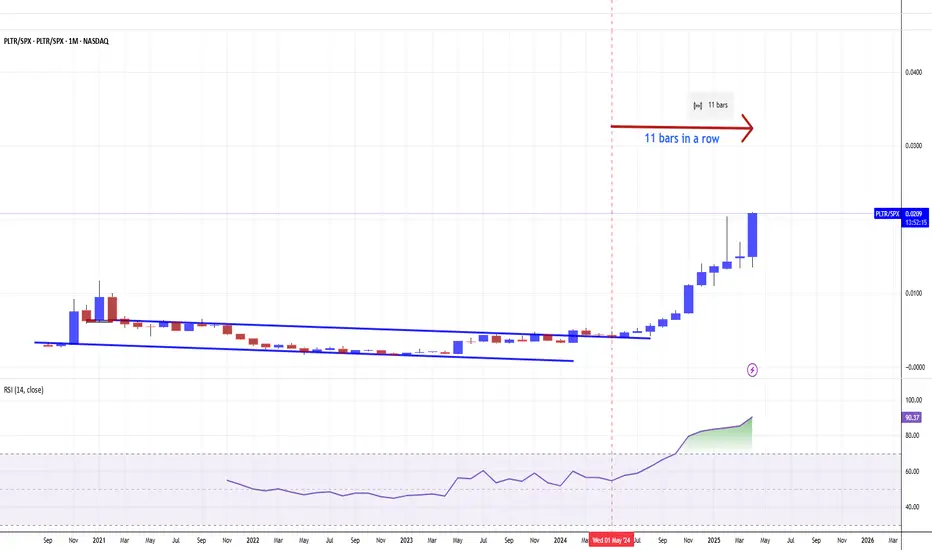
Let see what's happened next at the main graph PLTR/SPX
First of all, let me explain in a few words what does this graph mean.
Rising (Blue) candle means Palantir NASDAQ:PLTR monthly return is better vs SPX
Falling (Red) candle means Palantir NASDAQ:PLTR monthly return is worse vs SPX
Conclusion
Palantir. The stock that outperformed S&P 500 Index, 11 consecutive months in a row.
Palantir. The stock that printed 11x since inception. 5.5x over the past twelve month and 1.5x in the year 2025 (the best one result so far over the all S&P 500 Index components).
Palantir. The stock that goes to repeat Tycoon Buffett achievement early 1990s (in 1992-93 Berkshire Hathway outperformed S&P 500 Index for a straight TWELVE MONTHS.
Palantir. Were we right with this stock on contest and won it? Exactly! Even though our prize has been toadly strangled. 🤭
--
Best wishes,
Your Beloved @PandorraResearch Team 😎
SPY/QQQ Plan Your Trade for 5-30 : CRUSH PatternToday's CRUSH pattern should result in a continued downward price trend in my analysis is accurate. I have seen CRUSH pattern trend upward sometimes. So, please understand I'm reading the chart and pattern as a rolling top type of pattern leading to a CRUSH (downward) price trend today.
I highlight the potential for a FAILED CRUSH (downward) price bar - whereas a reversion back to the upside is a potential. But, I estimate that potential at only 20-25% at this time.
My analysis suggests the breakdown in price will likely continue, and we'll likely see the SPY/QQQ/Bitcoin continue to try to trend downward.
Gold and Silver are moving into a fairly solid Gap-Stall-Revert-Flush pattern that may see Gold attempt to rally back above $3400 today. Silver is currently trading very close to a STDDEV Reversion level, so Silver may not see a big move today (like Gold).
I'm hopeful we start to see a big breakaway move in Gold/Silver today and carry into next week.
My TTScanner algos generated new BUY triggers for GDX, GDXJ, and NUGT yesterday. That's a very good sign we are getting into a BUY/BULLISH mode in metals again.
I got up late today. Somehow, my alarms got turned off.
Happy Friday.
Get some.
#trading #research #investing #tradingalgos #tradingsignals #cycles #fibonacci #elliotwave #modelingsystems #stocks #bitcoin #btcusd #cryptos #spy #gold #nq #investing #trading #spytrading #spymarket #tradingmarket #stockmarket #silver

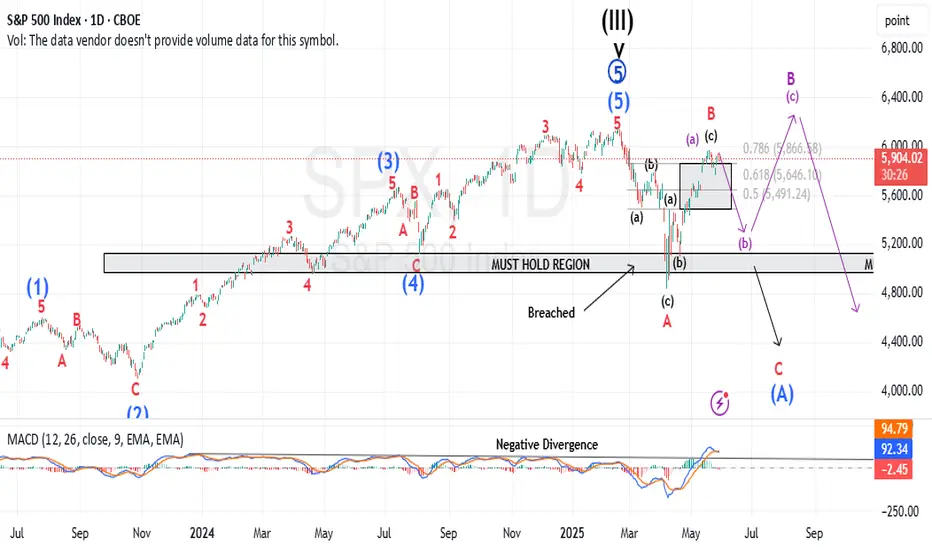
Tracking a pattern that could signal the Top is In I am tracking a micro pattern with the new local high made in the ES last night and today's price action as a micro 5-down....we should get a slight retrace into the 5960 ish area. Maybe tomorrow...maybe in the overnight session tonight.
If price can then breach todays micro low of 5884 in the ES futures...we need to then follow through with a breach of 5857 to give us our first indication, we may have struck a top.
From there I am following 2 counts...Purple, or my primary count which is a minor C of Intermediate (A).
Best to all,
Chris
S&P INTRADAY corrective pullback - support retest?Trump-Era Tariffs Canceled: A US court struck down the “Liberation Day” tariffs, effective immediately. This boosts sentiment for industrials, consumer goods, and global supply chain-reliant stocks. The government is appealing the ruling.
US Dollar Strengthens: The DXY is back above 100, up 1.8% from last week’s lows. A strong dollar helps importers but may pressure exporters and commodities.
Fed Rate Cut Expectations Decline: Markets now price 42 bps of rate cuts in 2024, down from 50 bps. This supports financials (e.g. banks), but challenges rate-sensitive sectors like real estate and small caps.
Mixed Eurozone Data: Positive Italian confidence figures offset weak German and French job numbers, offering slight global risk support. Limited direct impact on US stocks.
Fed Flags Stagflation Risk: Minutes show the Fed is worried about stagflation. This could weaken confidence in growth stocks and favor defensive sectors.
Today’s US Data Watch:
Q1 GDP 2nd estimate (expected -0.3%)
Weekly jobless claims
Fed speakers
All ahead of Friday’s key PCE inflation data
Market Outlook
Positive: Trade relief, resilient dollar, stronger bank outlook
Caution: Slowing growth, inflation worries, fewer rate cuts
Focus Areas: Industrials, financials, tech (watch for pullbacks); avoid rate-sensitive sectors short term
Key Support and Resistance Levels
Resistance Level 1: 6010
Resistance Level 2: 6070
Resistance Level 3: 6160
Support Level 1: 5780
Support Level 2: 5740
Support Level 3: 5700
This communication is for informational purposes only and should not be viewed as any form of recommendation as to a particular course of action or as investment advice. It is not intended as an offer or solicitation for the purchase or sale of any financial instrument or as an official confirmation of any transaction. Opinions, estimates and assumptions expressed herein are made as of the date of this communication and are subject to change without notice. This communication has been prepared based upon information, including market prices, data and other information, believed to be reliable; however, Trade Nation does not warrant its completeness or accuracy. All market prices and market data contained in or attached to this communication are indicative and subject to change without notice.

SPY/QQQ Plan Your Trade For 5-29 : Harami Inside patternToday's pattern suggests the SPY will stall within yesterday's body range and possibly trend a bit downward (after NVDA news/earnings).
I don't see the markets really extending much higher today as we are moving into a sideways Harami pattern, then into a CRUSH pattern tomorrow.
Gold and Silver are really making a big move higher this morning, which suggests traders are back to actively hedging against risk across the globe.
BTCUSD is trading flat/sideways - looking for some direction and, obviously, NOT RALLYING right now.
In my mind, the markets are struggling for direction, and Gold/Silver are showing that real risks are still elevated.
I also highlight my new Pure Alpha TTScanner algo and the work I'm doing to try to help more traders. The best part about what I do is that I get to create solutions/tools for traders. I love it.
Get some.
#trading #research #investing #tradingalgos #tradingsignals #cycles #fibonacci #elliotwave #modelingsystems #stocks #bitcoin #btcusd #cryptos #spy #gold #nq #investing #trading #spytrading #spymarket #tradingmarket #stockmarket #silver

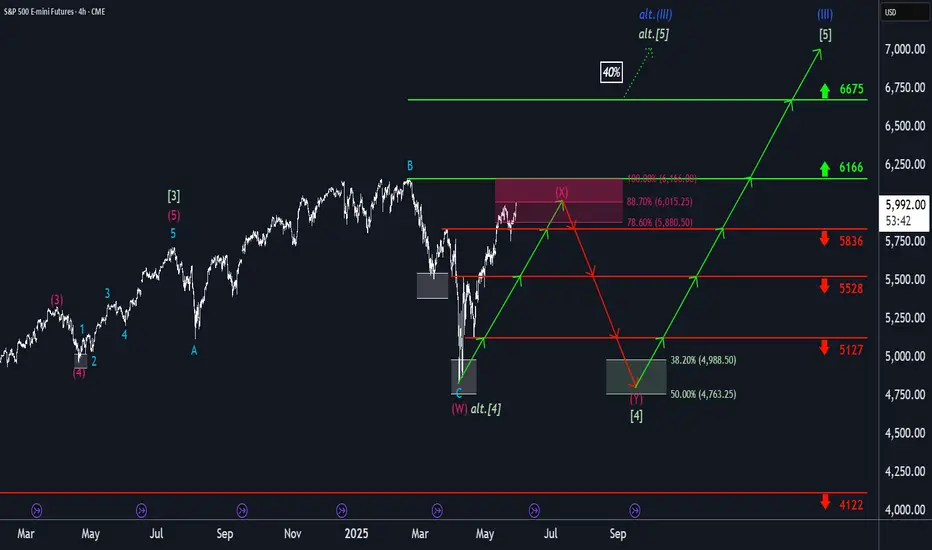
S&P500: Top Within ReachThe S&P has recently continued its upward movement, climbing higher into the magenta-colored Short Target Zone between 5,880 and 6,166 points. Primarily, we expect the top of the current wave (X) in magenta within this price range, after which a downtrend should follow with wave (Y). This final phase of the magenta three-part movement should lead the index into the green Long Target Zone between 4,988 and 4,763 points, completing the overarching green wave there. A rise above the upper boundary of the Target Zone and a breach of resistance at 6,675 points would trigger our alternative scenario.
📈 Over 190 precise analyses, clear entry points, and defined Target Zones - that's what we do.
CHILE Stock Market Technical and Fundamental PerspectivesChile’s stock market is primarily represented by several key indices, each with distinct characteristics and coverage:
IGPA (Índice General de Precios de Acciones) BCS:SPCLXIGPA
The IGPA is the broadest and most representative index, covering the majority of stocks traded on the Santiago Stock Exchange. It is a capitalization-weighted index, revised annually, and includes companies across all major sectors of the Chilean economy. As of May 2025, the IGPA reached a historic high of over 42,000 points, reflecting robust market performance.
IPSA (Índice de Precios Selectivo de Acciones) BCS:SP_IPSA
The IPSA is a more focused index, comprising the 40 most heavily traded stocks on the Santiago Stock Exchange. It is revised quarterly and serves as the benchmark for large-cap Chilean equities.
S&P/CLX INTER Index 10 BCS:SPCLXIN10
This index tracks the 10 main Chilean stocks that also have American Depositary Receipts (ADRs) listed abroad, providing a bridge between local and international investors.
STOXX® Chile Total Market Index
This index aims to cover approximately 95% of Chile’s free-float market capitalization, with top components including major companies such as Falabella, Banco de Chile, LATAM Airlines Group, Cencosud, Banco Santander Chile, Empresas Copec, and Sociedad Química y Minera de Chile (SQM).
Key Components
The leading companies in Chile’s indices span various sectors:
Financials: Banco de Chile, Banco Santander Chile, Banco de Crédito e Inversiones
Retail: Falabella, Cencosud
Utilities/Energy: Enel Américas, Empresas Copec
Mining/Chemicals: Sociedad Química y Minera de Chile (SQM)
Forestry/Paper: Empresas CMPC
Airlines: LATAM Airlines Group
Long-Term Technical Perspective and Recent Trends
The Chilean stock market, as reflected by the IGPA and IPSA, has experienced a strong rally in 2025, with the major indices gaining over 25% year-to-date
The MSCI Chile index currently presents a mixed technical picture. While long-term moving averages (200-day) signal a "buy," shorter-term indicators (5-100 day) are on "sell," and several oscillators (RSI, Stochastic, MACD) indicate oversold conditions or continued selling pressure.
This suggests that, despite the recent rally, some short-term consolidation or correction could occur, but the long-term trend remains constructive.
Fundamental breakdown
The Santiago Stock Exchange’s market capitalization stands at approximately $187 billion, with a price-to-earnings (P/E) ratio of 12.08, which is below both the emerging markets average (14.3) and the global average (22.12).
This relatively low valuation, even after a significant rally, suggests Chilean equities remain attractive on a fundamental basis.
The Chilean economy is projected to grow by 2.3% in 2025. Inflation has moderated to 4.5%, and the central bank’s benchmark interest rate is stable at 5%.
The banking sector is particularly robust, with Banco de Chile reporting a 14.2% year-over-year increase in net income for Q1 2025.
The mining sector, especially lithium, is poised for growth following major investments and Chile’s strategic push to regain global leadership in lithium production.
The combination of strong fundamentals, sectoral diversity, and attractive valuations positions Chile’s stock market for steady long-term growth, though short-term volatility is possible as global and local conditions evolve.
Conclusion
Chile’s stock market demonstrates strong long-term potential, underpinned by solid economic fundamentals, sectoral strengths, and attractive valuations, though investors should remain mindful of cyclical corrections and global market influences.
Thу main technical chart for CBOE:ECH - iShares MSCI Chile ETF (total return) points on massive 200-months SMA breakthrough, attempts to break long term 'descending top/ flat bottom' technical figure.
--
Best wishes,
@PandorraResearch Team 😎

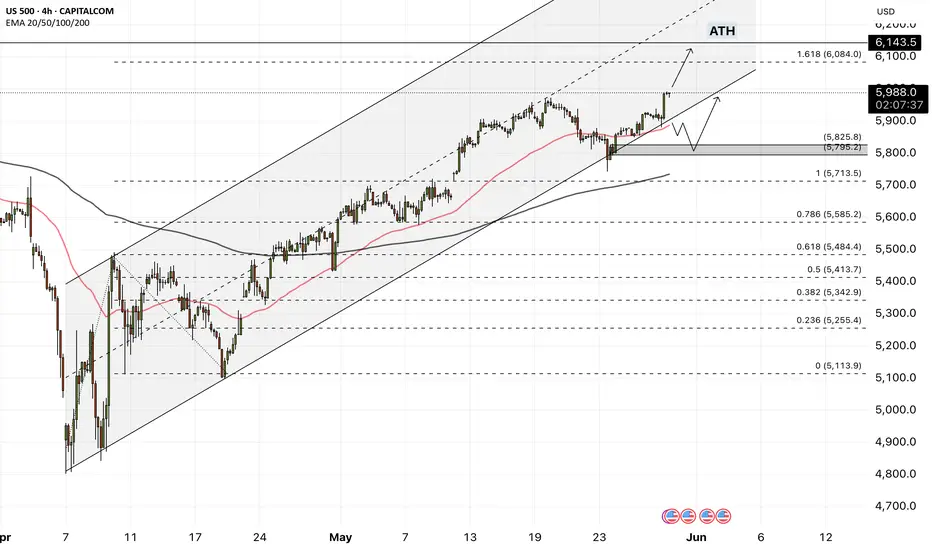
US500 - Will the stock market reach ATH?!The index is above the EMA200 and EMA50 on the four-hour timeframe and is trading in its ascending channel. I expect the index to continue moving, and on the other hand, if the index declines towards a certain zone, you can also look for the next S&P long positions with a risk-reward ratio.
Yesterday, a U.S. federal court halted the implementation of President Trump’s “Freedom Day” tariffs. The U.S. Court of International Trade ruled that these tariffs exceeded the legal authority granted to the president and unanimously decided to revoke them. Nonetheless, Trump still retains the right to appeal the ruling.
Following the court’s decision, President Trump promptly filed an appeal. In response, the White House issued a statement asserting, “The decision on how to handle a national emergency should not fall into the hands of unelected judges.”
Meanwhile, the market reacted strongly to Nvidia’s latest financial report. The company’s stock surged by as much as 5.8% in after-hours trading, before settling at a 4.8% gain compared to the previous day.
This bullish movement reflects investors’ confidence in Nvidia’s continued strong performance.
Nvidia is actively expanding into new markets, including the Middle East—an indication that the company is poised for sustained growth even if its presence in China is constrained.
The rally in Nvidia’s stock didn’t just lift semiconductor companies; broader markets followed suit. The S&P 500 index climbed to 6,005.75 points, representing a 1.7% increase from the prior session.
According to the company’s announcement, Nvidia posted $44.1 billion in revenue for the first quarter of fiscal year 2026, marking a 69% increase year-over-year and slightly surpassing analysts’ expectations. Revenue from data center operations rose 73% to reach $39.1 billion.
CEO Jensen Huang stated: “Our Blackwell NVL72 AI supercomputer—designed for reasoning and acting as a ‘thinking machine’—is now being mass-produced by system builders and cloud service providers.” He added, “There is enormous global demand for Nvidia’s AI infrastructure. Over the past year alone, AI inference token generation has grown tenfold. As AI agents become mainstream, the demand for AI compute will continue to surge.”
A Reuters poll now projects that the S&P 500 will reach 5,900 by the end of 2025—down from the 6,500 level forecast in February. Similarly, the Dow Jones index is expected to close 2025 at 43,708, compared to the previous projection of 47,024 from the February survey.
Separately, the Federal Deposit Insurance Corporation (FDIC) reported that the increase in U.S. bank profits was largely driven by growth in noninterest income. Bank earnings in the first quarter of 2025 rose by 5.8%, reaching $70.6 billion. While overall asset quality remains favorable, the commercial real estate loan portfolios continue to show signs of weakness. The number of “problem banks” declined by three, bringing the total down to 63. The banking industry also reported a slowdown in lending growth; the annual loan growth rate for the first quarter was just 3%, down from the pre-pandemic average of 4.9%.
Skeptic | SPX 500 Update: Bullish Breakout Brewing?Hey everyone, Skeptic here! It’s been a while since we’ve checked in on the SPX 500 , but the market’s now flashing a killer long opportunity with a high R/R—don’t miss this one! 😊 Stay with me to the end for the full breakdown. Let’s dive into the Daily Timeframe to set the stage. 📊
Daily Timeframe: The Big Picture
The SPX 500 pulled off a deep correction , dropping from a high of 6154.64 to lows around 4810.39 with some wild shadows that caught everyone off guard. But now, it’s firing up with fresh momentum, carving out higher highs and higher lows that scream bullish strength. The corrections in this new uptrend are super shallow and flow with the trend—exactly what we want to see! After hitting resistance at 5961.82 , we’ve had a slight pullback, but it looks like this correction is wrapping up, and we’re on the verge of the next big uptrend leg. Let’s zoom into the 4-Hour Timeframe to hunt for long and short triggers.
4-Hour Timeframe: Long & Short Setups
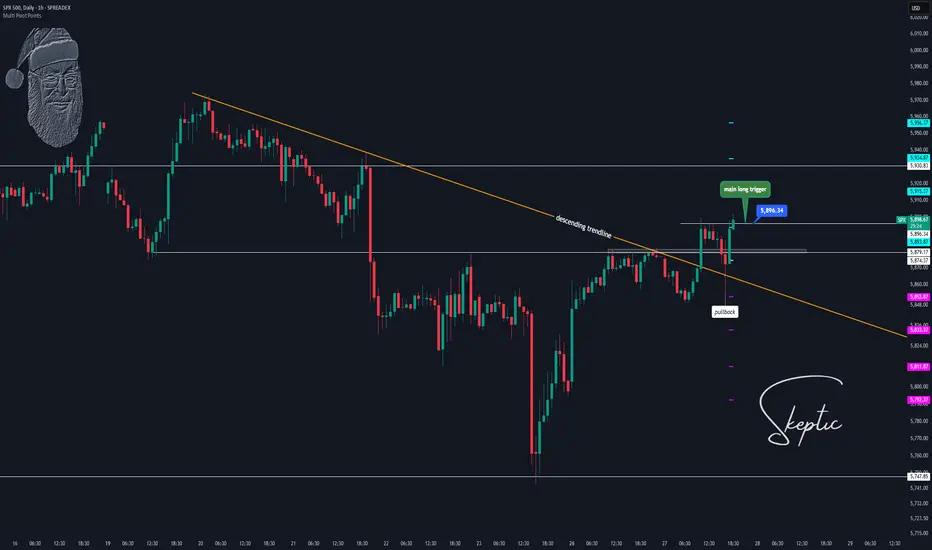
On the 4-hour chart, the correction shaped up as a descending trendline . We broke it, pulled back, and now we’re primed to crack 5895.39. A breakout above this level is our main long trigger. To get more precise, let’s check the 1-Hour Timeframe.
For the long setup , a clean break above 5896.34 gets us in the game. This move also busts through P.P. Level 1, giving us solid confirmation, and we could ride the wave up to P.P. Levels 3 or 4, targeting 5930.83 to 5956.97 . Those are prime spots to lock in some profits, but don’t close the whole position—since we’re trading with the trend, we can hold for more upside. For shorts, I’ve got nothing. Going against this bullish momentum would be pure madness! I’d wait for a sharp drop below support at 5849.67 before even considering short triggers, but right now, there’s zilch.
💬 Let’s Talk!
If this update sparked some ideas, give it a quick boost—it means a lot! 😊 Got a pair or setup you want me to tackle next? Drop it in the comments. Thanks for hanging out— let’s grow together and remember: Weathermen forecast. We trade! :))) ✌️
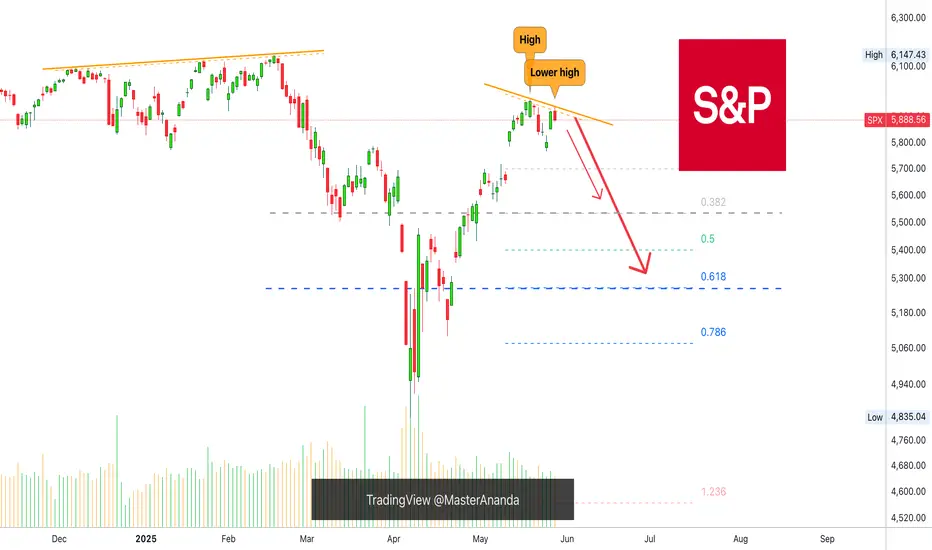
SHORT The S&P 500 Index: Not A Bear Market, Just A CorrectionWe are about to witness an inception of bearish action. A correction within a correction.
After 7-April, the Cryptocurrency market started to recover, but the main Altcoins that were growing were all memecoins, and I wondered, "Why are mainly memecoins growing?" I know that when memecoins grow the market is actually bearish on the bigger picture. I shrugged it off and went LONG.
It seems I have an explanation now, this recovery was only a partial recovery or, we are just in front of a classic retrace, a small correction. This means that regardless of how fast and strong it goes the end will result in a higher low, compared to 7-April. This means that the bullish structure will remain intact, but you can't change the fact that strength is not present on this chart.
The SPX is going down next. There two main support levels to consider, you decide which one is the one that you should take. My job is to alert you of the event before it happens, great timing and entry prices, you can take care of the rest.
Thank you for reading.
This is a friendly reminder.
Market conditions can always change.
Namaste.
SPX500 H4 I Bearish Drop Based on the H4 chart, the price is approaching our sell entry level at 6001.65, a pullback resistance.
Our take profit is set at 5849.37, a pullback support.
The stop loss is set at 6153.88, a swing high resistance.
High Risk Investment Warning
Trading Forex/CFDs on margin carries a high level of risk and may not be suitable for all investors. Leverage can work against you.
Stratos Markets Limited (tradu.com ):
CFDs are complex instruments and come with a high risk of losing money rapidly due to leverage. 63% of retail investor accounts lose money when trading CFDs with this provider. You should consider whether you understand how CFDs work and whether you can afford to take the high risk of losing your money.
Stratos Europe Ltd (tradu.com ):
CFDs are complex instruments and come with a high risk of losing money rapidly due to leverage. 63% of retail investor accounts lose money when trading CFDs with this provider. You should consider whether you understand how CFDs work and whether you can afford to take the high risk of losing your money.
Stratos Global LLC (tradu.com ):
Losses can exceed deposits.
Please be advised that the information presented on TradingView is provided to Tradu (‘Company’, ‘we’) by a third-party provider (‘TFA Global Pte Ltd’). Please be reminded that you are solely responsible for the trading decisions on your account. There is a very high degree of risk involved in trading. Any information and/or content is intended entirely for research, educational and informational purposes only and does not constitute investment or consultation advice or investment strategy. The information is not tailored to the investment needs of any specific person and therefore does not involve a consideration of any of the investment objectives, financial situation or needs of any viewer that may receive it. Kindly also note that past performance is not a reliable indicator of future results. Actual results may differ materially from those anticipated in forward-looking or past performance statements. We assume no liability as to the accuracy or completeness of any of the information and/or content provided herein and the Company cannot be held responsible for any omission, mistake nor for any loss or damage including without limitation to any loss of profit which may arise from reliance on any information supplied by TFA Global Pte Ltd.
The speaker(s) is neither an employee, agent nor representative of Tradu and is therefore acting independently. The opinions given are their own, constitute general market commentary, and do not constitute the opinion or advice of Tradu or any form of personal or investment advice. Tradu neither endorses nor guarantees offerings of third-party speakers, nor is Tradu responsible for the content, veracity or opinions of third-party speakers, presenters or participants.

SPY/QQQ Plan Your Trade Update For 5-28 : Calm Before The StormThis update is designed to help you understand why the SPY/QQQ/BCTUSD, as well as GOLD/SILVER and others, should stay rather FLAT today.
Unless there is some major news event (or other event) before the NVDA earnings data, I suspect the markets will stay very muted/flat through the close of trading today.
I hope you are all enjoying my 'Plan Your Trade' videos. Now that I've gotten through most of the family doctor/medical issues, it's back to work for me.
I'm working on a BTCUSD Cycle Pattern system as well as more advanced algos/trade triggers for subscribers.
Let me know how I'm doing. Is there something you want to see in these videos? Let me know.
Get some.
#trading #research #investing #tradingalgos #tradingsignals #cycles #fibonacci #elliotwave #modelingsystems #stocks #bitcoin #btcusd #cryptos #spy #gold #nq #investing #trading #spytrading #spymarket #tradingmarket #stockmarket #silver

SPY/QQQ Plan Your Trade For 5-28 : Inside Breakaway PatternToday's Inside-Breakaway pattern suggests the markets may attempt to rally above yesterday's close on strong news or earnings. Today is the NVDA earnings day (after the close). I suspect trading will be somewhat flat ahead of these highly anticipated earnings.
Traders would be smart to position into a HEDGE ahead of the NVDA earnings this afternoon.
Obviously, if the earnings are good, the markets will react to the upside. If they are poor/weak, the markets could easily move aggressively downward.
All I know is the tariff moves over the past few weeks pushed gamers and others into buying high-end graphics cards back in April/May because everyone thought prices would skyrocket 30-50% or more. So, maybe NVDA will report strong revenue while costs increase.
It should be an interesting day after the close. Until then, I believe the markets will stay somewhat FLAT - anticipating NVDA data/comments.
Gold and Silver are still working through the FLAG APEX. Silver is already beyond the FLAG APEX and could make a big move higher at any moment. Gold still has one small downward price move to complete before the FLAGGING pattern is complete.
Overall, I believe Gold and Silver are forming a solid base near $3300/$33 for a strong rally in the future.
BTCUSD is stalling. In fact, the SPY/QQQ/BTCUSD are all stalling near the 0.75% Fib level (as shown on my charts). We may be setting up for that big breakdown I've been warning about. But, until we actually SEE price break out of the upward EPP Flagging channel - don't get overly confident of a BIG BREAKDOWN move.
My advice would be to HEDGE any aggressive trades you are trying to take right now. If you believe the markets are going to rally substantially, try to hedge that trade with some risk protection (longer-dated PUTS).
Today could be a catalyst day. We may get a breakout/breakdown move after NVDA's earnings/data.
Buckle up.
Get some.
#trading #research #investing #tradingalgos #tradingsignals #cycles #fibonacci #elliotwave #modelingsystems #stocks #bitcoin #btcusd #cryptos #spy #gold #nq #investing #trading #spytrading #spymarket #tradingmarket #stockmarket #silver

SPY (S&P500 ETF) - Price Bounced Above Gap Support Zone - DailySPY (S&P500 ETF) price has bounced up from the $576 price support gap level.
EMA Golden Cross is still active, the yellow 50EMA crossed above the red 200EMA which could signal a longer term bullish rally.
SPY price has been in an uptrend since May 2025.
Resistance Levels: $594, $596, $600, $607, $613.
Support Levels: $581, $575, $572, $567, $564.
Tariff and trade deal news, corporate earnings, presidential and government law changes, inflation data, economic data, and consumer sentiment can all affect Stock and ETF prices.
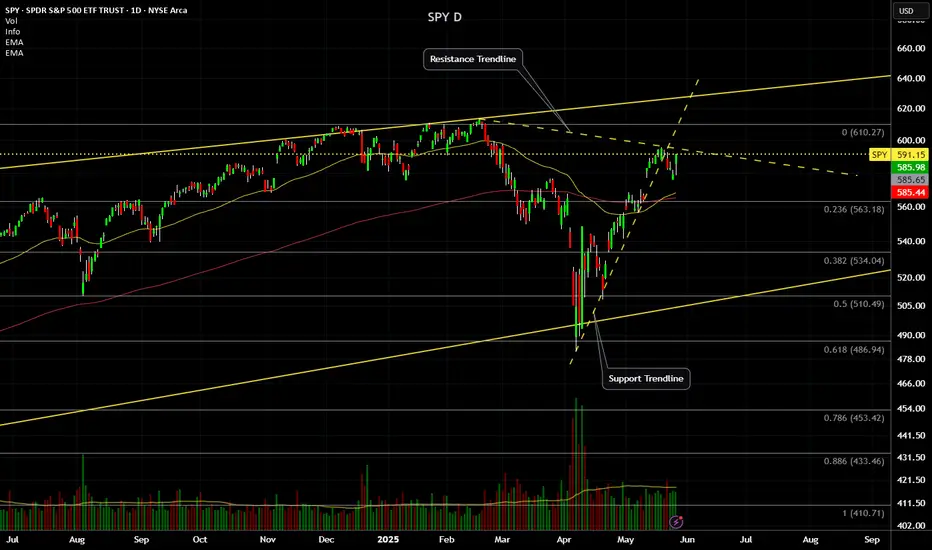
Flying into the sun or about to get burnt?Market is about to reach all-time highs again. Many trade deals must have been made. Interest rates must have been cut. Wars must have been resolved. Personal debt must have come under control. Corporate debt must have been resolved.
Wait, nothing has changed? Things are worse? Well why is the index about to hit new all-time highs? My take is a major fake out. We are about to set a double top as we complete a rising wedge pattern.
The rising wedge.
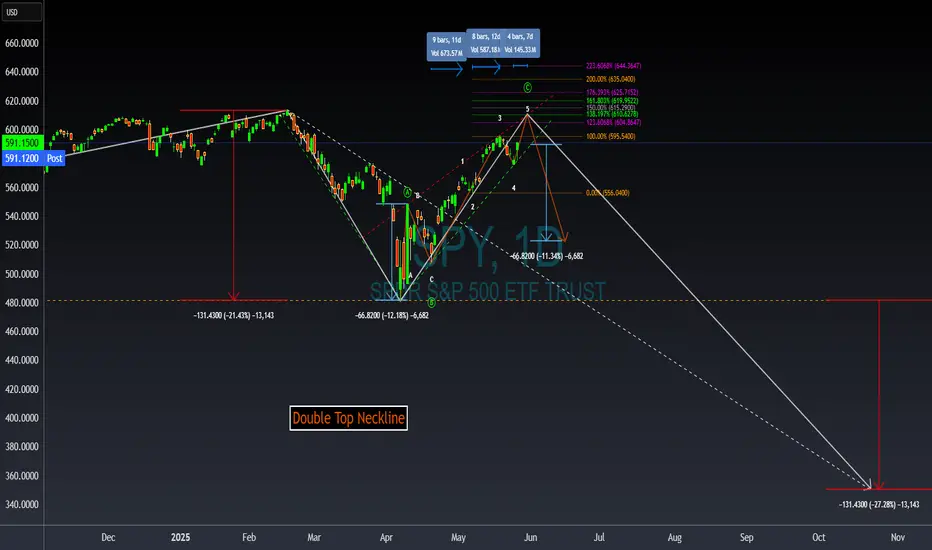
What began at the market bottom on 7 April, has remained bound in a channel. If the first pump up was an A followed by the declaration of the channel bottom as B, wave C has last over a month upward. We have wave 3 signals identifying wave 3 of C ending with the high on 19 May. Last week's dip was wave 4 and now we fly high this week. It is unclear if we actually make a new all-time high or fall just short. The below chart has 138.197% extension around 610.63. Inside wave C, my wave 1 was nine days long, and wave 3 was only 8. This points to wave 5 lasting less than 8 days. A common wave 1-3-5 duration in relation to wave 3 is around 114% for 1 and 50% for wave 5.
The height of the rising wedge covers 66.82 points. This same distance should provide the first target bottom once we exit the channel, possibly as early as next week. Once the bottom falls, we then examine the double top pattern. Although the neckline stretches far backwards, the bottom is established at the 7 April low. The distance from the neckline to the all-time high in February provides the next possible minimum target bottom by taking this 131.43 drop and subtracting it from the neckline of 481.80. This puts the initial low around 350.37 sometime later this year or early next.
There is a perfect storm of calamity brewing with zero resolutions in place or even planned. Do we finally drop or keep rising into the sun?
SPY/QQQ Plan Your Trade For 5-27-25 : Blank PatternToday's SPY Cycle Pattern is BLANK. This suggests the market will trend similarly to what we've seen over the past few days - likely melting upward.
A BLANK pattern is a price structure I have not identified as some type of price structure yet. I will check the data to see if I can find anything that correlates with this pattern throughout today.
Generally, we are rolling into a consolidation phase that may attempt to break higher or continue consolidating and roll downward.
Overall, the alignment with the Fibonacci trigger levels suggests the markets will continue to struggle near the ranges I've shown on my charts.
Gold and Silver are rolling downward - likely as a result of the EU tariff pause. That move to pause EU tariffs takes quite a bit of pressure off the metals markets.
I do believe the Gold/Silver will continue to try to rocket higher - but this week metals may stay somewhat flat and trend downward a bit.
BTCUSD is setting up a MASSIVE Excess Phase Peak pattern. This is a very big price rotation that could either INVALIDATE (upward) or CONFIRM (downward). If we get confirmation, BTCUSD could fall back below $75k very easily. If we get invalidation, the sky is the limit to the upside.
Ultimately, I believe the global markets need another 60-90+ days to settle with all the global trade/tariff and other issues before moving into a more bullish price trend.
We'll see if I'm right or not over the next 60-90+ days.
Get some.
#trading #research #investing #tradingalgos #tradingsignals #cycles #fibonacci #elliotwave #modelingsystems #stocks #bitcoin #btcusd #cryptos #spy #gold #nq #investing #trading #spytrading #spymarket #tradingmarket #stockmarket #silver

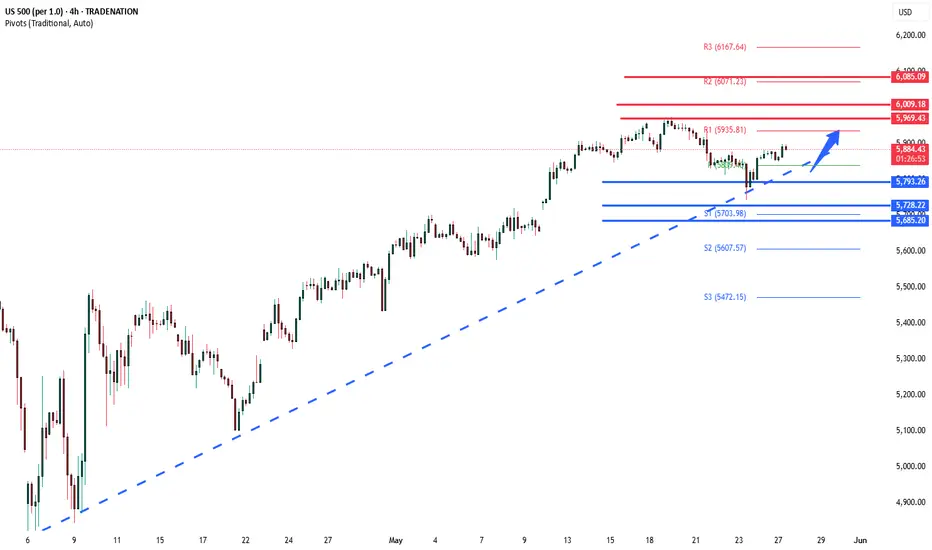
S&P INTRADAY uptrend consolidation supported at 5793US Equities poised for a post-holiday rebound, with futures up following Donald Trump's decision to delay EU tariff implementation until July 9. The temporary reprieve has improved short-term risk sentiment, with the EU seeking to fast-track trade talks focused on critical sectors—potentially bullish for industrials, autos, and tech exporters.
Geopolitical Risk Elevated
Western pressure on Russia is intensifying:
Germany's decision to allow Ukraine long-range strikes into Russian territory marks a notable escalation.
Trump signaled potential new sanctions against Russia and sharply criticized Putin, increasing global risk premiums.
This could fuel defense sector strength and lift energy stocks if geopolitical tension drives oil prices higher.
FX Pressure – USD Weakness Persists
The U.S. dollar remains under pressure, despite a slight intraday bounce. It has fallen over 7% YTD, hitting its lowest level since 2023 last Friday.
Speculative traders and hedge funds are building USD short positions.
Drivers of weakness: Trump’s tariff rhetoric, and concerns over the expanding U.S. fiscal deficit.
Trading Implications:
Risk-on tone favors growth stocks, tech, and cyclicals.
Multinationals may benefit from USD weakness, improving earnings translations.
Defense stocks (e.g., RTX, LMT) could gain from the escalation in Ukraine.
Watch for volatility as headlines shift around trade, tariffs, and Russia.
Key Support and Resistance Levels
Resistance Level 1: 5970
Resistance Level 2: 6010
Resistance Level 3: 6085
Support Level 1: 5793
Support Level 2: 5730
Support Level 3: 5685
This communication is for informational purposes only and should not be viewed as any form of recommendation as to a particular course of action or as investment advice. It is not intended as an offer or solicitation for the purchase or sale of any financial instrument or as an official confirmation of any transaction. Opinions, estimates and assumptions expressed herein are made as of the date of this communication and are subject to change without notice. This communication has been prepared based upon information, including market prices, data and other information, believed to be reliable; however, Trade Nation does not warrant its completeness or accuracy. All market prices and market data contained in or attached to this communication are indicative and subject to change without notice.
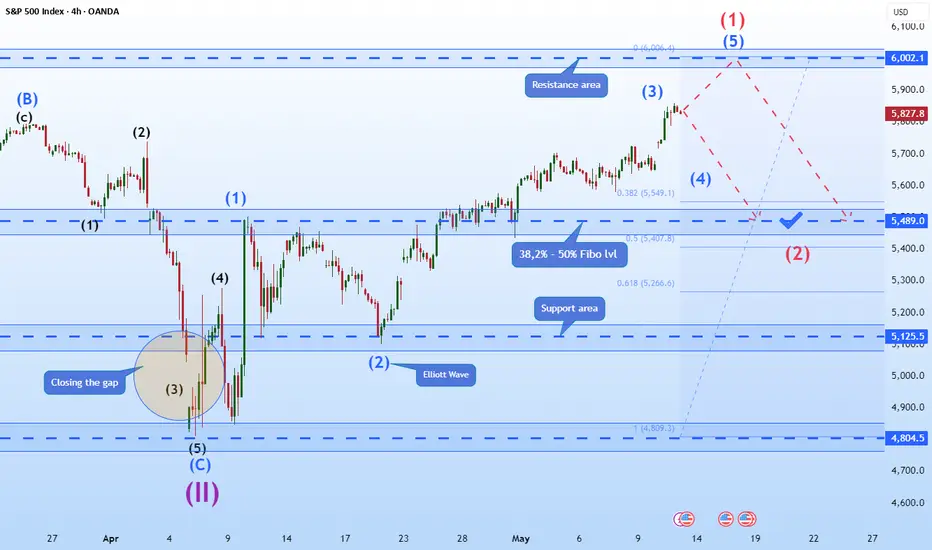
Hellena | SPX500 (4H): SHORT to 38.2% - 50% Fibo lvl 5489.Colleagues, I have reviewed the waves a bit and I believe that when the strong psychological level of 6000 is reached, a reaction and correction in wave “2” is possible.
I propose to consider this movement as a strong five-wave movement. Wave “1” will be over soon.
I consider the 38.2% - 50% Fibonacci levels of 5489 to be the main target of the correction.
Manage your capital correctly and competently! Only enter trades based on reliable patterns!
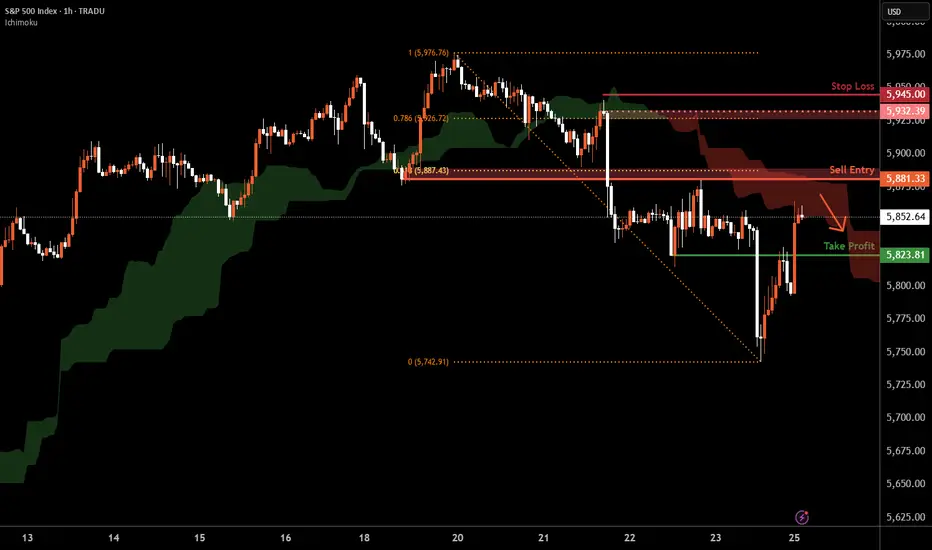
SPX500 H1 | Overlap resistance at 61.8% Fibonacci retracementSPX500 is rising towards an overlap resistance and could potentially reverse off this level to drop lower.
Sell entry is at 5,881.33 which is an overlap resistance that aligns close to the 61.8% Fibonacci retracement.
Stop loss is at 5,945.00 which is a level that sits above the 78.6% Fibonacci retracement and a swing-high resistance.
Take profit is at 5,823.81 which is an overlap support.
High Risk Investment Warning
Trading Forex/CFDs on margin carries a high level of risk and may not be suitable for all investors. Leverage can work against you.
Stratos Markets Limited (tradu.com ):
CFDs are complex instruments and come with a high risk of losing money rapidly due to leverage. 63% of retail investor accounts lose money when trading CFDs with this provider. You should consider whether you understand how CFDs work and whether you can afford to take the high risk of losing your money.
Stratos Europe Ltd (tradu.com ):
CFDs are complex instruments and come with a high risk of losing money rapidly due to leverage. 63% of retail investor accounts lose money when trading CFDs with this provider. You should consider whether you understand how CFDs work and whether you can afford to take the high risk of losing your money.
Stratos Global LLC (tradu.com ):
Losses can exceed deposits.
Please be advised that the information presented on TradingView is provided to Tradu (‘Company’, ‘we’) by a third-party provider (‘TFA Global Pte Ltd’). Please be reminded that you are solely responsible for the trading decisions on your account. There is a very high degree of risk involved in trading. Any information and/or content is intended entirely for research, educational and informational purposes only and does not constitute investment or consultation advice or investment strategy. The information is not tailored to the investment needs of any specific person and therefore does not involve a consideration of any of the investment objectives, financial situation or needs of any viewer that may receive it. Kindly also note that past performance is not a reliable indicator of future results. Actual results may differ materially from those anticipated in forward-looking or past performance statements. We assume no liability as to the accuracy or completeness of any of the information and/or content provided herein and the Company cannot be held responsible for any omission, mistake nor for any loss or damage including without limitation to any loss of profit which may arise from reliance on any information supplied by TFA Global Pte Ltd.
The speaker(s) is neither an employee, agent nor representative of Tradu and is therefore acting independently. The opinions given are their own, constitute general market commentary, and do not constitute the opinion or advice of Tradu or any form of personal or investment advice. Tradu neither endorses nor guarantees offerings of third-party speakers, nor is Tradu responsible for the content, veracity or opinions of third-party speakers, presenters or participants.
05-25-25 Risk Containment & Trading Strategy ExamplesSkilled Traders have learned to manage risk levels using techniques that allow them to preserve capital and move their assets towards future successful traders.
Some beginner traders get stuck trying to swing for the fences.
In this video, I try to share a common Fibonacci price/strategy technique where traders can attempt to limit risks while learning to identify efficient successful trade triggers.
Remember, taking a trade is the easy part. Protecting and growing your capital is much more difficult.
Please use the techniques in this video to learn how to protect and manage your capital.
Get some.
Happy Memorial Day.
#trading #research #investing #tradingalgos #tradingsignals #cycles #fibonacci #elliotwave #modelingsystems #stocks #bitcoin #btcusd #cryptos #spy #gold #nq #investing #trading #spytrading #spymarket #tradingmarket #stockmarket #silver
