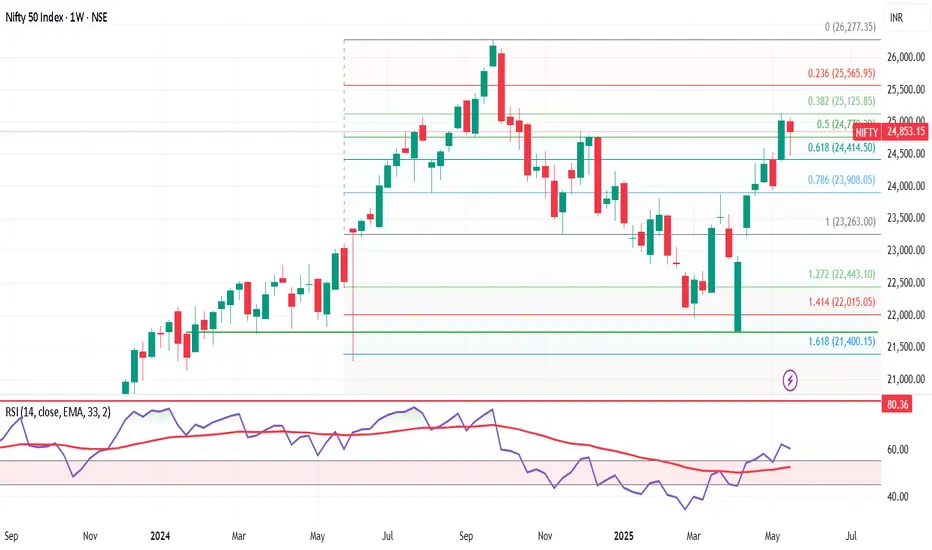
Weekly Market Wrap: Nifty & S&P 500 Outlook The Nifty closed the week at 24,853, down 166 points from the previous week's close. It traded within a range of 25,062 (high) and 24,462 (low) — perfectly aligning with our forecasted zone of 24,450 – 25,600. On the weekly chart, the index formed an inside candle pattern, signaling consolidation.
Positives: Despite the dip, Nifty continues to hold above the critical support level of 23,800, keeping the medium-term bullish structure intact.
Key Levels to Watch for Next Week:
High/Low to mark: 25,116 – 24,378
Breakout above 25,116 can lead to tests of 25,329 and 25,500 (resistance zones).
Breakdown below 24,378 could retest 23,800 and 23,600.
A weekly close below 23,800 could spell trouble for bulls, opening doors for deeper correction towards 22,800 and 22,100.
Trend Analysis:
Monthly Timeframe: Bearish
Daily Timeframe: Turned Bearish
Weekly Timeframe: Still Bullish
Conclusion: Stay cautious below 24,378 — volatility may rise if this level is breached.
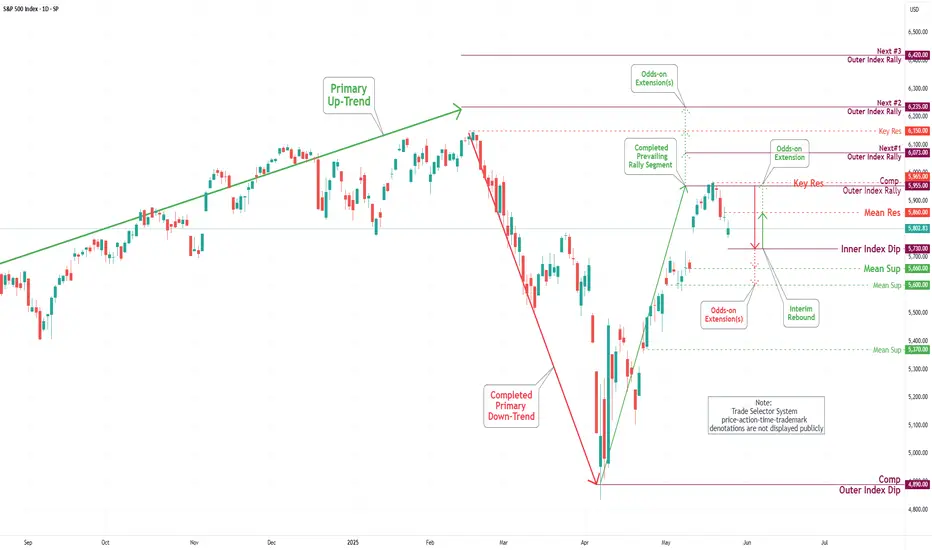
S&P 500 Weekly Snapshot:
The S&P 500 ended the week at 5,802, down 156 points. Once again, it faced stiff resistance around the 5,980 mark — a historically significant level where the index began its downward move in March 2025.
Geopolitical Impact: Markets remain jittery amid escalating global trade tensions and Trump’s tariff war, likely keeping volatility high over the next 2–3 weeks.
Key Support Zones:
Immediate support at 5,700
Close below 5,700 may trigger declines to 5,551, 5,458 (key Fibonacci support), and 5,392
Bullish Breakout Scenario:
Sustained close above 6,000 is required to resume bullish momentum
Upside targets: 6,013, 6,082, 6,147 (All-Time High), and potentially 6,225
Final Takeaway:
Both Nifty and S&P 500 are at critical junctures. With technical patterns pointing to mixed signals and geopolitical events adding fuel to volatility, traders should stay alert and focus on key breakout and breakdown levels.
S&P 500 (SPX500)
$SFM : Stock with no Tariff exposure and good momentumNASDAQ:SFM : We are revising this stock one more time in our blog series. Sprout Farmers Market NASDAQ:SFM is a retailer which sell high quality food with higher margin in good localities and the best part is the products are locally produced and sourced. This makes it immune to the tariff discussions ongoing in the market. Hence, we have seen relative strength in the $SFM. There are very few stocks in S&P 500 which are at or above the ATH. NASDAQ:SFM touched its ATH of 178 $ on 28th April amidst the tariff discussion. Currently @ 163 $ SFM has a RSI of 60 which is not in overbought territory.
In the chart below we plot the upward slopping regression channel and we see that the stock is currently sitting at the mid-point of this cannel and the 20 Day SMA is above the 50 Day, 100 Day and 200 Day SMA indicating positive momentum in the stock. The lower bound of the parallel channel is always above the 200 Day SMA indicating strong institutional long term holding capability. We like these kind of stocks which have great technical and good fundamentals with strong institutional holdings.
Verdict : Buy NASDAQ:SFM @ 150 $ and DCA @ 160 $. Year end target 200 $

ES1! "E-Mini S&P500" Index Market Bullish Robbery Plan🌟Hi! Hola! Ola! Bonjour! Hallo! Marhaba!🌟
Dear Money Makers & Robbers, 🤑 💰💸✈️
Based on 🔥Thief Trading style technical and fundamental analysis🔥, here is our master plan to heist the ES1! "E-Mini S&P500" Index Market. Please adhere to the strategy I've outlined in the chart, which emphasizes long entry. Our aim is to escape near the high-risk Red Zone Level. Risky level, overbought market, consolidation, trend reversal, trap at the level where traders and bearish robbers are stronger. 🏆💸"Take profit and treat yourself, traders. You deserve it!💪🏆🎉
Entry 📈 : "The heist is on! Wait for the MA line breakout (5830.00) then make your move - Bullish profits await!"
however I advise to Place Buy stop orders above the Moving average (or) Place buy limit orders within a 15 or 30 minute timeframe most recent or swing, low or high level for Pullback entries.
📌I strongly advise you to set an "alert (Alarm)" on your chart so you can see when the breakout entry occurs.
Stop Loss 🛑: "🔊 Yo, listen up! 🗣️ If you're lookin' to get in on a buy stop order, don't even think about settin' that stop loss till after the breakout 🚀. You feel me? Now, if you're smart, you'll place that stop loss where I told you to 📍, but if you're a rebel, you can put it wherever you like 🤪 - just don't say I didn't warn you ⚠️. You're playin' with fire 🔥, and it's your risk, not mine 👊."
📍 Thief SL placed at the recent/swing low level Using the 4H timeframe (5600.00) Day/Swing trade basis.
📍 SL is based on your risk of the trade, lot size and how many multiple orders you have to take.
🏴☠️Target 🎯: 6100.00 (or) Escape Before the Target.
🧲Scalpers, take note 👀 : only scalp on the Long side. If you have a lot of money, you can go straight away; if not, you can join swing traders and carry out the robbery plan. Use trailing SL to safeguard your money 💰.
💰💵💸ES1! "E-Mini S&P500" Index Market Heist (Swing Trade Plan) is currently experiencing a neutral trend there is high chance for bullishness,., driven by several key factors. .☝☝☝
⚠️Trading Alert : News Releases and Position Management 📰 🗞️ 🚫🚏
As a reminder, news releases can have a significant impact on market prices and volatility. To minimize potential losses and protect your running positions,
we recommend the following:
Avoid taking new trades during news releases
Use trailing stop-loss orders to protect your running positions and lock in profits
💖Supporting our robbery plan 💥Hit the Boost Button💥 will enable us to effortlessly make and steal money 💰💵. Boost the strength of our robbery team. Every day in this market make money with ease by using the Thief Trading Style.🏆💪🤝❤️🎉🚀
I'll see you soon with another heist plan, so stay tuned 🤑🐱👤🤗🤩

S&P 500 Daily Chart Analysis For Week of May 23, 2025Technical Analysis and Outlook:
The S&P 500 Index demonstrated a consistent downward trend during this week's trading session, reaching a significant target at the Mean Support level 5828. The index is currently trending lower, targeting the Inner Index Dip at 5730, with additional marks identified at the Mean Support levels of 5660 and 5600. Conversely, the index has the potential to rebound from its present position, advancing toward the Mean Resistance level of 5860 and retesting the previously completed Outer Index Rally at 5955.
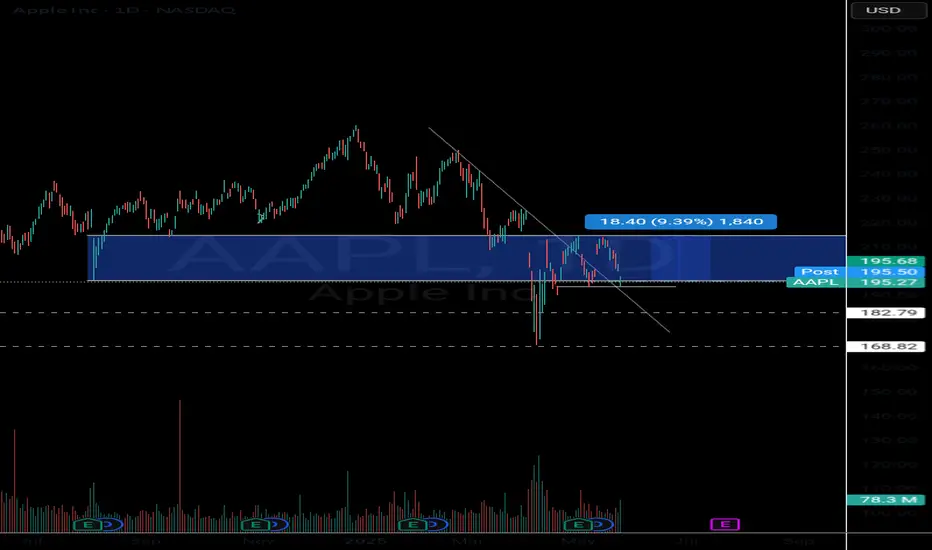
Apple losing $3Trillion clubNASDAQ:AAPL lost a fair amount of market share this week.
Coming under pressure from comments by Trump and tarrif news.
Apple seems to be a target for the president despite him answering a call on live TV today using an Iphone...kinda ironic.
Apple could easily chop in this 9% range before it makes a definitive move.
I lean more bullish since we're testing the lows of the trade range.
If Apple holds here it could be forming a right shoulder for a very bul,ish inverse head and shoulder pattern.
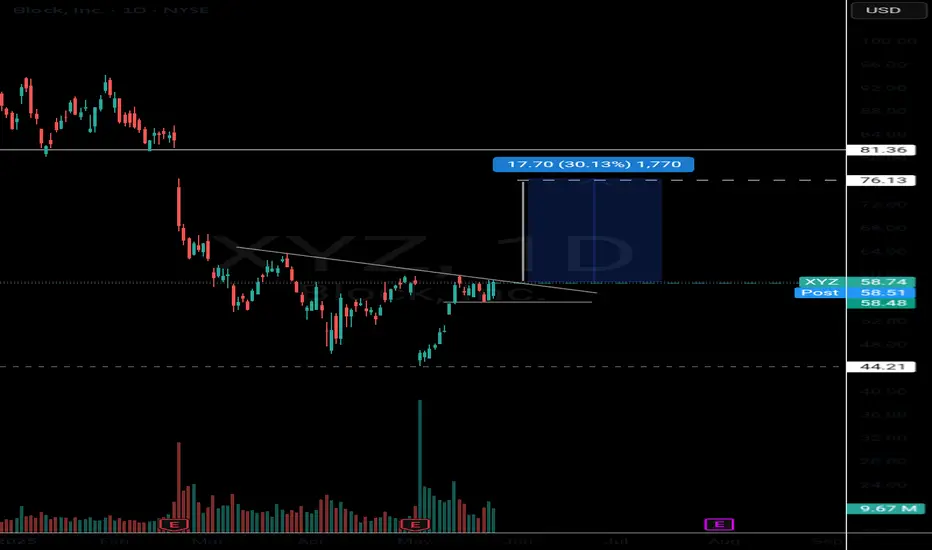
XYZ breakout imminent? Block NYSE:XYZ looks like it's getting ready to breakout.
It was impressive to see this stock holding relative strength today as the markets were under pressure and selling off.
The OANDA:SPX500USD & NASDAQ:QQQ sold off and this stock closed green.
2 bullish patterns can be observed on the daily chart. A bull flag and and inverse head and shoulders.
The major indices broke key ranges to the downside and this stock has traded in a tight range.
SPY/QQQ Plan Your Trade EOD Update : Memorial Weekend RisksThis EOD update is to help you try to position for the risks associated with a further breakdown in price trends over the lone Memorial Day weekend.
I know this video will be posted late in the day - but I want you to learn how to hedge against risks and try to learn to take your profits when they are THERE.
This is a really quick video.
Stay safe this weekend and thank you to all our VETS for your service and sacrifices.
We honor you this weekend.
GET SOME.
#trading #research #investing #tradingalgos #tradingsignals #cycles #fibonacci #elliotwave #modelingsystems #stocks #bitcoin #btcusd #cryptos #spy #gold #nq #investing #trading #spytrading #spymarket #tradingmarket #stockmarket #silver

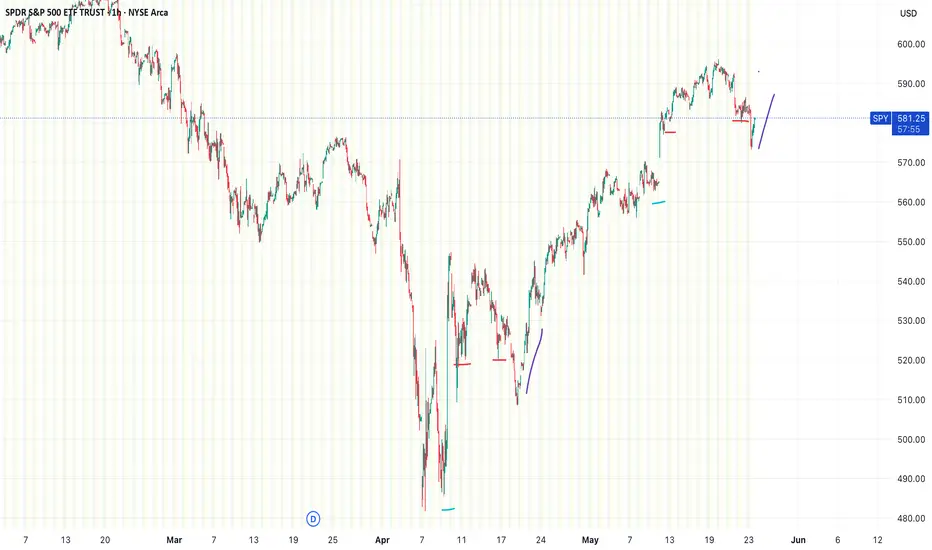
Repeat of Late Apr-May lows & rallyThe chart shows the SPDR S&P 500 ETF Trust (SPY) on a 1-hour timeframe, with a pattern appearing to be repeating itself from late April/May(Liberation day announcements) dip and then boot and rally from trade announcements, all marked by colored lines.
The colored lines (blue, red, purple) highlight a recurring price action setup. Each set of lines seems to mark a sequence of movements:
Blue: Sharp drop, then gap up
Red: Consolidation at a lower higher from gap up, return to high, consolidation back lower at previous lower high
Purple: Breakout & reversal upward.
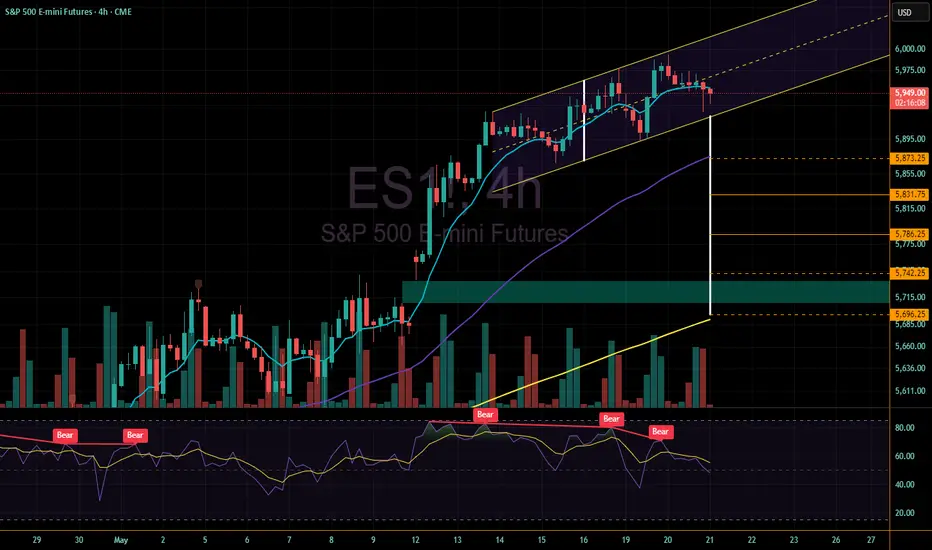
CME Gap Aligns with 4h 200 EMAThe CME Gap around 5710-5730 is beginning to align with the 4h 200 EMA.
4h RSI has been diverging bearish 3 times with each leg up within the channel above.
Also, a breakdown of that channel has measured moves down that align with both the 4h 50 and 200 EMA:
- 50 EMA an 0.5x measured move down
- 200 EMA a 2.5x measured move down
Pre-req on targeting the gap is a breakdown of the parallel channel shown above, and then loss of the 4h 50 EMA.
Good luck!
SPY/QQQ Plan Your Trade for 5-23 : Carryover PatternLooking at the charts today, I want to say that it certainly looks like the SPY Cycle Patterns are blending into a consolidated CRUSH/BOTTOM pattern (see the weekend patterns) today and possibly "carrying over" into the early trading next week.
I have been warning of a pending rollover/breakdown in this uptrend for weeks. Today's breakdown seems a bit aggressive, but it is what it is.
If the patterns are consolidating/blending into a bigger breakdown over the Memorial Day weekend, then we could be looking at a very big downward/rotational move in the SPY/QQQ/Bitcoin over the next 5+ trading days while Gold/Silver continue to rally.
Silver is lagging Gold right now, but I don't think that lasts. Once Gold gets back above $3400, I believe Silver will start to make a big move higher.
The big question in my mind is - how does this carry into Monday's holiday trading schedule and into Tuesday's OPEN?
I'll have to see how things play out today - but it certainly looks like I'll be adding some SPREADS to potentially catch any big move over this weekend.
GET SOME.
This could play out exceptionally well for skilled traders.
#trading #research #investing #tradingalgos #tradingsignals #cycles #fibonacci #elliotwave #modelingsystems #stocks #bitcoin #btcusd #cryptos #spy #gold #nq #investing #trading #spytrading #spymarket #tradingmarket #stockmarket #silver

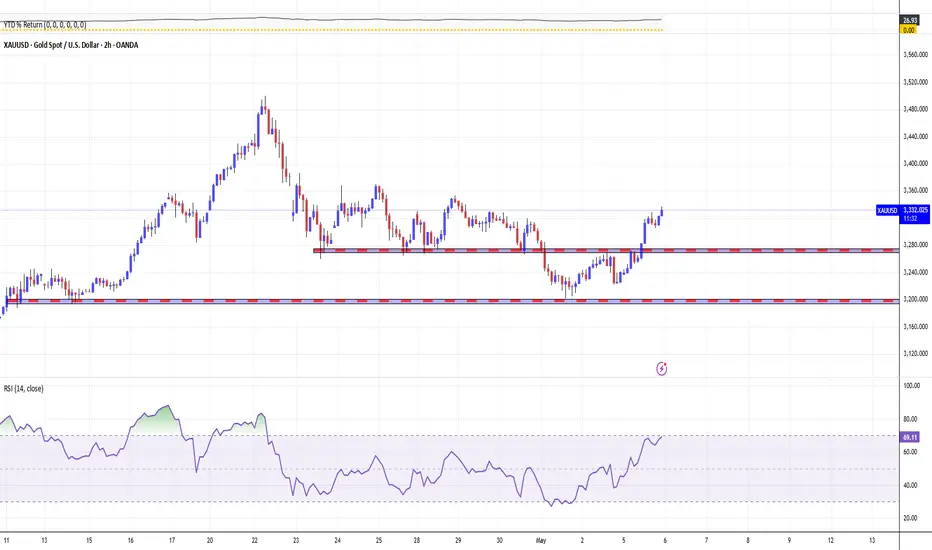
GOLD Regains Above 3'300, since US stocks "Relief Rally" is OverGold prices recently surged above $3,300 per ounce due to a confluence of geopolitical, economic, and monetary factors driving strong safe-haven demand:
Heightened geopolitical tensions, particularly the Israel-Hamas conflict and ongoing US-China trade disputes, have increased uncertainty, prompting investors to seek Gold as a secure store of value amid instability.
The US dollar's weakness, nearing a three-year low, has further boosted gold's appeal for holders of other currencies, making Gold relatively cheaper and more attractive globally.
What is most important also, U.S. stock rally has overed recently its tedious 10-Day winning strike (fortunately which finished not at all the history peaks). That's why investors may be turning back to tried-and-true assets like Gold.
Central banks, notably China’s, have been consistently buying gold to diversify reserves away from the US dollar, supporting prices significantly. China increased its Gold reserves for the 17th consecutive month, signaling sustained institutional demand.
Additionally, gold-backed exchange-traded funds (ETFs) have seen record inflows, reflecting growing investor interest beyond traditional buyers.
Market expectations of Federal Reserve interest rate cuts later in 2025 have also played a key role. Lower interest rates reduce the opportunity cost of holding non-yielding gold, enhancing its investment appeal amid inflation concerns and economic growth uncertainties.
This combination of geopolitical risk, a weaker dollar, central bank purchases, and anticipated monetary easing has propelled gold prices to historic highs, with forecasts suggesting further gains toward $3,500 per ounce.
--
Best #GODL wishes,
@PandorraResearch Team 😎
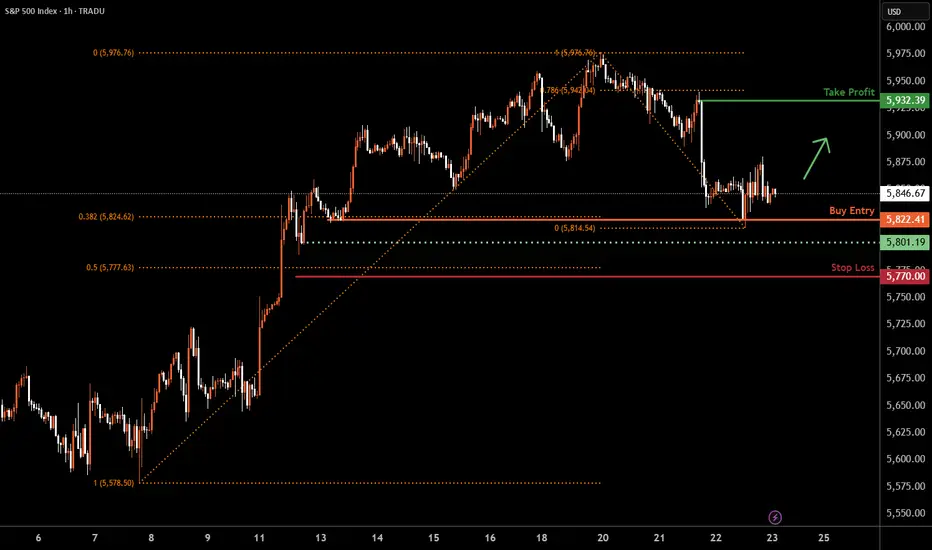
SPX500 H1 | Multi-swing-low support at 38.2% Fib retracementSPX500 is falling towards a multi-swing-low support and could potentially bounce off this level to climb higher.
Buy entry is at 5,822.41 which is a multi-swing-low support that aligns with the 38.2% Fibonacci retracement.
Stop loss is at 5,770.00 which is a level that lies underneath a swing-low support and the 50.0% Fibonacci retracement.
Take profit is at 5,932.39 which is a swing-high resistance that aligns close to the 78.6% Fibonacci retracement.
High Risk Investment Warning
Trading Forex/CFDs on margin carries a high level of risk and may not be suitable for all investors. Leverage can work against you.
Stratos Markets Limited (tradu.com ):
CFDs are complex instruments and come with a high risk of losing money rapidly due to leverage. 63% of retail investor accounts lose money when trading CFDs with this provider. You should consider whether you understand how CFDs work and whether you can afford to take the high risk of losing your money.
Stratos Europe Ltd (tradu.com ):
CFDs are complex instruments and come with a high risk of losing money rapidly due to leverage. 63% of retail investor accounts lose money when trading CFDs with this provider. You should consider whether you understand how CFDs work and whether you can afford to take the high risk of losing your money.
Stratos Global LLC (tradu.com ):
Losses can exceed deposits.
Please be advised that the information presented on TradingView is provided to Tradu (‘Company’, ‘we’) by a third-party provider (‘TFA Global Pte Ltd’). Please be reminded that you are solely responsible for the trading decisions on your account. There is a very high degree of risk involved in trading. Any information and/or content is intended entirely for research, educational and informational purposes only and does not constitute investment or consultation advice or investment strategy. The information is not tailored to the investment needs of any specific person and therefore does not involve a consideration of any of the investment objectives, financial situation or needs of any viewer that may receive it. Kindly also note that past performance is not a reliable indicator of future results. Actual results may differ materially from those anticipated in forward-looking or past performance statements. We assume no liability as to the accuracy or completeness of any of the information and/or content provided herein and the Company cannot be held responsible for any omission, mistake nor for any loss or damage including without limitation to any loss of profit which may arise from reliance on any information supplied by TFA Global Pte Ltd.
The speaker(s) is neither an employee, agent nor representative of Tradu and is therefore acting independently. The opinions given are their own, constitute general market commentary, and do not constitute the opinion or advice of Tradu or any form of personal or investment advice. Tradu neither endorses nor guarantees offerings of third-party speakers, nor is Tradu responsible for the content, veracity or opinions of third-party speakers, presenters or participants.
S&P 500: Consolidating & forming bull flag on support trendlineSo, we all know that the market is taking a breather, and the past week has been mostly flat (kind of). There have been plenty of headlines, some good, some bad. Most notably, the news about the Moody's US credit downgrade. I woke up one morning, took a look at LinkedIn and saw all the CFA-certified investing experts expecting a massive game-changing moment, potentially a market crash.
Except, the market hasn't responded so negatively. In fact, I'd say that while long-term yields have been rising, the market has been doing its own thing .
For instance, taking a look at the daily chart of the S&P 500 paints a different picture of the doom and gloom that I've been hearing ALL weekend and ALL week long. As you can see, the index is currently sitting on the daily support trendline which goes back to the 7th April low.
On that trendline, taking a closer look, it seems the flat price action has been forming a bull flag. It's quite narrow and tight. But it certainly is a fine-looking bull flag. And a break above that would take the S&P 500 even higher.
This would also likely have a positive effect on other indices. Furthermore, it might be worth keeping an eye on the big S&P 500 stocks that are high-beta and like to follow the market.
So, to my point about how the market has been doing its own thing...seems that the Moody's downgrade could have possibly been already priced-in. I could be wrong, of course, as markets are still quite volatile and fragile to any sort of macro and global developments about trade and conflicts around the world.
Thank you for reading.
Note: not financial advice

This Guy has arrows down to 4400My last market update ended up receiving a comment from a Trading View user that seemingly was mocking the fact that my shorter-term chart posted in an update to my followers had directional arrows down to the approximate area of ES 4400.
Here's my longer-term expectations. If some didn't like 4400, I suspect they will equally dislike sub-ES 1,000.
Best to all.
Chris

SPY/QQQ Plan Your Trade For 5-22 : Inside Breakaway CountertrendToday's Inside Breakaway in Countertrend mode suggests the markets may attempt to move downward - away from the recent highs.
I believe the SPY/QQQ will move into a sideways/consolidation range over the next 3-5+ trading days before attempting to make any big moves. We have a holiday-shortened trading week next week, and I believe the markets are moving into the Summer doldrums.
Overall, I would ask traders to stay cautious of this transition in the markets over the next 5--10+ days and prepare for volatility to increase after June 1st.
You all know what I believe is the most likely outcome - a rollover topping pattern followed by a breakdown in price targeting the 525-535 level on the SPY. We'll see what happens going forward.
Gold and Silver pullback back overnight which suggests the metals markets were a bit overheated to the upside. I still believe Metals will continue to push higher.
BTCUSD is trading up above $111k. Here we go.
BTCUSD is moving up into the potential rejection level that I suggested in my 5-20 video as a MASSIVE WARNING setup.
This is where we'll see how BTCUSD plays out - if we continue to push higher or if we REJECT and move into a broad downtrend.
I didn't expect it to happen only TWO DAYS after my video - but here we are.
Time to get muddy and play what price puts in front of us.
Get some.
#trading #research #investing #tradingalgos #tradingsignals #cycles #fibonacci #elliotwave #modelingsystems #stocks #bitcoin #btcusd #cryptos #spy #gold #nq #investing #trading #spytrading #spymarket #tradingmarket #stockmarket #silver

S&P ES Long setup target 5963.50 / Calls SPY target 596Fibonacci technical analysis : S&P 500 E-mini Futures CME_MINI:ES1! has already found support at the Fib level 78.6% (5623.50) of my Down Fib. Last Daily candle (May 2) has closed above retracement Fib level 78.6%. My Down Fib guides me to look for CME_MINI:ES1! to eventually go up to hit first target at Fib level 127.2% (5963.50).
CME_MINI:ES1! – Target 1 at 127.2% (5963.50), Target 2 at 161.8% (6205.50) and Target 3 at 178.6 (6322.75)
Stop loss slightly below the 61.8% retracement Fib level (5506.25).
Option Traders : My AMEX:SPY chart Down Fib shows price to go up to Target 1 at 127.2% (595.82), Target 2 at 161.8% (620.50) and Target 3 at 178.6 (632.50)
Stop loss slightly below the 61.8% retracement Fib level (549).
Enjoy the trading process and take time to smell the roses🌹

Spx500usdThere u go by decimals, almost there,
Here you go, it might be in bull today, I just hope so
Keep Ur own trades safe guy and DYOR
Do always Your Own Reseach
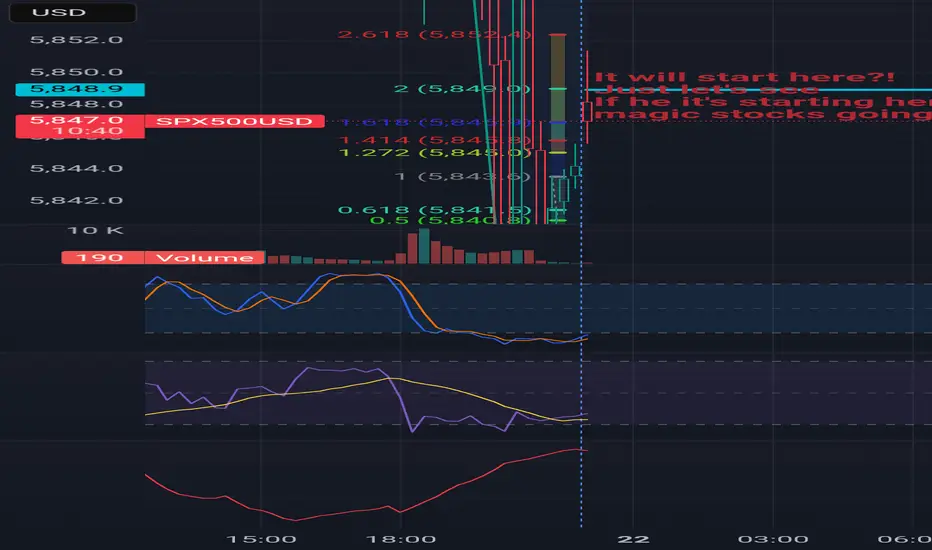
Spx500usd up? 1min chart at 23h London time?As it is , all I hope is that spx 500usd starts here at that blue line, after all, if it starts at the blue line the stock as might be up again, I'm not into the fundamentals by this time, I'm just making some Elliot and indicators-some mine, others don't, and trend analysis
Hope u guys all in profit
After all we all looking for the same
Keep Ur trades safe
And Do Always Your Own Research
DAYOR
Keep it safe
This my my graph at 1min candles, returned to 15min chart
Keep it safe.
And keep cool.

Is minor B done?In my last post…” We Have a Full Pattern into The Target Box” … I stated, “I am now looking for a 5-wave pattern to develop to the downside, followed by a 3-wave retrace, that in the coming weeks can take us back out of the target box to the downside.”
That pattern may have begun today in the very micro sense. This is very preliminary, so we need follow through to the downside so that in the days and weeks to come, we can confirm a top in minor B.

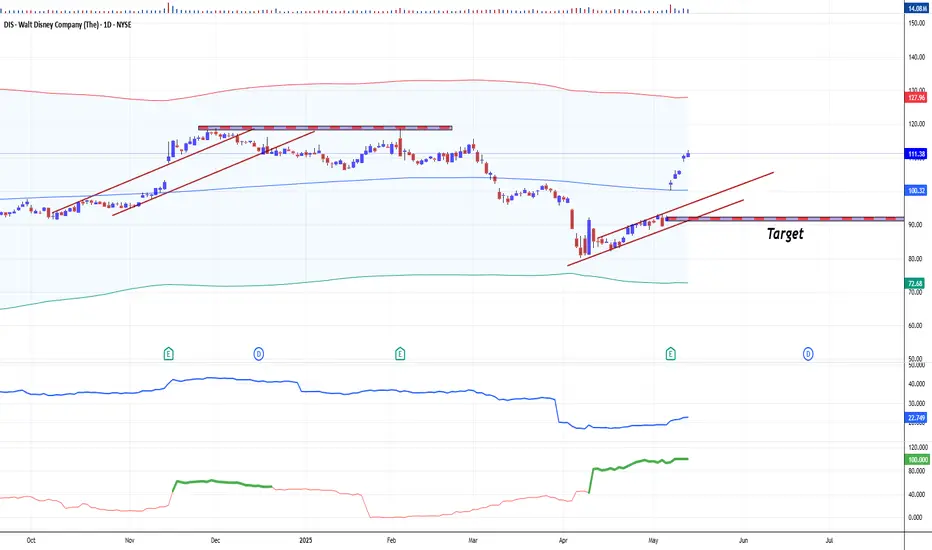
The Walt Disney Stock Future Goes 'Shining Bright as Never'The Walt Disney Company’s stock (DIS) has demonstrated robust performance following its Q2 2025 earnings release a week ago, with both fundamental and technical indicators reflecting positive momentum.
Here’s a detailed analysis:
Fundamental Perspective
Disney’s Q2 2025 results exceeded expectations, driven by strong execution across its entertainment, streaming, and experiences segments. Key financial highlights include:
Revenue Growth. Revenues rose 7% year-over-year (YoY) to $23.6 billion, surpassing estimates of $23.14 billion.
Profitability Surge. Adjusted EPS jumped 20% YoY to $1.45, beating forecasts of $1.20. Net income swung to $3.3 billion from a $20 million loss in Q2 2024.
Streaming Strength. Disney+ added 1.4 million subscribers (reaching 126 million globally), defying expectations of a decline. Combined Disney+ and Hulu streaming operations generated $336 million in profit, a sevenfold increase from $47 million YoY.
Guidance Upgrade. Disney raised its fiscal 2025 adjusted EPS forecast to $5.75 (up 16% YoY), citing confidence in double-digit operating income growth for entertainment and sports, and 6%-8% growth for experiences.
Growth Drivers:
Entertainment. Segment operating income rose $0.5 billion YoY to $1.3 billion, fueled by streaming profitability and box office success (e.g., Moana 2).
Experiences. Theme parks and consumer products saw higher attendance, guest spending, and cruise demand, though international parks faced headwinds in Shanghai and Hong Kong.
Strategic Initiatives. The upcoming Abu Dhabi theme park and ESPN’s direct-to-consumer launch are expected to drive long-term growth.
Technical Perspective
Disney’s stock firstly reacted positive to the earnings beat, reflecting renewed investor confidence:
Price Action. Shares surged 10-12% post-earnings, hitting an intraday high of $103.31. Over the past month, DIS gained 31%, including a 20% rally in five days.
Valuation. The stock trades at 18.4x forward earnings and 2.1x sales, a premium to industry averages but below its historical norms.
Analyst Sentiment. The average price target stands at $126.50 (14% upside), with a Street-high target of $148 (33% upside).
Technical Indicators:
Momentum. The breakout above key resistance levels (e.g., $100) signals bullish sentiment, supported by high trading volume.
Volatility. Beta of 1.01 aligns with market volatility, while short interest remains low at 1.24% of float.
Risks and Considerations
Macroeconomic Uncertainty. Disney acknowledged potential impacts from tariffs and global economic conditions.
Valuation Premium. While growth prospects justify some premium, prolonged macroeconomic stress could pressure multiples.
Investors challenge
Disney’s Q2 2025 results underscore its ability to execute on streaming monetization, theme park innovation, and content-driven growth.
Fundamentally, raised guidance and streaming profitability signal a turnaround, while technically, the stock’s breakout suggests locally bullish momentum.
Following historical patterns we are Bearishly tuned at this time, with targets to fill the gap at $92.17 per share (left after Earnings report), and drilling all the way below.
--
Best wishes,
@PandorraResearch Team
SPY/QQQ Plan Your Trade For 5-21 : Inside-BreakawayI've been very clear over the past few weeks that I believe the markets are poised for a rollover/topping pattern and I believe BTCUSD is showing us exactly how/when that rollover top is going to play out (June 1-June 9).
In the meantime, I believe the SPY/QQQ are entering a more volatile "early topping" formation while still in an uptrend (Bullish).
I urge traders to start watching various sectors for weakness and keeping your eyes open for any signs the market could be moving into a sideways price rotation.
I think the rollover top will be aligned with some financial event (trade/tariff/other) that will result in a broad disruption of the US/Global markets. And I believe BTCUSD will lead the move by about 4-7+ days.
Gold and Silver are starting to move higher again. That is a sure sign that traders are now more actively seeking to hedge global risks (again).
I believe this move higher in metals may continue through this week and into next week (looking for that top in the SPY/QQQ).
Follow my detailed BTCUSD video to learn why BTCUSD may continue to try to push a bit higher before topping and moving into a broad price decline.
Get some..
#trading #research #investing #tradingalgos #tradingsignals #cycles #fibonacci #elliotwave #modelingsystems #stocks #bitcoin #btcusd #cryptos #spy #gold #nq #investing #trading #spytrading #spymarket #tradingmarket #stockmarket #silver

05/20/25 Trade Journal, and Where is the Stock Market going tomoEOD accountability report: +293.75
Sleep: 4.5 hours , Overall health: Calm and tired. need to catch up on sleep.
What was my initial plan?
Market structure was bearish so, I started the day shorting, but once market flipped bullish, I switched to BTD mode.
Daily Trade recap based on VX Algo System
— 9:00 AM Market Structure flipped bearish on VX Algo X3!
— 10:20 AM VXAlgo NQ X1 Buy Signal
— 11:18 AM Market Structure flipped bullish on VX Algo X3!
— 12:30 PM Market Structure flipped bearish on VX Algo X3!
— 1:20 PM VXAlgo NQ X1 Sell Signal
— 3:13 PM VXAlgo ES X1 Buy signal 2x signal (C+ set up)
Next day plan--> Above 5900 = Bullish, if we lose 48min support at 5900--> 5800 next
Video Recaps -->https://tradingview.sweetlogin.com/u/WallSt007/#published-charts

5-20-25 WARNING : Bitcoin Sets Up MASSIVE Double-Top WarningI highlighted this incredible price/technical pattern in my morning Plan Your Trade video. But, I thought it was important enough to create a separate video highlighting this incredible Double-Top warning and to try to tell all of my followers to start actively protecting capital over the next 2-3+ weeks.
As much as I would like to say this won't happen (meaning some type of crisis event or global financial crisis) causing a collapse in Bitcoin (and the US/Global markets) - but I believe the continued constraints on the global markets, related to Trump's policies and attempts to reduce US govt spending) will act as a devaluation event for global economies.
Think about it for a minute...
1. If the US is able to remove $500-900 Billion in fraud/waste/NGO spending (of which, a portion of that spending is dedicated to supporting global initiatives/spending), this will result in a contraction (in some form) for some global economies.
2. If the US is able to negotiate more favorable tariff rates for US goods supplied to the world (where foreign nations reduce or eliminate tariffs on US goods), this will also act as a reduction in economic income for many foreign nations.
3. These combined and continued efforts to restructure the US economy into a strong and more dynamic global economic driver (more fairly balanced in terms of global trade) will come at the expense of breaking away from what has traditionally been untouched.
This breaking of the past, in terms of what nations expected related to US spending and tariffs on US Goods, may represent a 15-25% (or more) contraction in foreign economic activity.
If this disruption from "what was normal" results in the US Fed, or global central banks, taking emergency measures to address short-falls in their economies, this could prompt a series of events that could result in a broad devaluation type of event (very similar to what happened after COVID in 2022-2023).
That event was prompted by the US Fed raising rates trying to stop inflation. This event could be the result of slower/lower economic outputs/expectations related to the changing tariff rates and the reduction in US spending throughout the world. Central Banks and regional governments may attempt to provide some type of capital stimulus to transition through this phase - but I see that as "building a bigger bubble - just waiting to pop".
The smart move for global central banks is to follow the US's lead and start to move towards more austerity/accountability regarding their own economies/spending and attempt to let the devaluation price phase play out.
Either way, time will tell if I'm correct or not.
You have been warned. IMO, you have about 3-6 weeks before BTCUSD potentially tops and may roll into a very strong breakdown phase.
Get Some.
#trading #research #investing #tradingalgos #tradingsignals #cycles #fibonacci #elliotwave #modelingsystems #stocks #bitcoin #btcusd #cryptos #spy #gold #nq #investing #trading #spytrading #spymarket #tradingmarket #stockmarket #silver
