S&P500 bullish ahead of US employment- NFP numbersHouse Republicans moved Trump’s major tax and spending bill closer to a final vote, which could happen before his July 4 deadline. The package includes tax cuts, immigration funding, and the rollback of green energy incentives. Gamblers are raising concerns about a tax increase in the bill that could affect them.
In trade news, the US eased export rules on chip design software to China as part of an ongoing deal. China’s tone has shifted more positively, with a top official saying he’s hopeful about US-China relations and that conflict between the two is “unimaginable.”
At the Fed, Chair Jerome Powell hasn’t said if he’ll step down when his term ends in May, adding uncertainty. Trump, who wants a loyal replacement, has called for his resignation after a federal agency accused Powell of giving misleading testimony about expensive Fed building renovations.
On Wall Street, value investing made a comeback last quarter. Over 60% of active value fund managers beat their benchmarks by buying cheap industrial stocks and avoiding underperforming sectors like utilities and consumer staples.
Conclusion:
US equities are steady but cautious. Uncertainty around Fed leadership and Trump’s economic plans is keeping markets in check, while improving US-China trade relations and a shift toward value stocks are offering support.
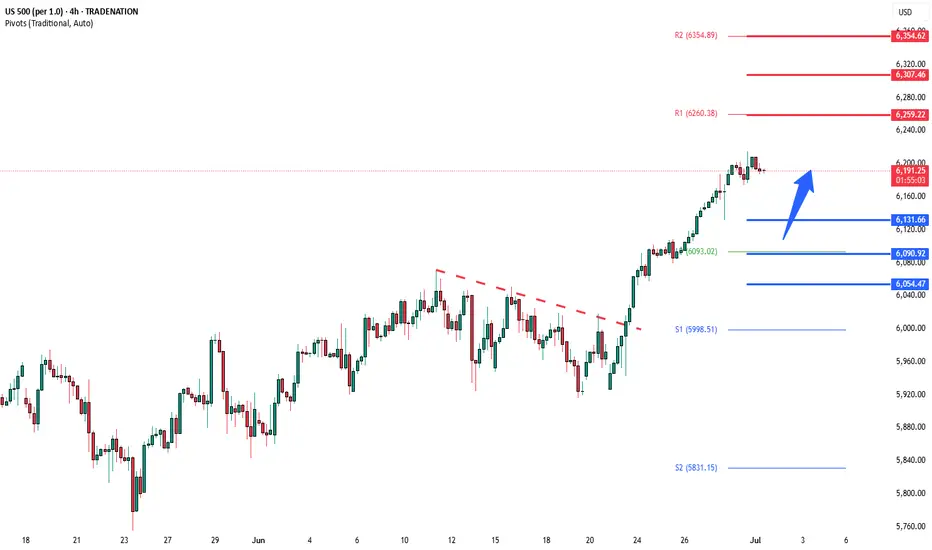
Key Support and Resistance Levels
Resistance Level 1: 6260
Resistance Level 2: 6307
Resistance Level 3: 6355
Support Level 1: 6130
Support Level 2: 6090
Support Level 3: 6055
This communication is for informational purposes only and should not be viewed as any form of recommendation as to a particular course of action or as investment advice. It is not intended as an offer or solicitation for the purchase or sale of any financial instrument or as an official confirmation of any transaction. Opinions, estimates and assumptions expressed herein are made as of the date of this communication and are subject to change without notice. This communication has been prepared based upon information, including market prices, data and other information, believed to be reliable; however, Trade Nation does not warrant its completeness or accuracy. All market prices and market data contained in or attached to this communication are indicative and subject to change without notice.
S&P 500 (SPX500)
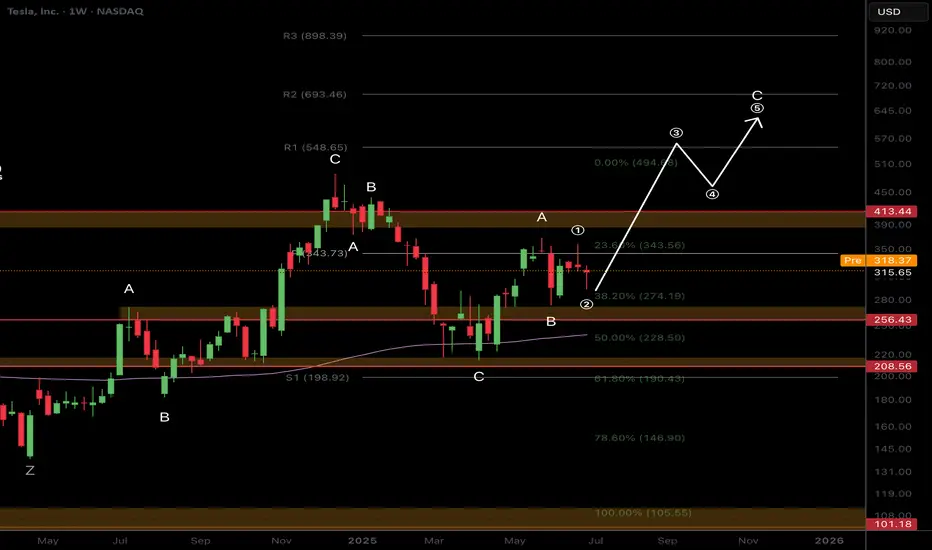
$TSLA Time to Fade or..?NASDAQ:TSLA (like NASDAQ:GOOG ) is standing out to me as bullish, yet, corrective Elliot Waves a higher degree series of ABCs appear to be underway.
A final wave C appears to be underway which would take price too all time highs in an expanded flat correction pattern. My count could be wrong and the interference could be from the increase it sentiment volatility connected to the US headlines lately and Trump posting on socials. Things may get back to normal after the summer and a clearer pattern may emerge.
Price is struggling to get past the weekly pivot point bullishly or the weekly 200EMS bearishly and is trapped within that range.
For now long term target is the R2 daily pivot at $693 as the higher probability is continued upside
Safe trading
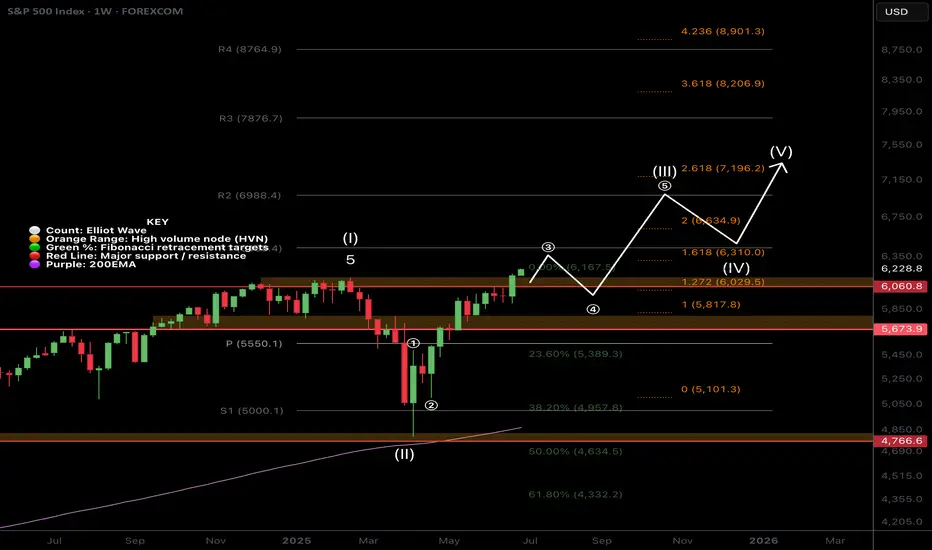
$SPX500 Most Hated Rally to Continue?FOREXCOM:SPX500 continues into price discovery suggesting a wave (3) is still underway but nearing a its minimum target of the 1.618 Fibonacci extension target $6310. Overextension of this target will demonstrate an even stronger bullish outlook.
Long term terminal targets remains above $7000 for me.
A short term pull back is a high probability but markets can stay irrational longer than participants can stay liquid.
Safe trading
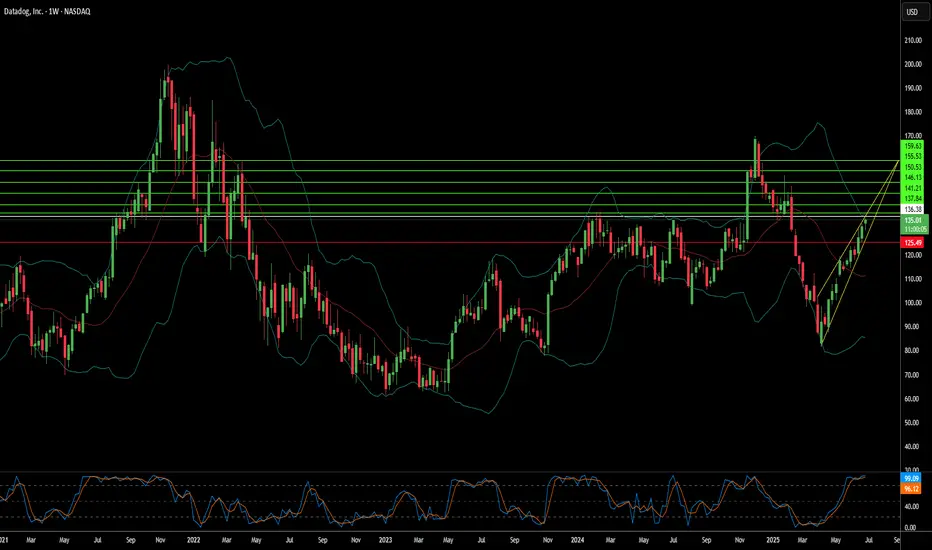
Datadog's S&P 500 Entry: A New Tech Paradigm?Datadog (DDOG), a leading cloud observability platform, recently marked a significant milestone with its inclusion in the S&P 500 index. This pivotal announcement, made on July 2, 2025, confirmed Datadog's replacement of Juniper Networks (JNPR), effective before the opening of trading on Wednesday, July 9. The unscheduled change followed Hewlett-Packard Enterprise Co.'s (HPE) completion of its acquisition of Juniper Networks on the same day. The market reacted robustly, with Datadog shares surging by approximately 9.40% in extended trading following the news, reaching a five-month high and underscoring the anticipated "index effect" from passive fund inflows. Datadog's market capitalization, approximately $46.63 billion as of July 2, 2025, significantly exceeded the updated S&P 500 minimum threshold of $22.7 billion, effective July 1, 2025.
Datadog's financial performance further solidifies its position. The company reported $762 million in revenue and $24.6 million in GAAP net income for the first quarter of 2025. For the full year 2024, Datadog generated $2.68 billion in revenue. While the document suggested a cloud observability market valued at "over $10 billion," independent verification from sources like Mordor Intelligence indicates the "observability platform market" was valued at approximately $2.9 billion in 2025, projected to grow at a Compound Annual Growth Rate (CAGR) of 15.9% to reach $6.1 billion by 2030. Other analyses, like Market Research Future, project the "Full-Stack Observability Services Market" to be $8.56 billion in 2025 with a higher CAGR of 22.37% through 2034, highlighting varying market definitions. Datadog operates within a competitive landscape, facing rivals such as Elastic and cloud giants like Amazon and Microsoft, alongside Cisco, which completed its acquisition of Splunk on March 18, 2024.
The S&P committee's decision to include Datadog, despite other companies like AppLovin boasting a higher market capitalization of $114.65 billion (as of July 2, 2025), underscores a strategic preference for foundational enterprise technology addressing critical infrastructure needs. This move signals an evolving S&P 500 that increasingly reflects software-defined infrastructure management and analytics as a core economic driver, moving beyond traditional hardware or consumer-facing software. While Workday's inclusion was cited as occurring in 2012 in the original document, it was added to the S&P 500 effective December 23, 2024, preceding its significant growth in the enterprise SaaS sector. Datadog's ascension thus serves as a powerful signal of the technological segments achieving critical mass and institutional validation, guiding future investment and strategic planning in the enterprise technology landscape.
SPY/QQQ Plan Your Trade For 7-1 : Post Market UpdateToday was a very powerful day for the Cycle Patterns - particularly for Gold and BTCUSD.
Gold rallied as the Cycle Pattern predicted a RALLY in TREND mode.
BTCUSD collapsed on a CRUSH Cycle Pattern.
The SPY Cycle Pattern predicted a Gap Reversal pattern. We did see the Gap today and a moderate reversal in price. But the SPY, as usual, continued to try to melt upward.
I highlighted a very interesting TWINNING pattern in Bitcoin in this video. Pay attention.
Get some.
#trading #research #investing #tradingalgos #tradingsignals #cycles #fibonacci #elliotwave #modelingsystems #stocks #bitcoin #btcusd #cryptos #spy #gold #nq #investing #trading #spytrading #spymarket #tradingmarket #stockmarket #silver

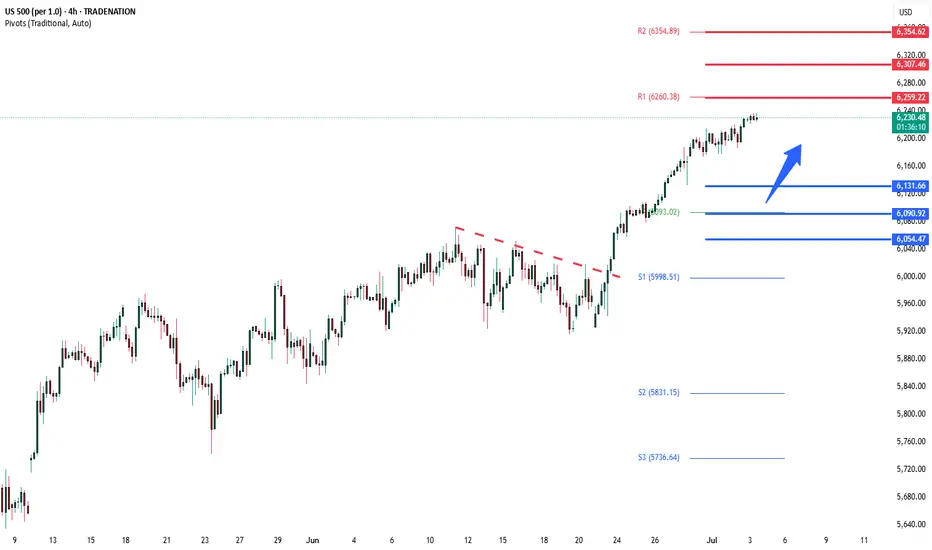
S&P500 key trading level at 6130Trade Tensions:
Trump has threatened higher tariffs on Japan, criticising its refusal to import U.S. rice.
The EU is open to a trade deal with the U.S. involving a 10% universal tariff on many exports, but seeks lower rates for key sectors like pharmaceuticals and semiconductors.
Markets:
U.S. equity futures are steady after the S&P 500 posted its best quarter since 2023.
Focus remains on trade developments and ongoing disputes in Washington over a major $3.3 trillion tax bill.
Canadian stocks are outperforming, led by gold miners, as investors seek safe-haven hedges amid tariff risks.
U.S. Tax Bill:
Republican leaders are struggling to secure votes.
A controversial AI regulation amendment was rejected.
Yale economists estimate the bill would cost the bottom 20% of earners $560/year, while the top 20% gain $6,055/year on average.
Corporate News:
Apple may use OpenAI or Anthropic’s AI to upgrade Siri, potentially sidelining its own AI models.
Key Support and Resistance Levels
Resistance Level 1: 6260
Resistance Level 2: 6310
Resistance Level 3: 6350
Support Level 1: 6130
Support Level 2: 6090
Support Level 3: 6055
This communication is for informational purposes only and should not be viewed as any form of recommendation as to a particular course of action or as investment advice. It is not intended as an offer or solicitation for the purchase or sale of any financial instrument or as an official confirmation of any transaction. Opinions, estimates and assumptions expressed herein are made as of the date of this communication and are subject to change without notice. This communication has been prepared based upon information, including market prices, data and other information, believed to be reliable; however, Trade Nation does not warrant its completeness or accuracy. All market prices and market data contained in or attached to this communication are indicative and subject to change without notice.
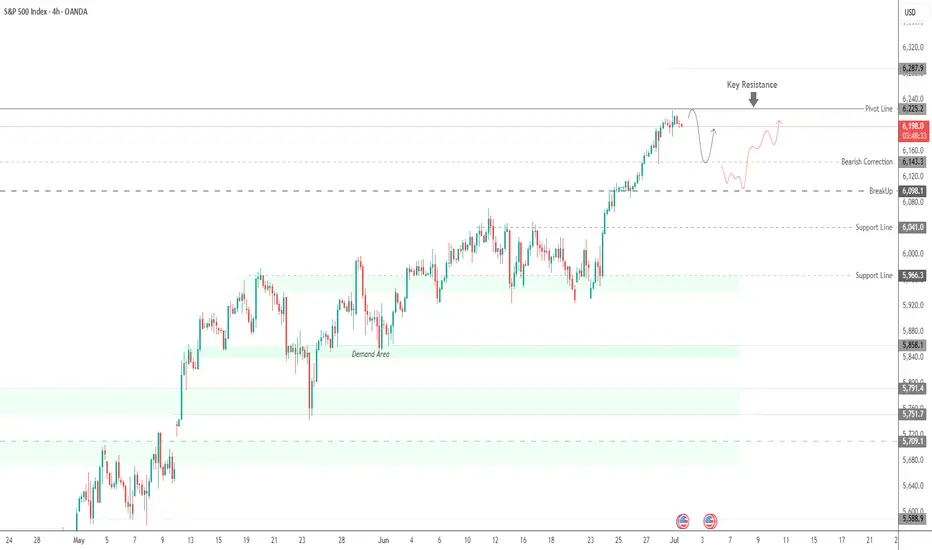
SPX500 | Bulls Need Break Above 6225 to Regain ControlSPX500 | Market Overview
The price has reached the previously mentioned resistance level at 6225.
As long as it trades below 6225, a technical correction is likely, with downside targets at 6161 and 6143. From there, the index would need to stabilize above 6143 to resume a bullish structure.
However, a 1H candle close below 6143 would confirm a deeper bearish move toward 6098.
On the upside, a 1H close above 6225 would reinforce bullish momentum, with potential to reach 6250 and 6287.
Key Technical Levels
Pivot Level: 6191
Support: 6161 / 6143 / 6098
Resistance: 6225 / 6250 / 6287
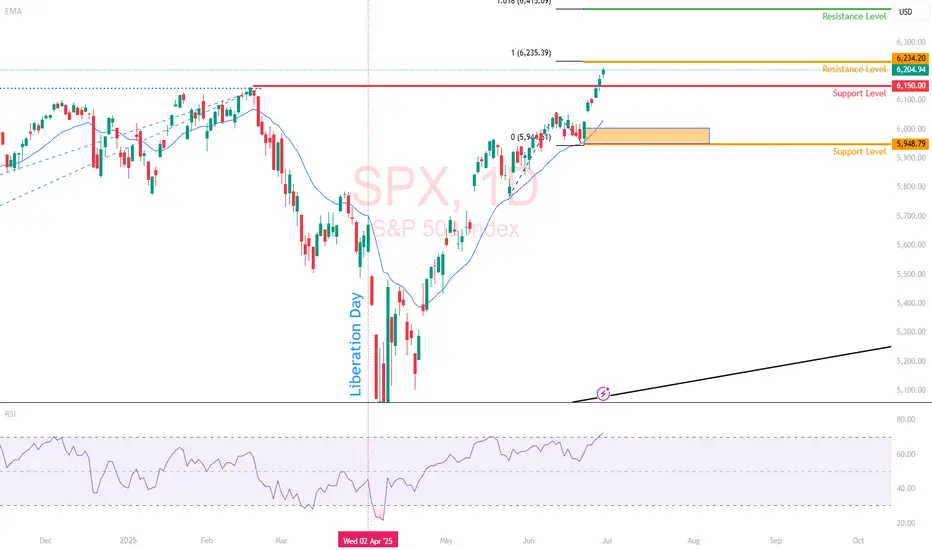
S&P 500 Outlook. Best Quarter Since 2023… But What Next?The S&P 500 just logged its best quarterly performance since Q4 2023 , surging on optimism around global trade negotiations and growing expectations that the Fed may begin cutting rates as early as September. US futures are green this morning, thanks to developments like Canada backing off digital taxes, ongoing dialogues with China ahead of the July 9 deadline, and risk-on sentiment is pushing yields and the dollar lower.
But as traders, we need to ask:
Are we witnessing a genuine economic inflection point? Or is this just a liquidity-driven rally that’s pricing in a best-case scenario?
Technical View
Support Zone: 6,150 was just broken through. And 6000, the round number level, coinciding with the 20-day EMA and previous swing level.
Resistance Levels: 6,235 is the next critical ceiling, a clean breakout could see price reach the extension level of 6,415.
Momentum Indicators: RSI remains elevated and is creeping toward the overbought. While momentum is strong, watch out for the possible development of a divergence.
Possible Scenarios
The 'Soft Landing’ Is Now the Base Case
Markets are trading as if the Fed has successfully engineered a soft landing. But that’s now fully priced in, and historically, the most dangerous trades are the ones everyone agrees on. If trade talks stall, inflation re-accelerates, or earnings disappoint, the reversal could be brutal and fast.
Risk-on Sentiment Without Volume Is a Yellow Flag
Despite the price strength, volume has been tapering off. The S&P’s recent leg up occurred on lighter-than-average participation, suggesting institutions may be watching, not chasing. That’s often the case in low-volatility summers, but it also implies that any negative catalyst could cause outsized downside moves.
Macro-Fundamentals May Not Justify Valuation Expansion
Yes, inflation is slowing, and the Fed might cut. But if they do, it’s likely because growth is weakening, not because the economy is roaring. So the very condition that triggers rate cuts could also cap earnings growth!
Projection
Bullish Scenario: A confirmed breakout above 6,280 could carry us toward 6,400–6,500 by mid-Q3, especially if the trade deals progress, July inflation comes in soft, and the Fed signals accommodation.
Bearish Risk: If price fails to hold above 6,120, especially if trade optimism fades, or inflation growth spikes or Fed rhetoric shifts hawkish again, this could then open a quick pullback toward 6,000 or lower, which also aligns with the 50-day SMA.
Key Events to Watch
July 9 Trade Talks Deadline: Any sign of stalling could bring volatility back fast.
June CPI Print (July 10): Crucial for confirming the Fed's next move.
Earnings Season Kickoff (mid-July): Tech-heavy expectations may not be easy to beat after such a strong run.
Conclusion
A record-setting quarter is impressive but not necessarily predictive. This quarter’s rally has been built more on relief and expectations than hard data. When expectations (not earnings) are doing the heavy lifting, any misstep from central banks or geopolitics could unravel gains rapidly.
A rate cut might be delayed, or inflation re-accelerates, or trade talks stall; any of these could leave equities hanging. Remember: the higher the climb without real earnings growth, the harder the fall when sentiment shifts. It's not just about the chart. It is about the narrative behind the price.
What’s your bias for Q3?
Are you buying this breakout or fading the optimism? Drop your thoughts below.
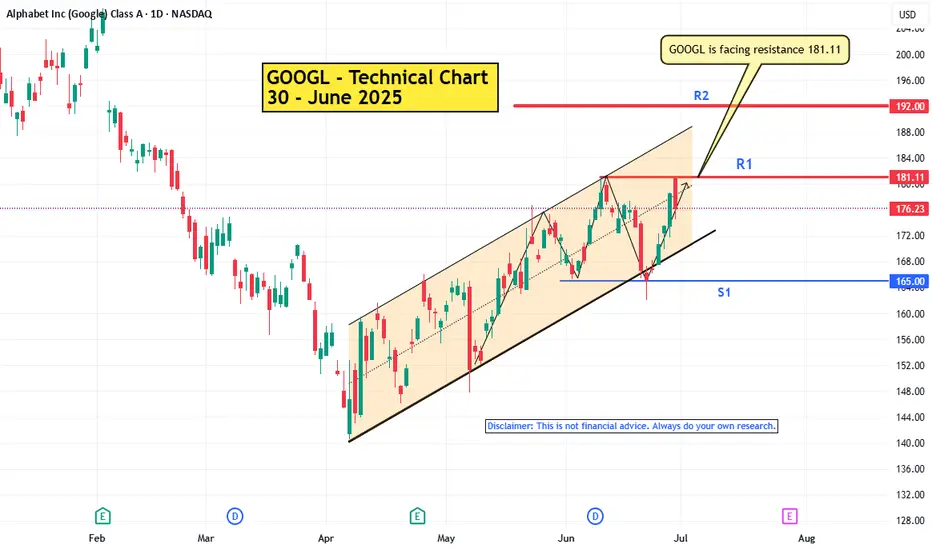
GOOGL is facing resistance 181.11NASDAQ:GOOGL
Google is in uptrend . Currently it is facing the resistance 181.11.
It has slightly pull backed from the resistance.
Pattern : Ascending channel - a bullish chart pattern. To valid this pattern the price has to consistently make higher highs and higher lows. But the price is now facing the resistance 181.11 To make higher high it has to break it.
If it fails to break the resistance , sideways trend may be seen here for short period of time and bullish momentum may become weak.
Note :
If you’re interested in receiving detailed technical analysis reports on your selected stocks, feel free to reach out to me. I can provide you with customized reports covering trends, key levels, momentum, patterns, and price projections to support your trading or investment decisions.
AAPL Significant Event NASDAQ:AAPL
1. Bullish Breakout :
In the daily chart bullish breakout has been seen. If the bullish momentum is strong, the price may follow the upward.
2. Target Price : Potential target price 214
3. Risk Factors:
A. Failure to breakout the resistance 206
B. Sideways trend may be started.
C. Broader market weakness or correction
D. False Breakouts
---------------------
Note :
If you’re interested in receiving detailed technical analysis reports on your selected stocks, feel free to reach out to me. I can provide you with customized reports covering trends, key levels, momentum, patterns, and price projections to support your trading or investment decisions.

I'm betting on the rise of the S\&P 500, therefore I'm betting oWe broke through the local level and are confidently moving toward the all-time high.
We are also above all moving averages, which gives us additional confidence in our trade.
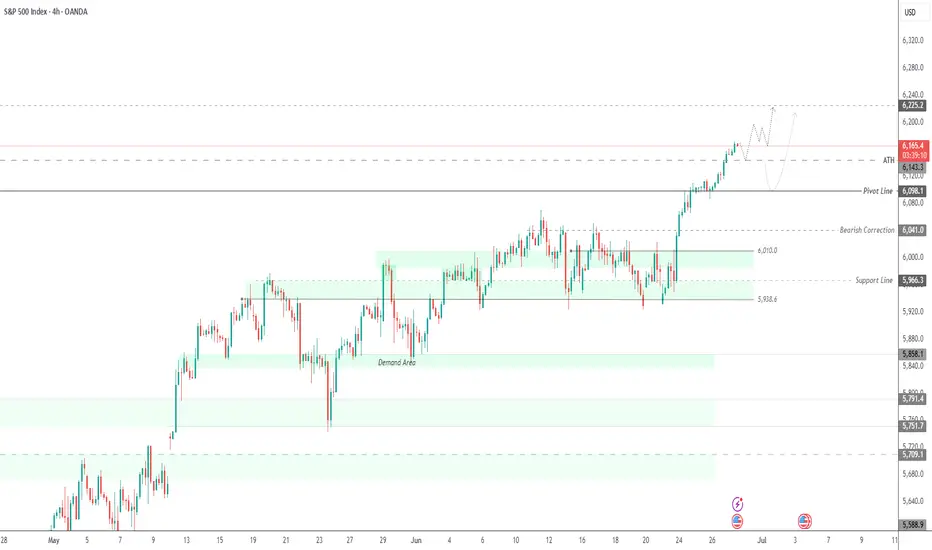
S&P 500 Sets New All-Time High, Surges Above 6200S&P 500 Sets New All-Time High, Surges Above 6200
The S&P 500 index (US SPX 500 mini on FXOpen) started the week by reaching a fresh all-time high. As shown on the chart, the index hit 6,210 points earlier this morning.
In addition to a reduced risk of US involvement in a large-scale war in the Middle East, market optimism has been fuelled by:
→ Tariff-related news. Last week, the US President announced the signing of a trade deal with China, while Treasury Secretary Scott Bessent expressed hope that the US would conclude trade negotiations with over a dozen countries by early September.
→ Strong corporate performance. On Friday, Nike (NKE) shares led the stock market, rising by more than 15% following an earnings report that exceeded analysts’ expectations. This could be boosting investor sentiment ahead of the upcoming earnings season.
Technical Analysis of the S&P 500 Chart
Evaluating the 4-hour chart of the S&P 500 index (US SPX 500 mini on FXOpen) in the context of June’s price movements reveals key reference points (marked on the chart) that outline an ascending channel. A consolidation zone, marked with an arrow, highlights a temporary equilibrium between supply and demand—after which buyers gained the upper hand, pushing the price upward.
It is possible that the ongoing bullish momentum could carry the price toward the upper boundary of the channel. However, attention should be paid to the RSI indicator, which suggests the market is heavily overbought; in fact, Friday’s reading marked the highest level of the year. In such conditions, a price correction cannot be ruled out—potentially back toward the local ascending trendline (shown in orange).
This article represents the opinion of the Companies operating under the FXOpen brand only. It is not to be construed as an offer, solicitation, or recommendation with respect to products and services provided by the Companies operating under the FXOpen brand, nor is it to be considered financial advice.
SPX500 Extends Rally on Fed Hopes and China Trade DealS&P 500 Set to Extend Record Highs
U.S. stock futures climbed on Friday, continuing this week’s strong momentum on hopes of eased trade tensions and growing confidence in multiple Fed rate cuts later this year.
Futures tied to the S&P 500 and Nasdaq 100 pointed to fresh record-high openings, while the Dow Jones was set to rise by 150 points.
Adding to the bullish tone, Commerce Secretary Lutnick announced a trade agreement with China, reducing tariff risks and easing concerns over rare earth shortages.
TECHNICAL OUTLOOK – SPX500
The index has broken into new all-time highs (ATH) and stabilized above the 6,143 resistance level, confirming bullish strength.
As long as the price trades above 6,143, the uptrend is likely to continue toward 6,225, with potential short-term pullbacks to 6,143.
A 1H candle close below 6,143 could trigger a deeper correction toward the pivot zone at 6,098.
Key Levels
Resistance: 6,175 → 6,225
Support: 6,098 → 6,041
previous idea:
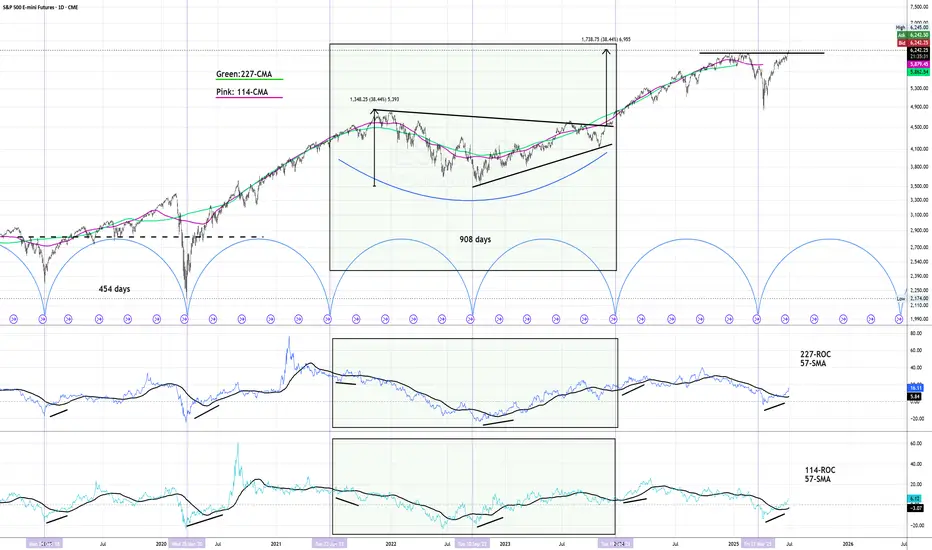
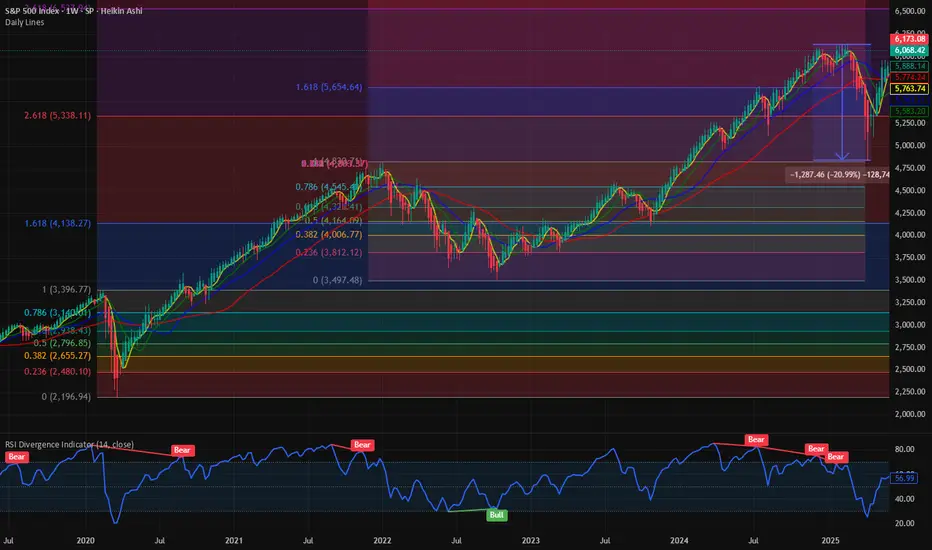
SP500 - Cycle Analysis; New V-Bottom24 Dec 2018 - V-Bottom Trough:
This marks a clean V-bottom. Both the 227-ROC and 114-ROC showed simultaneous positive acceleration after price reacing its low. Shortly after, both crossed their 57-SMA almost in sync — increasing the probability of a sustained bullish move. Price confirmed this by breaking resistance and forming a V pattern. This was further validated by the centered moving average crossover (114-CMA crossing above 227-CMA).
25 Mar 2020 - Deep COVID Crash Trough:
During this phase the priced broke below the support, creating a deep trough. Altough both ROC lines initially showed strong negative acceleration due to the COVID-19 crash, they soon reversed above their 57-SMAs, signaling a major shift in momentum. This coincided with the price breaking above the key resistance which was also crossed in 2019 when confirming the old V-pattern. After this breakout, a brief pullback followed before the uptrend resumed with increasing strength.
22 Jun 2021 to 19 Dec 2023 - Pattern
During the initial period a bearish divergence was visible in the ROC, nevertheless price and rate of change both declined making a low in early October 2022. A technical pattern began to form, which appears to align more closely with a symmetrical triangle; So when measuring its height and projecting it from the breakout point aligns with the new all-time highs that were reached on 27 June 2025.
21 Mar 2025 - New Cycle Trough
A new V-bottom formed shortly after the current cycle began. Both ROC indicators had already crossed their SMAs to the upside, showing early signs of positive acceleration, days before of price broke through the resistance and reached the new record high.
The 227-SMA is likely to cross from below the fast SMA while a possibility of a pullback increase.
Following that, the 114-CMA will probably has the chance to cross back the 227-CMA, with the price potentially confirming a new support level and resuming its uptrend - in line with the broader cycle timeline.
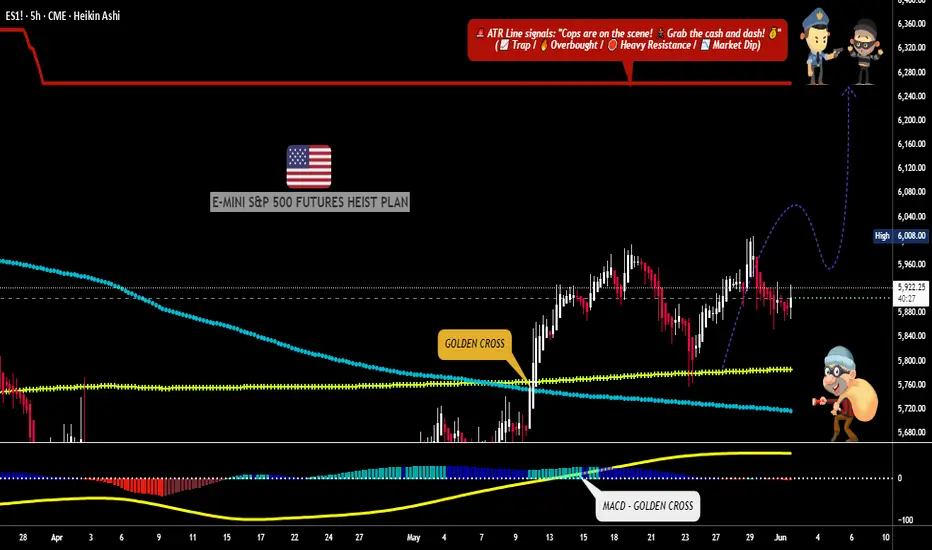
S&P 500 BULLISH GRAB: Steal These Gains Before the Trap Closes!🚨 E-MINI S&P 500 HEIST: Bullish Loot Before the Market Turns (Thief Trading Blueprint) 🚨
🌟 Hola! Oi! Bonjour! Ciao! Guten Tag! 🌟
Attention all Market Bandits & Index Raiders! 🏴☠️📊💰
🔥 Thief Trading Intel: We're targeting ES1! (E-Mini S&P500) for a potential bullish breakout! Long entry only—approaching high-risk Red Zone: overbought, consolidating, and ready for a move. Don't let the bears steal your profits!
"Grab your gains and disappear into the night—you've earned this steal!" 💰🌙
🚪 ENTRY: The Vault is Cracked!
📈 "Swipe bullish positions at any price—the heist is ON!"
Buy Limit orders near swing lows/highs (15-30 min TF)
📌 Pro Tip: SET PRICE ALERTS! Don't miss the move
🛑 STOP LOSS: Escape Route
📍 Smart Thief SL: Nearest swing low (4H timeframe)
📍 Adjust based on your risk tolerance & position size
🎯 TARGET: Take the Money & Run!
🎯 6260.00 (or exit early if the market turns)
⚡ SCALPERS' QUICK GRAB
👀 Long positions ONLY!
Big accounts? Strike now
Small accounts? Ride with swing traders
Trailing SL = Your Getaway Car!💨
📢 WHY THIS HEIST? (S&P 500 Setup)
Neutral trend with bullish potential! Watch for:
Fundamentals (COT, Macro Data, Geopolitics)
Market Sentiment & Sector Rotation
Index-Specific Patterns
🔗 Full analysis? Check our bio0 linnks! 👉🏻👉🏻👉🏻
⚠️ WARNING: News = Danger Zone! 📰🚨
Economic reports move markets! Protect your loot:
❌ Avoid new trades during news
🔒 Trailing stops lock in profits
💖 SUPPORT THE HEIST CREW!
💥 SMASH THAT BOOST BUTTON! 💥
More boosts = bigger future scores!
Stronger crew = more profits for all!
Trade like a thief, profit like a king! 👑💰
Next heist coming soon—stay sharp! 🎯🤫
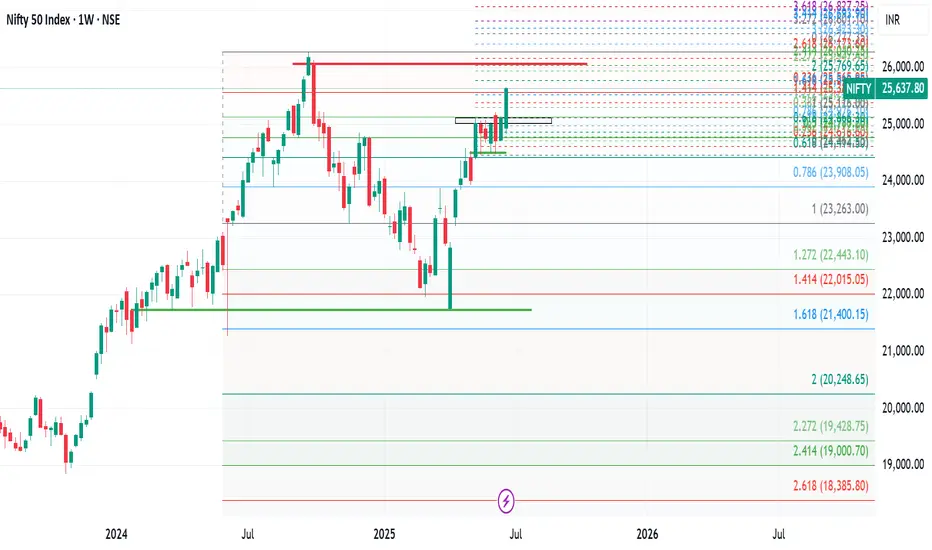
Market Recap: Nifty Breaks Out After 5 Weeks of Consolidation!The Indian stock market saw a strong bullish move this week, with Nifty 50 closing at 25,637, marking a significant gain of 525 points from the previous week's close. The index made a high of 25,654 and a low of 24,824, finally breaking out of the key resistance zone of 25,000–25,100 after five weeks of sideways consolidation.
This breakout is a critical technical development, signaling renewed strength in the broader market. However, to sustain this momentum and target the all-time high zone of 26,134–26,277, Nifty may need to either:
Consolidate within the previous week's range of 25,650–24,800, or
Retest the breakout level near 25,200 for confirmation.
Failing to do so could make this breakout a false one.
Weekly Outlook for Nifty:
For the coming week, the expected trading range is between 25,200 and 26,150. Price action around these levels will be key to watch.
On a broader sectoral view, out of 14 NSE indices, only Nifty Financial Services is showing relative strength on the monthly chart—a potential red flag for sustained bullish sentiment. When just one sector leads while others lag, it's often a sign to remain cautious.
Strategy Suggestion:
Consider booking partial profits and trailing stop losses on the remaining positions. Until the monthly time frame turns decisively bullish, it's wise to stay alert and manage risk actively.
Global Markets: S&P 500 Breaks Out!
In the U.S., the S&P 500 surged to close at 6,173, successfully breaking above its key resistance level at 6,013. This breakout, if sustained above 6,150 next week, opens up the path toward higher targets: 6,225 / 6,376 / 6,454 / 6,500.
However, traders should remain flexible. If the breakout fails, we could see a pullback to support zones near 6,013 or even 5,899.
Pro Tip:
Be ready to switch trading positions quickly if the breakout doesn’t hold—volatility is still very much in play in both Indian and U.S. markets.
$SPX Path of least resistance is higher. Next Stop : 6500 This week we officially recovered all the losses from the liberation day low. We had a 20% bear market crash and since then there has been a V shaped rally in the major averages. NASDAQ:QQQ and SP:SPX have fully recovered the losses and then some. It is 0% form its ATH. We have been closely following the chart of SP:SPX for the last few weeks and have marked various Fib Retracement levels and Fib Extenstion. IN my opinion the Covid lows were one of the majot drawdown moments.
If we plot the Fib Extension on the COVID highs and lows, we can clearly see the Support and Resistance zones. As per the Fib Levels the next consequential level in SP:SPX will be 6550, which is the 3.618 Fib level. That I would suggest as the path to least resistance. First, we go higher before we can see any major correction. In case of a Major correction, we get support @ 5300.
Verdict : SP:SPX goes higher first before correction. 6550 is the next stop.
S&P 500 Daily Chart Analysis For Week of June 27, 2025Technical Analysis and Outlook:
During the current trading week, the S&P 500 Index has predominantly demonstrated an upward trajectory, surpassing the Mean Resistance level of 6046, the Outer Index Rally target of 6073, and the critical Key Resistance threshold of 6150. Currently, the index is exhibiting a bullish trend, indicating potential movement towards the Outer Index Rally objective of 6235. However, it is essential to note that there is a substantial probability that prices may retract from their current levels to test the Mean Support at 6136 before experiencing a resurgence.
S&P500: Target Zone DeactivatedThe S&P 500 extended its bullish trend yesterday, moving beyond our now-deactivated (formerly magenta) Target Zone. Existing positions remain intact, as the stop set 1% above the upper boundary has not been triggered. In our updated primary scenario, we anticipate continued upward movement within magenta wave (B), potentially reaching the resistance at 6675 points. Once this peak is established, we expect a corrective decline to begin in the form of wave (C), which should guide the index into the green Long Target Zone between 4988 and 4763 points. There, the larger green wave is expected to complete. A sustained breakout above the 6675-point level would shift the outlook in favor of the alternative scenario. In that case, green wave alt. would be considered complete—a trajectory we currently assign a probability of 40%.
📈 Over 190 precise analyses, clear entry points, and defined Target Zones - that's what we do.

S&P 500 hits fresh records: Levels to watchBreaking its February peak, the S&P 500 has joined the Nasdaq 100 in hitting a new record high this week. The latest gains came on the back of a sharp de-escalation in the Middle East and mounting pressure on the Fed to cut rates.
They question is whether it will kick on from here or we go back lower given that trade uncertainty is still unresolved. Indeed, there’s the upcoming 9 July deadline, when the current reciprocal tariff truce is due to expire. Unless it’s extended—or replaced by something more concrete—we could be in for another wave of trade tensions.
It is also worth remembering the ever-looming US fiscal showdown. Trump’s much-touted spending bill—nicknamed the “One Big Beautiful Bill”—is targeting a Senate vote by the 4th of July. If passed, it could reignite concerns about ballooning deficits and inflationary pressure.
Anyway, from a purely technical analysis point of view, the path of least resistance continues to remain to the upside. Thus, we will concentrate on dip buying strategy than looking for a potential top - until markets make lower lows and lower highs again.
With that in mind, some of the key support levels to watch include the following:
6069 - the mid-June high, which may now turn into support on a potential re-test from above
6000 - this marks the launch pad of the latest rally and marks the 21-day exponential average
5908 - this week's low, now the line in the sand. It wouldn’t make sense for the market to go below this level if the trend is still bullish.
Meanwhile, on the upside:
6169 is the first target, marking the 161.8% Fib extension of the most recent downswing
6200 is the next logical upside target given that this is the next round handle above February’s peak of 6148
By Fawad Razaqzada, market analyst with FOREX.com

It seems very simple.Based on the market volume chart, as well as its similarity to previous declines, it seems like we are approaching a reliable bottom. This bottom is not far away and could happen right around 5000. We just have to wait for the daily reversal candle.

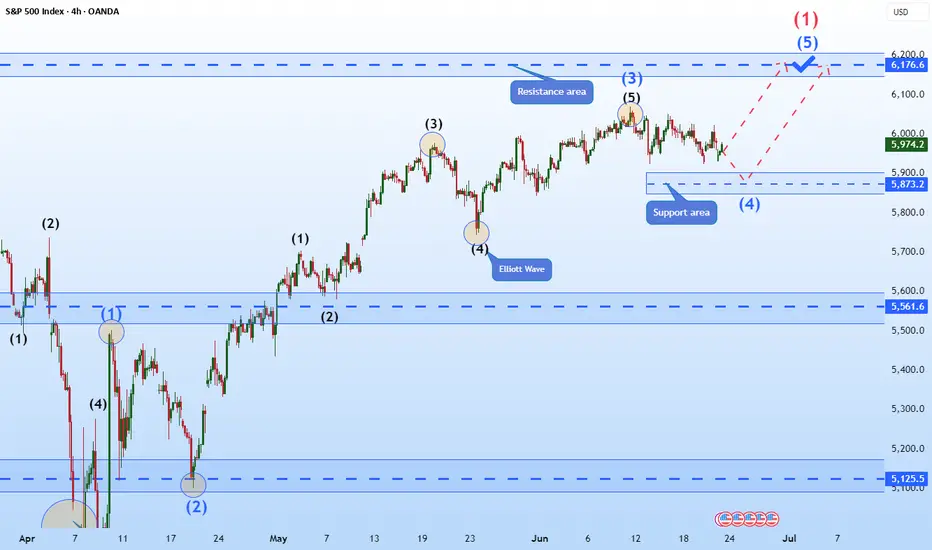
Hellena | SPX500 (4H): LONG resistance area of 6176 (Wave 1).Colleagues, the previous forecast remains essentially unchanged, and the target is still 6176, but I think the forecast can be updated because the price has been flat for quite some time.
I still expect the upward movement to continue in the large wave “1” and in the medium-order wave “5”.
A small correction to the support area of 5873 is possible.
Manage your capital correctly and competently! Only enter trades based on reliable patterns!