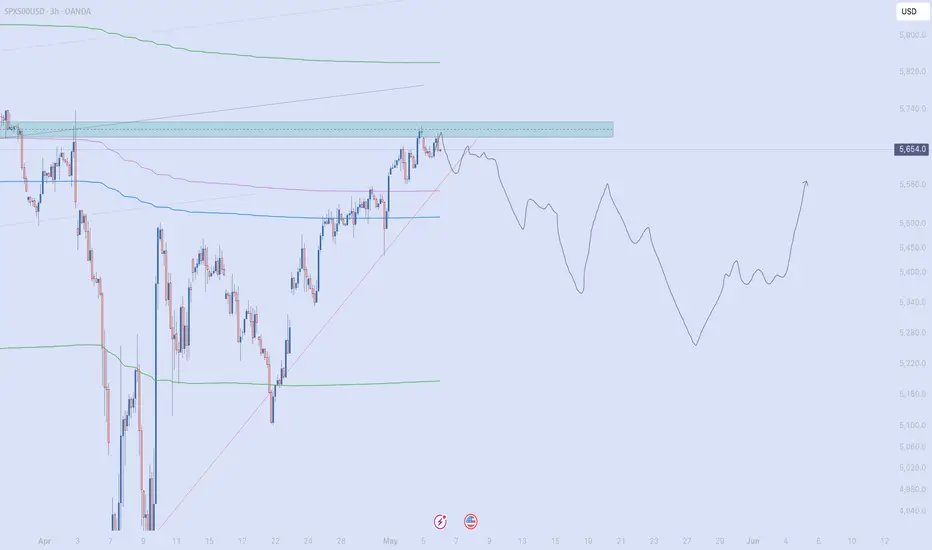
Beyond The Plan Your Trade Videos - Trading Algos/ConfirmationMany of you follow my morning Plan Your Trade videos - and I thank you for your loyalty and dedication.
The Plan Your Trade videos are specifically deigned to highlight my SPY/GOLD Cycle Patterns and, over the course of the past 9+ months, I've started trying to teach all of you Fibonacci Price Theory and the concept of the Excess Phase Peak pattern (and Cradle Pattern).
My goal is to teach you to learn to understand price structures, setups, and actions as a way to try to advance your technical analysis/trading skills.
There are so many others out there trying to teach you to use indicators and other types of analysis to try to identify trading opportunities/setups. Some work, some don't.
Technical analysis using Indicators, Elliot Wave, or other forms of predictive analysis/AI are only about 50-75% accurate at best (IMO). Nothing is 100% perfect.
After 35+ years of trying to unlock the secrets of price action to devise a 100% accurate trading system, the closest I have come is a system that generates about 65-75% accuracy - but still manages to take some losses.
I do believe I can find that 100% accurate system (hopefully before I die). But the reality is it is almost impossible to accurately predict price movement 10-20+ days in advance with any degree of accuracy.
Over the past few weeks/months, we've seen the SPY/QQQ move through various stages/phases.
Over the past 4+ weeks I've been warning of the broad-consolidation phase that is currently setup on the SPY/QQQ. I believe this huge consolidation range is very dangerous for traders and that extreme volatility will create lots of risk/opportunities for those capable of trading within this range.
But, at the same time, failing to take advantage of tools to help traders hedge, daytrade, or otherwise balance allocation/risk levels is something I really don't talk about much.
I like to say "I do the research - you make all the trading decisions".
This video highlights some of my advanced algos and how I use them, in conjunction with the EPP and other patterns, to try to gauge market opportunities vs. risks.
Trust me. I've learned not to GO BIG on trades over the past 20+ years because I've blown up a few accounts trying to get greedy.
Right now, I focus on trying to be on the right side of trends (if possible) and to balance my portfolio in 10-20% increments.
For example, if I believe GOLD is going to move higher, I may start out with a 5-10% allocation into GLD or UGL (start small). If that trade works and Gold starts to make a move higher, I may try to add a bit more to that initial trade. If it doesn't work out, I may try to add a little bit more at a better entry price level - but I focus on not letting that trade occupy more than 15-20% of my total portfolio.
That way, if I take a loss on the trade, it is a small loss compared to the overall account capital.
If I take a 50% loss on a 20% allocation - that is only a 10% loss on the TOTAL ACCOUNT SIZE.
Get it?
So, the reason for this video is to show you how you can still use technical strategies/indicators to try to confirm you intraday trading and swing trading opportunities. I like to use the SuperTrend strategy on charts to identify general trending.
I'm urging you to consider my Plan Your Trade videos as "one component" of your skillset. You need to use your own skills/techniques/analysis to try to manage risks vs. opportunities as you continue to trade.
I highlight some of my algos because they become another "component" of my analysis when I'm trading. If I don't see broad market capitulation related to Daily trending - then I try to stay VERY CAUTIOUS. If I do see some capitulation within my algos suggesting the markets are starting to trend upward or downward, then I may try to take advantage of that opportunity.
Ideally, the process of trading is to use everything you like and can rely on to help confirm you decision-making. Then, fall back to a efficient trade allocation process that attempts to limit your risk level.
The biggest mistake I see people make is to go ALL IN or TOO HEAVY into a trade thinking they can't lose. Yes, you can lose. So can I.
That's why it is important to contain risks and protect capital at all times.
I'll try to create another video showing you how I use the SuperTrend indicator to help confirm some of my intraday analysis for trades.
Get Some.
#trading #research #investing #tradingalgos #tradingsignals #cycles #fibonacci #elliotwave #modelingsystems #stocks #bitcoin #btcusd #cryptos #spy #gold #nq #investing #trading #spytrading #spymarket #tradingmarket #stockmarket #silver
S&P 500 (SPX500)

SPY/QQQ Plan Your Trade For 5-8 : EPP & Cradle Pattern UpdateThis video highlights why I continue to stay very cautious of this upward price move in the US markets.
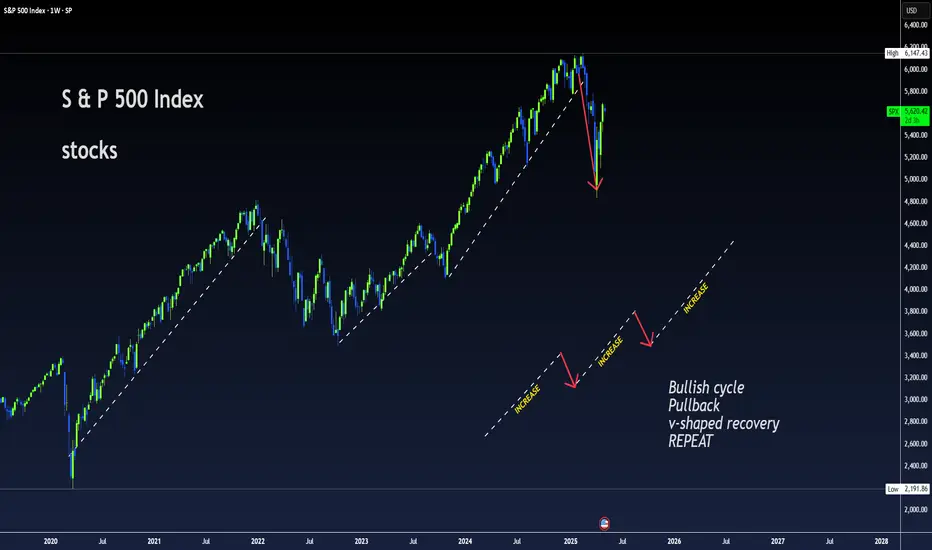
It also highlights that the current trend is BULLISH - not BEARISH. When I post the videos in the morning, I've been selecting BEARISH as the general trend because I believe the markets are going to roll over into a breakdown phase. Until that happens, though, the markets are in a BULLISH price trend - attempting to possibly break above the current Ultimate High.
This is more of an instructional video - trying to show you why I continue to urge caution related to trends and why I belive we may have many months to go before the US markets really start to make a bigger "exit trend" type of move (exiting this broad consolidation range).
The other thing this video should teach you is how to identify EPP and Cradle patterns more efficiently and how to use them.
Ultimately, everything I share with all of you is designed to help you understand price as the ultimate indicator.
If you can grasp these concepts and understand how each phase of price structure presents opportunities, then you should be able to time and execute your trades very efficiently.
As I've stated in the videos, because of family medical issues over the past 60+ days, I've moved away from daytrading and gone back to a 2-5+ week swing trading style.
Simply put, I'm driving all over the place taking care of my family, seeing doctors, and other stuff - so I can't stare at my PC/Phone while the markets are open.
I'm also taking very low risk trades. If I decide to get into a trade, I'm usually avoiding the SPY/QQQ and selecting some SPDR sector (or other ETF) that allows me to play the move I expect without risking a fortune doing it.
Anyway, I hope you enjoy this video. I'll probably create one more after this video posts.
Get some.
#trading #research #investing #tradingalgos #tradingsignals #cycles #fibonacci #elliotwave #modelingsystems #stocks #bitcoin #btcusd #cryptos #spy #gold #nq #investing #trading #spytrading #spymarket #tradingmarket #stockmarket #silver

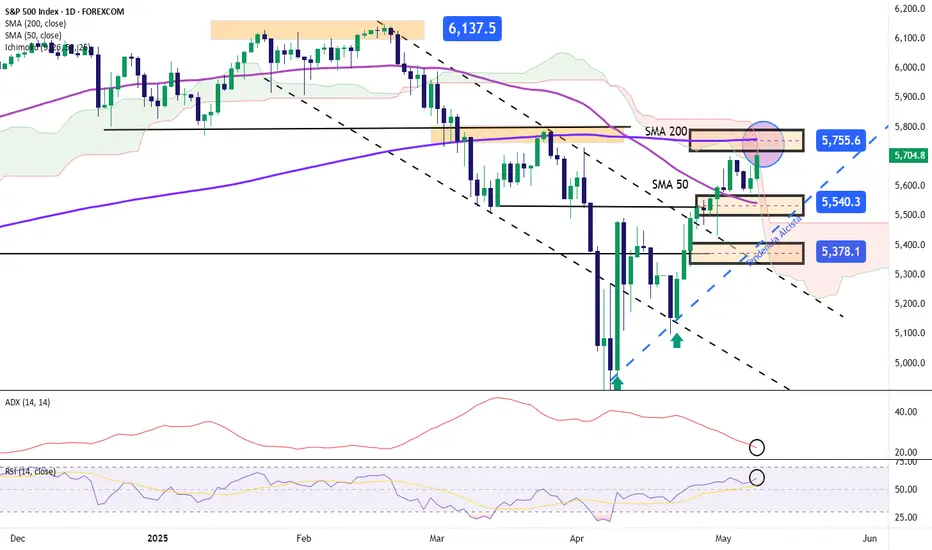
SPX Continues to Rise After FOMC DecisionThe U.S. index has been gaining more than 2% in recent trading sessions, and the bullish bias has remained intact since the Federal Reserve’s decision during yesterday’s session. The central bank once again opted to keep the interest rate steady at 4.5%. However, according to some comments, Chairman Powell mentioned that the economy is approaching a point where it may soon be appropriate to begin cutting interest rates. This has fueled expectations of future rate cuts and has helped sustain confidence in equity indices over the short term.
Uptrend: Since April 9, a new short-term uptrend has been consistently forming, with price movements holding above the 5,000-point mark. However, the price is now approaching a key resistance level, and as long as this barrier holds, it could lead to short-term neutrality in recent price action.
ADX: The ADX line has been falling sharply in recent sessions and is now nearing the neutral 20 level. This indicates a lack of sustained volatility in recent price moves. If the ADX remains at these levels, it could reinforce a period of consolidation or range-bound movement in the short term.
RSI: The RSI line remains consistently above the neutral 50 mark, indicating that buying momentum still dominates in the short term. However, as the RSI approaches the overbought level near 70, this could open the door for short-term bearish corrections.
Key Levels:
5,750 points – Nearby resistance: This level coincides with the 200-period simple moving average. A breakout above this zone could strengthen the bullish bias and support a more sustained uptrend.
5,540 points – Nearby support: This level aligns with the 50-period moving average and may serve as a potential zone for bearish corrections to unfold.
5,370 points – Critical support: This level aligns with the short-term ascending trendline. A drop below this support could jeopardize the current bullish structure in the short term.
Written by Julian Pineda, CFA – Market Analyst
SPY/QQQ Plan Your Trade For 5-8 : Carryover PatternToday's Pattern is a Carryover pattern in Carryover mode.
After yesterday's FOMC news (unchanged), the markets are seeking a bit of direction. Bitcoin rallied and INVALIDATED a EPP Flagging pattern. In my opinion this suggests the SPY/QQQ may attempt to move a bit higher after the Fed decision.
Although, I still believe the global markets are reacting to uncertainty and tariff news within a very broad consolidation range. So, I'm cautious of trying to go ALL-IN on any long trades at the moment.
Until we break clear of the consolidation range, price could break strongly to the downside on news or geopolitical content. In reality, any type of big news could prompt a downward price move within an uptrend or a consolidation range.
It just seems as though the current global market environment is fraught with uncertainty - so I continue to stay cautious.
Gold and Silver pulled downward overnight. But I still believe metals will continue to rally - attempting to hedge against global risks.
With Bitcoin rallying a bit higher (still in consolidation) - let's see how the next few days play out.
I would be surprised if BTCUSD and the SPY rallied to new highs before the end of May. VERY SURPRISED given the status of the global markets.
But, the markets can stay completely irrational much longer than I can try to fight them. So we have to move WITH the markets - not against them.
Get some.
#trading #research #investing #tradingalgos #tradingsignals #cycles #fibonacci #elliotwave #modelingsystems #stocks #bitcoin #btcusd #cryptos #spy #gold #nq #investing #trading #spytrading #spymarket #tradingmarket #stockmarket #silver

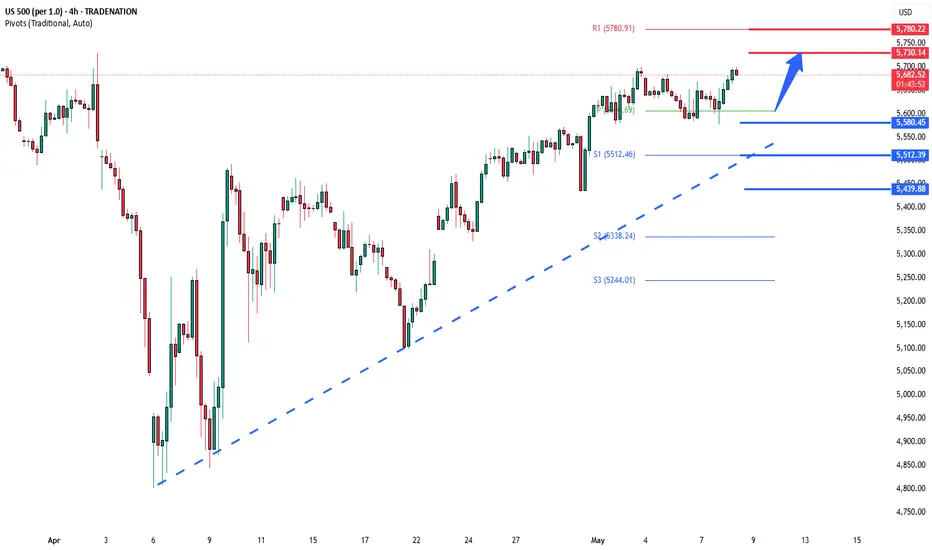
S&P INTRADAY uptrend continuationMarket and Geopolitical Update
US–UK Trade Deal: Donald Trump announced a trade agreement with the UK, calling it the first of his promised deals. Details will be released by the White House.
Chipmakers Rise: The US plans to roll back some Biden-era AI chip export restrictions, boosting chip stocks. New rules are in development to better control foreign chip use.
Markets Rally: US stock futures climbed, Bitcoin neared $100,000, and the dollar strengthened slightly after the Fed signaled no rush to cut rates.
Corporate Struggles: Despite market optimism, companies continue to feel tariff pressure. Toyota expects a $1.3 billion hit, while Maersk downgraded its transport outlook.
India–Pakistan Tensions: Pakistan reported shooting down 12 Indian drones, escalating long-standing tensions. India’s Nifty 50 dropped 0.4%, and Pakistan’s KSE-30 fell 7%.
Key Support and Resistance Levels
Resistance Level 1: 5730
Resistance Level 2: 5780
Resistance Level 3: 5874
Support Level 1: 5580
Support Level 2: 5510
Support Level 3: 5440
This communication is for informational purposes only and should not be viewed as any form of recommendation as to a particular course of action or as investment advice. It is not intended as an offer or solicitation for the purchase or sale of any financial instrument or as an official confirmation of any transaction. Opinions, estimates and assumptions expressed herein are made as of the date of this communication and are subject to change without notice. This communication has been prepared based upon information, including market prices, data and other information, believed to be reliable; however, Trade Nation does not warrant its completeness or accuracy. All market prices and market data contained in or attached to this communication are indicative and subject to change without notice.
Bitcoin showing itself to be the STRONGEST ASSET right nowThsi is a VERY Bold statement but there is a saying that we need to understand
CHARTS NEVER LIE
This chart is the 4 hour charts of
Bitcoin - Gold
DXY $ - S&P500
There are a number of things to see here.
The First and strongest sign is simply that Bitcoin has risen over the last 36 hours alongside the $ Rising.
This in itself is a huge sign. 80% of the time, these 2 assets go in opposite directions. To me, this is showing a weakness in Faith in the $,
With Lower interest rates, less return on Holding. However, the USa will not want to see the $ drop much further and so I imagine it is being bought up to safeguard its price.
Next week, on the 13th, we have inflation figures published.
We need to watch that Closely.
The $ is currently Lower than it has been for a long time and while this can be seen as a Negative, it has also made American goods cheaper to buy to Foreign Markets, while it has increased the value of other Currencies.
Making the $ cheaper is potentially a Good idea.
At the same time, we see the Global traditional "Safe Haven" Selling off.
The Daily CFD on Gold chart above it has formed a double Top, that usualy creates a draw down.
It is also overbought on a daily after its recent pushes higher.
But more than anything, with interest rates remainiiiiiiiiiiiiiiiiiing static, this has released pressure of investers and so Risk appetite is returning.
Again, we need to watch what happens around the 13th when USA inflation figures are released.
And then the S&P500
Overall, it has been dropping since Feb
This Daily chart shows us It made a recovery but this may not be to go to ATH again but more part of the ABC correction.
There is a possibility it could be forming an inverse Head and Shoulders...so, again, we watch
So, over all, what we see is BITCOIN taking on all the markets and making the biggest gains
It has certainly been the least volatile with Dips and Troughs shallower than the $ and S&P500 which is Stunning if you have ridden Bitcoin for the last 10 years....
Bitcoin has Matured in to a REAL Asset Class..
For me, it is NOT Crypto anymore.
.IT IS BITCOIN

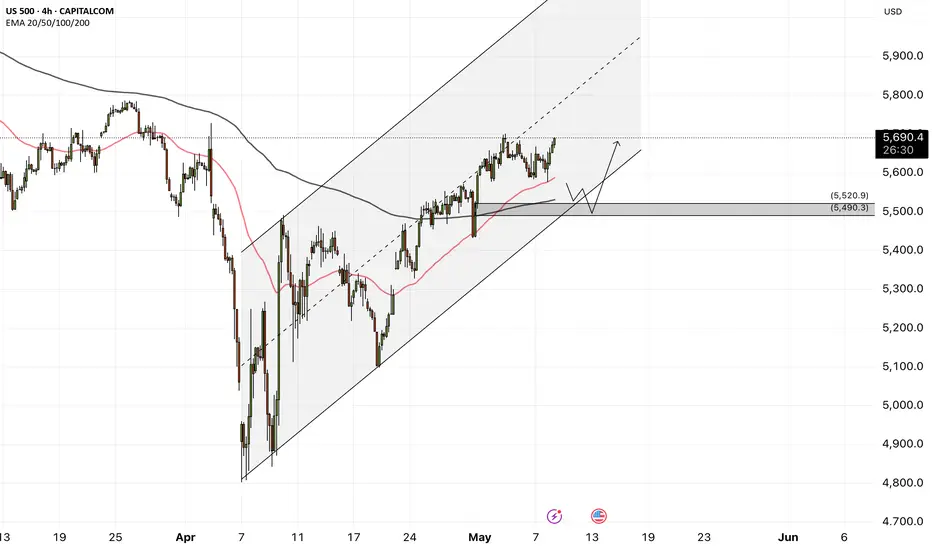
US500 - Which way will the stock market go?!The index is trading above the EMA200 and EMA50 on the four-hour timeframe and is trading in its ascending channel. If the index moves down towards the specified demand zone, one can look for further S&P buy positions with a good risk-reward ratio.
In its meeting last night, the U.S. Federal Reserve decided to keep the federal funds rate steady within the 4.25% to 4.50% range. This decision comes amid growing concerns about simultaneous rises in inflation and unemployment, particularly driven by the tariff policies of the Trump administration.
This marks the third consecutive time this year that the Fed has held rates unchanged, reflecting mounting economic uncertainty and fears of stagflation.Fed Chair Jerome Powell warned that the combination of high inflation, slow economic growth, and rising unemployment could lead the economy into stagflation. He noted that newly imposed tariffs could delay the disinflation process for up to a year or more.
The Trump administration has introduced steep tariffs, including a 145% levy on imports from China. These measures have contributed to rising prices and slower economic growth, placing additional strain on monetary policymakers.
Following the Fed’s announcement, stock markets exhibited volatility. The S&P 500 initially fell but ended the day higher. Bond yields declined, while the U.S. dollar strengthened.
Powell emphasized that future monetary policy decisions will be heavily data-dependent, and the central bank stands ready to act swiftly if necessary. He acknowledged that the economic outlook remains uncertain, requiring cautious and adaptive policy management.
Faced with escalating uncertainty and inflationary pressures stemming from new trade measures, the Fed has adopted a cautious stance. Given the current mixed economic indicators, the central bank is expected to maintain its interest rate policy until the economic picture becomes clearer.
Economists at Goldman Sachs have issued a warning that U.S. inflation is on the rise and may reach 3.8% by the end of 2025. According to their analysis, the weakening of the U.S. dollar and the implementation of tariff policies are the main drivers of increased inflationary pressure. Additionally, changes in import demand could elevate production costs and further intensify price increases.
The Wall Street Journal reported that new tariffs may raise the prices of smartphones and laptops by up to 30%. Contrary to popular belief, this inflationary impact may not be temporary and could result in sustained upward pressure on prices.
Meanwhile, ahead of the FOMC meeting, Alphabet (Google’s parent company) saw its stock plunge over 8%, falling to $149.50. Eddy Cue, a senior executive at Apple, disclosed that for the first time in April, user activity on browsers and search engines had declined. In response, Apple is exploring the integration of AI-powered search into its browsers—a move that could pose a serious threat to Google’s advertising revenue.
Simultaneously, President Trump announced he would not enforce the AI content restriction law, initially introduced during the Biden administration and scheduled to take effect on May 15. This decision comes just before his trip to the Middle East, where countries like Saudi Arabia and the UAE have voiced frustration over chip access restrictions.
Trump administration officials are currently drafting new legislation aimed at tightening control over the export of advanced chips. This initiative may form part of a broader agreement, as the UAE has pledged to invest up to $1.4 trillion in U.S. technology and infrastructure over the next decade.
SPY Chart Analysis Symmetrical Triangle Signals Potential BreakThe SPDR S&P 500 ETF Trust (SPY) is exhibiting a classic technical setup that may lead to a significant price move. As of early May 2025, SPY is consolidating within a symmetrical triangle, a pattern commonly associated with periods of indecision and coiled momentum.
The Technical Setup
A symmetrical triangle forms when the price creates lower highs and higher lows, resulting in converging trendlines. Unlike directional patterns such as rising or falling wedges, symmetrical triangles are neutral by nature and can break either upward or downward. The tightening price action reflects a temporary equilibrium between buyers and sellers, typically followed by a breakout once either side gains control.
In SPY's case, the upper trendline is sloping downward while the lower trendline slopes upward. Price is currently moving within this narrowing range, with volatility compressing. This structure is a hallmark of market consolidation and is often seen ahead of larger directional moves.
Key Price Levels
While the triangle pattern itself does not predict direction, it does define key technical levels:
A breakout above the upper trendline would suggest renewed bullish momentum.
A breakdown below the lower trendline could indicate the start of a new downward move.
Traders and investors should watch for a strong daily close beyond the triangle boundaries, ideally supported by increased volume, which would signal conviction behind the move.
Volume and Market Context
The volume profile has been declining during the formation of this pattern, which is typical and further validates the setup. Volume contraction during consolidation is often followed by a surge when price breaks out, making volume a crucial secondary indicator for confirmation.
It’s also worth considering the broader market context. SPY has been recovering from its recent pullback, but resistance remains overhead. A confirmed breakout from this symmetrical triangle could act as a catalyst for continuation. On the other hand, a breakdown may open the door to further downside as support levels are tested.
Conclusion
SPY is at a technical crossroads. The symmetrical triangle pattern suggests that the current sideways movement will soon resolve into a more directional trend. Rather than predicting the outcome, traders should stay alert for a confirmed breakout or breakdown, supported by strong volume. This will provide the clearest signal on SPY’s next move and help define risk and reward going forward.
SPY/QQQ Plan Your Trade For 5-7 : Post FOMC UpdateThis video highlights a number of factors why I believe the markets are stalling and are likely to REVERT back to the 515-525 area on the SPY.
Without any real economic driving component, while tariffs and other concerns continue to play out, I believe the SPY will continue to search for Ultimate Support over the next 5-7+ months, then move into an upward reversion phase.
Part of what I'm trying to teach my followers is to try to understand how price operates in structures and phases.
Price only does two things: TRENDS or FLAGS
Within those phases, price structures (EPP, Cradle, and others) take over to determine how and why price may or may not attempt to make certain price moves.
Additionally, without any bias, or economic impetus (driver), price tends to REVERT.
In this video, I show you how to use the STDDEV channels to identify possible target areas for the different phases of market trend.
Ultimately, IMO, trading is about being able to see the price structure, phases, and path of least resistance (in terms of bias/expectations). This helps us position for the highest probability outcome (and hopefully for successful trades).
Remember, all of these techniques can be applied to intra-day charts the same way I'm applying them to Daily and Weekly charts.
Remember, price only does two things: TREND or FLAG.
Once you understand that, applying price structures/phases to price while it TRENDS or FLAGS helps you to gain a keen understanding of where price may target/move in the immediate future.
Hope this helps.
Get Some.
#trading #research #investing #tradingalgos #tradingsignals #cycles #fibonacci #elliotwave #modelingsystems #stocks #bitcoin #btcusd #cryptos #spy #gold #nq #investing #trading #spytrading #spymarket #tradingmarket #stockmarket #silver

STOCKS | MARKET WATCH | Why Long-Term Investing Still Wins🤯 The start of 2025 was a bit of a rollercoaster for stocks.
Global markets got seriously rattled in the first few months by some sudden jitters. When President Trump announced those aggressive tariffs, it caused significant concern among investors, sending stock markets tumbling and prompting a flight to safety. Like Reuters said, April was "epic" for crazy market swings – the VIX fear index shot up to levels we hadn't seen since 2020 and 2008, and then just as quickly dropped back down. Markets went wild.
But then, by late April, the panic kind of ... disappeared. Once President Trump paused the implementation of the most severe tariffs, stocks bounced back pretty sharply. The S&P 500 recovered most of what it lost. After that nasty drop, it ended April only about 5% lower than it started the year. The Nasdaq, with all its tech stocks, pretty much ended the month where it began. So, after all that drama, major US stock markets weren't far from their all-time highs, showing how fast that "fear" can vanish.
📊 How key indexes did
S&P 500 (USA): 📉 Dipped in early April but bounced back late. Ended April around -5% for the year, after almost hitting a bear market.
Nasdaq Composite (USA): 📉 Similar story. Tanked on the tariff scare, then rallied when things calmed down, ending April pretty much flat for the year.
MSCI World (Global developed markets): 🤷♂️ Had its ups and downs along with the US markets. By the end of April, it was pretty much flat for the year – no big moves for the overall world index.
MSCI Emerging Markets: 📉 Didn't do as well as developed markets. Asian stocks, especially, took a hit early April because of trade war worries, so this index lagged, even though it recovered a bit by the end of the month.
FTSE/JSE All-Share (South Africa): 🇿🇦 The odd one out! The JSE jumped about +5% in the first three months of 2025, mainly thanks to mining stocks. It even hit a record high in March. The April craziness shook it up too, but because it did so well earlier, it was still slightly up for the year by late April.
Takeaway? Global stocks were jumpy, but they mostly recovered. By late April, most major indexes were close to where they started the year. South Africa's market was the exception, having a good first quarter that helped it weather the April storm.
⏳ Staying invested beats trying to be a stock Wizard
All this back and forth can make investors nervous. You start thinking, "Should I just sell now before it drops even more?" But history usually says that's the wrong move. Just sticking with it usually works out better than trying to guess the market's next move. BlackRock's iShares recently pointed out that "waiting for the 'right time' to invest might mean missing out on the best days," while staying invested lets you benefit from that "compounding" thing and get through the short-term bumps. Simply put, if you sit on the sidelines during big swings, you often miss the big rebound days. One study even showed that if you missed just the five best market days over 20 years, you'd end up with way less money than someone who just stayed in the market.
The legendary investor Charlie Munger put it simply: "The first rule of compounding: never interrupt it unnecessarily." Trying to jump in and out of the market around all the volatility is super tough – the biggest up days often follow right after the biggest down days. On the other hand, patient investors who just ride out the noise tend to grab more of those long-term gains. After all, with compounding, those small gains build on each other over time.
💰 The awesome power of compounding over time
Compounding basically means the sooner you invest and the longer you stay invested, the more your returns build on each other like a snowball rolling downhill. For example, the total return JSE All-Share index was up almost 23% over the last year. That kind of gain shows how just staying invested during good times can really grow your wealth. If you'd panicked and pulled out, you would have missed most of that growth. Over longer periods, like 5 to 10 years, the JSE has almost always gone up. The big lesson is that it's about "time in the market," not trying to "time the market," that really makes your returns grow and smooths out those bumps along the way.
🌍 What's driving the markets and the economy
There were a few big things happening that explain why the markets moved the way they did.
🇺🇸 US GDP Slowdown: The US economy actually shrank a bit in the first quarter of 2025. A lot of people blamed this on a big surge in imports as businesses bought stuff ahead of those potential President Trump tariffs. Even though this news spooked the stock market briefly in late April, underlying consumer spending was still looking pretty decent.
📈 US Company Profits: On the bright side, US companies reported some pretty strong profits. Analysts were expecting good growth in earnings for the S&P 500 in the first quarter, even with the economic slowdown. And it turned out even better – a lot of companies beat expectations, and overall earnings were up quite a bit from last year. This helped keep stock prices from falling too much during the pullbacks.
🇪🇺 European Spending Boost: In Europe, governments are starting to spend more. Germany, for example, proposed a huge fund for infrastructure and energy. The EU is also loosening its spending rules and increasing defense budgets. Some experts think this could actually boost Europe's economic growth a bit each year, which would mean better profits for European companies. Some even think European companies might see faster profit growth than US companies in the next few years because of this spending.
🇨🇳 Asia and Trade Wars: Asia was the weak spot. China's economy showed some signs of trouble, with a survey suggesting its manufacturing activity might have shrunk in April after a couple of months of growth. This seemed to be a direct result of the US tariffs. Asian stock markets took a hit on the tariff news, which dragged down the overall emerging markets index. Basically, tariffs and trade tensions hurt growth in Asia and its markets, which then affected returns in emerging markets globally.
✅ The bottom line
Early 2025 reminded us that markets can freak out quickly – but they can often bounce back just as fast. The swings felt scary, but history tells us that just sticking with your investments usually pays off. Major stock markets are pretty much where they were a few months ago, while economies and company earnings are still moving forward. For long-term investors, that wild week in April just reinforced an old lesson: stay invested and let compounding do its thing. As some experts say, "get invested and stay invested" because the most volatile times often have the biggest market gains. By sticking to your plan, you avoid missing those big up days when the "fear" fades and markets recover.
_________________________
SP:SPX
Sources: Recent market reports and data including the April SATRIX 2025 market newsletter “Once Again, Volatility Blinked and Fear Lost., nasdaq.com, reuters.com, ishares.com, insight.factset.com, reuters.com, iol.co.za
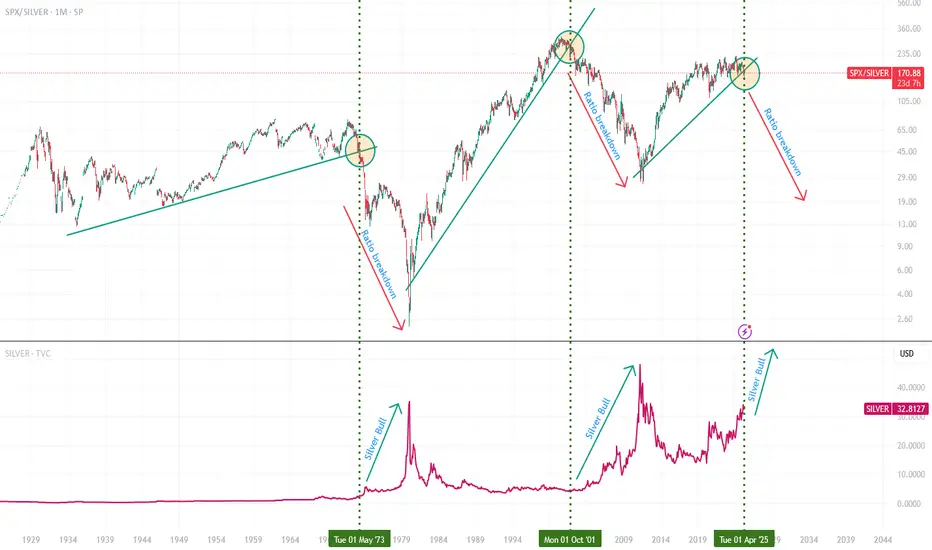
When the SPX/Silver ratio breaks down, Silver goes on a bull runThis is due to money moving out of the stock market, with investors taking profits and looking towards making money in undervalued assets. Silver is incredibly undervalued when compared to stocks and even gold.
SPY/QQQ Plan Your Trade Video For 5-7 : Breakaway In CounterToday's Breakaway In Counter Trend mode suggests the markets will likely attempt to break downward before the end of trading, today. Why do I state the downward trend direction?
Because the LT/ST trends are BULLISH and the general upward price trend in the SPY over the past 5-10+ days.
Counter-trend patterns are typically inverted compared to the general 5-8 day price trend. If we can't clearly identify a 5-8 day price trend, then the counter-trend patterns should be determined based on the ST/LT and BIAS trend information on the SPY Cycle Patterns data window.
Today, being a FOMC comment day, should stay rather muted/sideways in early trading. Normally, on FOMC days, the markets tend to stay paused ahead of the FOMC comments.
I believe the FED will not raise or lower rates - meaning NO CHANGE. I don't believe the US Fed has any reason to be concerned with US economic performance right now.
Gold and Silver should move into a rally phase today - but that will likely come near the end of the day as the FED comments drive the markets.
BTCUSD has moved into an early FLAGGING formation. This could be very interesting as BTCUSD has been leading the SPY/QQQ by about 4-6 trading days over the past few weeks.
If BTCUSD continues to lead the SPY/QQQ - that means the SPY/QQQ would be in the early breakdown phase right now - moving into a FLAGGING formation possibly next week.
Get some.
#trading #research #investing #tradingalgos #tradingsignals #cycles #fibonacci #elliotwave #modelingsystems #stocks #bitcoin #btcusd #cryptos #spy #gold #nq #investing #trading #spytrading #spymarket #tradingmarket #stockmarket #silver

SPX is going to 6000 (If maintains 5565)Spx is going to 6000 level, if it maintains level of 5565.
Note: This is not a buy/sell trade call.
S&P 500 Bearish Reversal Setup: Short Entry Below Key ResistanceEntry Point: Around 5,678.79
Stop Loss: Around 5,833.61 (above recent resistance zone)
Target Point: Around 4,831.37 (indicating a bearish target)
2. Technical Patterns:
The price hit a resistance zone (highlighted in purple) and reversed—this is often a bearish signal.
The trendline break (marked with the orange dot and blue arrow down) suggests a potential trend reversal.
The moving averages (likely 50 EMA and 200 EMA) indicate the price is still above the support zone but weakening.
3. Risk/Reward Ratio:
Risk (Stop Loss – Entry): ~154.82 points
Reward (Entry – Target): ~847.42 points
Risk/Reward Ratio: Approximately 1:5.5, which is favorable for shorting.
4. Trade Sentiment:
Bearish bias based on the breakdown from the resistance zone and confirmation from chart patterns.
If the price fails to hold above 5,682.87, a short trade may be validated with the target at 4,831.37.

SPX at a Tipping Point Rising Wedge Meets 200 EMAThe SPX is currently trading within a rising wedge a bearish pattern that typically signals exhaustion of upward momentum. Price has now stalled right at the 200 EMA, a key dynamic resistance level, and today's close came just beneath it.
If this rising wedge breaks to the downside especially with a confirmed rejection from the 200 EMA we could see accelerated selling. The next key support level to watch is $5,438.43. A breakdown from here would likely test that zone quickly.
This setup follows our earlier call from March 27, where we highlighted the $4,790 area as a bottom nearly nailed to the point. From that low, SPX rallied, but now the structure is showing signs of strain.
We’re at a decision point: hold the 200 EMA and potentially break higher or confirm the wedge breakdown and begin a new leg down.

$SPX Rejection at Resistance – Watch 5582 for the Next Major Mov📉 After tagging the 5685–5750 resistance zone, SP:SPX is flashing major downside risk.
🔍 Key Zones:
✅ Resistance tapped: 5705–5838
🟨 FVG (Fair Value Gap): 5642–5582
❗ Daily close below 5582 → Bearish WXY structure confirmed
🟥 Hard invalidation for bulls: 4835.04
💡 I’m open to a retest of the 200DMA (currently 5746), but below 5582 I wouldn’t expect a new high.
This setup offers clear structure, risk-defined short entries, and a measured breakdown scenario if support fails.

Looking for One More High So far, our minor B wave price action has not thrown us any curveballs, which is somewhat unusual considering B waves can become very complex. As I get into the micro price action, this pattern would fit better completed with at least one more high.
Nonetheless, I will offer a warning, we are in the target box...if you are long, please use stops, and make sure your position size is risk managed.
Best to all,
Chris

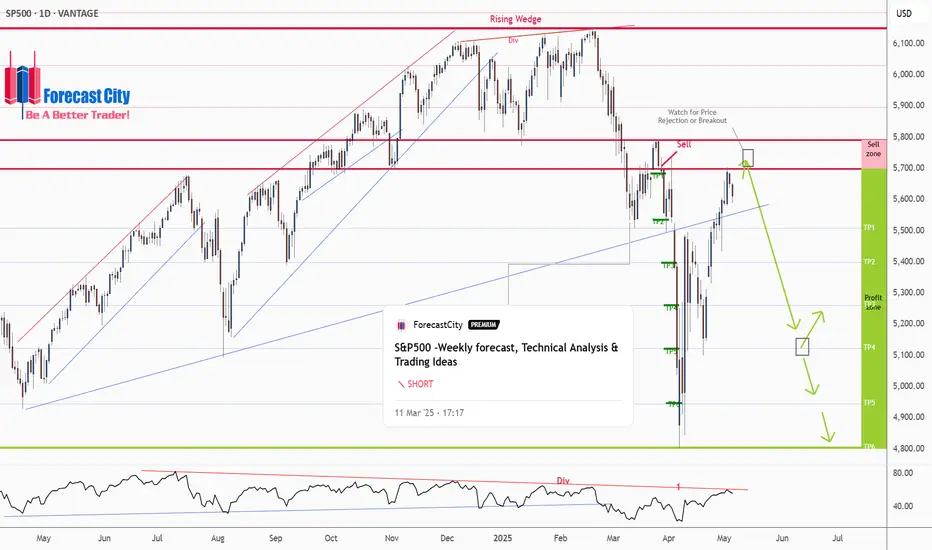
S&P500 -Weekly forecast, Technical Analysis & Trading IdeasPrevious forecast result:
As you can see in the 4CastMachine forecast on 12/03/2025, the price, after rejecting the sell zone, began its sharp decline and touched all TPs.
Midterm forecast:
While the price is below the resistance 6149.57, resumption of downtrend is expected.
We make sure when the support at 4804.01 breaks.
If the resistance at 6149.57 is broken, the short-term forecast -resumption of downtrend- will be invalid. CSEMA:S&P
Technical analysis:
While the RSI downtrend #1 is not broken, bearish wave in price would continue.
A trough is formed in daily chart at 4807.10 on 04/07/2025, so more gains to resistance(s) 5698.65, 5791.00, 5896.50 and maximum to Major Resistance (6149.57) is expected.
Price is above WEMA21, if price drops more, this line can act as dynamic support against more losses.
Relative strength index (RSI) is 55.
Take Profits:
5509.32
5363.90
5261.00
5122.47
4944.41
4804.01
__________________________________________________________________
❤️ If you find this helpful and want more FREE forecasts in TradingView,
. . . . . . . . Hit the 'BOOST' button 👍
. . . . . . . . . . . Drop some feedback in the comments below! (e.g., What did you find most useful? How can we improve?)
🙏 Your support is appreciated!
Now, it's your turn!
Be sure to leave a comment; let us know how you see this opportunity and forecast.
Have a successful week,
ForecastCity Support Team
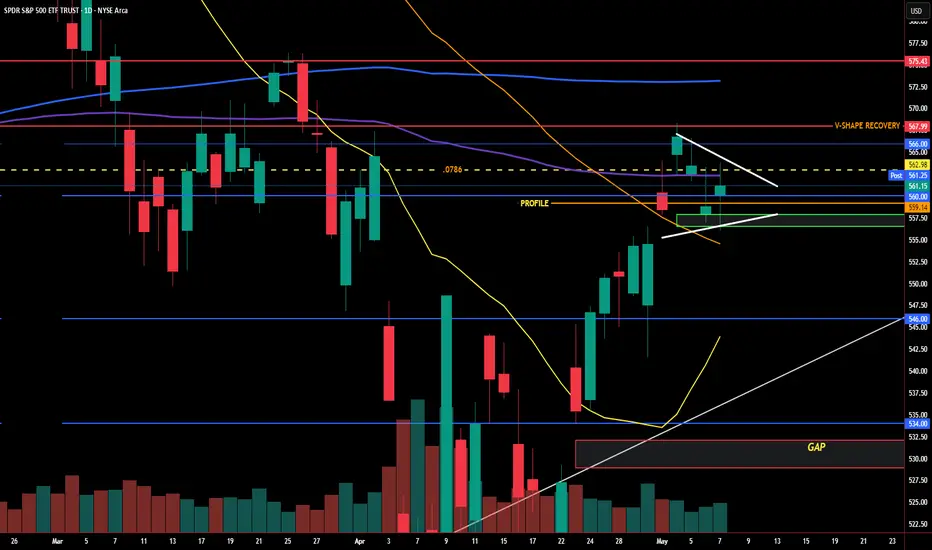
SPY/QQQ Plan Your Trade For 5-6 : GAP Breakaway patternToday's pattern suggests a morning GAP will take place and price will continue to break away from yesterday's body range.
Given the fact that the markets are already almost 0.8-0.9% lower than yesterday's closing price level, this suggests the markets will continue to trend downward today.
Is this it? Is this the breakdown for May 2-5, seeking the Major Bottom I've talked about for the past 3+ weeks?
We'll find out over the next 5-10+ days.
Ultimately, the EPP patterns have aligned across multiple instruments/symbols to present a very clear opportunity to the downside. Now, we need to watch and wait as the markets should be moving into the early FLAGGING stage of the downward EPP pattern.
After the FLAGGING pattern, we should get the breakdown into consolidation, which is where I believe big profits can be made. That breakdown into the consolidation phase is usually very aggressive and can often be after the FLAGGING range.
Gold and Silver are making a move higher. I suggested this would be the case over the past 5-10+ days - but, boy, was it frustrating to watch Gold and Silver consolidate over the past few weeks.
At this point, I'm looking for Gold to rally above $3500 and for Silver to attempt to rally above $34.00.
Bitcoin seems to be leading the SPY/QQQ (again) and appears to be about 2-3 days ahead of the major US indexes, attempting to move into a downward FLAGGING formation.
This could be very interesting if BTCUSD continues to lead the SPY/QQQ. Meaning, we may be able to rely on the structures/setups in BTCUSD as a 2-3 day early window of that the SPY/QQQ may be doing (for a while). I'm sure it won't continue to align at some point in the future.
Again, I'm getting great comments from followers and subscribers. Thank you.
I'm doing my best to deliver the best research I can within these 15 to 20-min videos.
Get some.
#trading #research #investing #tradingalgos #tradingsignals #cycles #fibonacci #elliotwave #modelingsystems #stocks #bitcoin #btcusd #cryptos #spy #gold #nq #investing #trading #spytrading #spymarket #tradingmarket #stockmarket #silver

S&P500 INTRADAY resistance at 5510US stock futures are signaling a second straight day of losses. Palantir shares dropped 9% pre-market after its earnings disappointed high expectations. Ford also fell, withdrawing its financial guidance and warning that new tariffs would hurt profitability.
In Europe, political uncertainty hit German markets as Friedrich Merz failed to secure a majority vote to become Germany’s next chancellor, delaying his swearing-in and shaking investor confidence. The DAX index slid 1.4% on the news.
Meanwhile, EU-US trade tensions are intensifying. The European Union expects new US trade probes could expose up to €549 billion ($622 billion) worth of EU exports to American tariffs, adding pressure to already strained transatlantic negotiations.
Key Support and Resistance Levels
Resistance Level 1: 5693
Resistance Level 2: 5780
Resistance Level 3: 5876
Support Level 1: 5512
Support Level 2: 5438
Support Level 3: 5390
This communication is for informational purposes only and should not be viewed as any form of recommendation as to a particular course of action or as investment advice. It is not intended as an offer or solicitation for the purchase or sale of any financial instrument or as an official confirmation of any transaction. Opinions, estimates and assumptions expressed herein are made as of the date of this communication and are subject to change without notice. This communication has been prepared based upon information, including market prices, data and other information, believed to be reliable; however, Trade Nation does not warrant its completeness or accuracy. All market prices and market data contained in or attached to this communication are indicative and subject to change without notice.

#ES1! "E-Mini S&P500" Index Market Bullish Robbery Plan🌟Hi! Hola! Ola! Bonjour! Hallo! Marhaba!🌟
Dear Money Makers & Robbers, 🤑 💰💸✈️
Based on 🔥Thief Trading style technical and fundamental analysis🔥, here is our master plan to heist the #ES1! "E-Mini S&P500" Index Market Heist. Please adhere to the strategy I've outlined in the chart, which emphasizes long entry. Our aim is to escape near the high-risk YELLOW MA Zone. It's a Risky level, overbought market, consolidation, trend reversal, trap at the level where traders and bearish robbers are stronger. 🏆💸"Take profit and treat yourself, traders. You deserve it!💪🏆🎉
Entry 📈 : "The vault is wide open! Swipe the Bullish loot at any price - the heist is on!
however I advise to Place buy limit orders within a 15 or 30 minute timeframe most recent or swing, low or high level. I Highly recommended you to put alert in your chart.
Stop Loss 🛑:
Thief SL placed at the Nearest / Swing low level Using the 3H timeframe (5440) Day/Swing trade basis.
SL is based on your risk of the trade, lot size and how many multiple orders you have to take.
🏴☠️Target 🎯: 5730
💰💵💸#ES1! "E-Mini S&P500" Index Money Heist Plan is currently experiencing a bullishness,., driven by several key factors. .☝☝☝
📰🗞️Get & Read the Fundamental, Macro Economics, COT Report, Geopolitical and News Analysis, Sentimental Outlook, Intermarket Analysis, Index-Specific Analysis, Future trend targets with Overall outlook score... go ahead to check 👉👉👉🔗🔗🌎🌏🗺
⚠️Trading Alert : News Releases and Position Management 📰🗞️🚫🚏
As a reminder, news releases can have a significant impact on market prices and volatility. To minimize potential losses and protect your running positions,
we recommend the following:
Avoid taking new trades during news releases
Use trailing stop-loss orders to protect your running positions and lock in profits
💖Supporting our robbery plan 💥Hit the Boost Button💥 will enable us to effortlessly make and steal money 💰💵. Boost the strength of our robbery team. Every day in this market make money with ease by using the Thief Trading Style.🏆💪🤝❤️🎉🚀
I'll see you soon with another heist plan, so stay tuned 🤑🐱👤🤗🤩
SPX500 D1 I Bullish Bounce Based on the D1 chart analysis, the price is falling our buy entry level at 5492.54, a pullback support.
Our take profit is set at 5797.53, an overlap resistance.
The stop loss is placed at 5386, a pullback support.
High Risk Investment Warning
Trading Forex/CFDs on margin carries a high level of risk and may not be suitable for all investors. Leverage can work against you.
Stratos Markets Limited (tradu.com):
CFDs are complex instruments and come with a high risk of losing money rapidly due to leverage. 63% of retail investor accounts lose money when trading CFDs with this provider. You should consider whether you understand how CFDs work and whether you can afford to take the high risk of losing your money.
Stratos Europe Ltd (tradu.com):
CFDs are complex instruments and come with a high risk of losing money rapidly due to leverage. 63% of retail investor accounts lose money when trading CFDs with this provider. You should consider whether you understand how CFDs work and whether you can afford to take the high risk of losing your money.
Stratos Global LLC (tradu.com):
Losses can exceed deposits.
Please be advised that the information presented on TradingView is provided to Tradu (‘Company’, ‘we’) by a third-party provider (‘TFA Global Pte Ltd’). Please be reminded that you are solely responsible for the trading decisions on your account. There is a very high degree of risk involved in trading. Any information and/or content is intended entirely for research, educational and informational purposes only and does not constitute investment or consultation advice or investment strategy. The information is not tailored to the investment needs of any specific person and therefore does not involve a consideration of any of the investment objectives, financial situation or needs of any viewer that may receive it. Kindly also note that past performance is not a reliable indicator of future results. Actual results may differ materially from those anticipated in forward-looking or past performance statements. We assume no liability as to the accuracy or completeness of any of the information and/or content provided herein and the Company cannot be held responsible for any omission, mistake nor for any loss or damage including without limitation to any loss of profit which may arise from reliance on any information supplied by TFA Global Pte Ltd.
The speaker(s) is neither an employee, agent nor representative of Tradu and is therefore acting independently. The opinions given are their own, constitute general market commentary, and do not constitute the opinion or advice of Tradu or any form of personal or investment advice. Tradu neither endorses nor guarantees offerings of third-party speakers, nor is Tradu responsible for the content, veracity or opinions of third-party speakers, presenters or participants.

Little Rest For SPXI think the SPX structure is more prone to bearishness. There is a structure that will probably move quickly in one direction. I don't think a good structure has been formed for a bottom. And the rise does not seem very strong. For this reason, I expect an increase after the first fall.
Since this situation will probably reflect on crypto, my bearish contracts are still in place. But I am thinking of buying a bullish contract until the FOMC time.