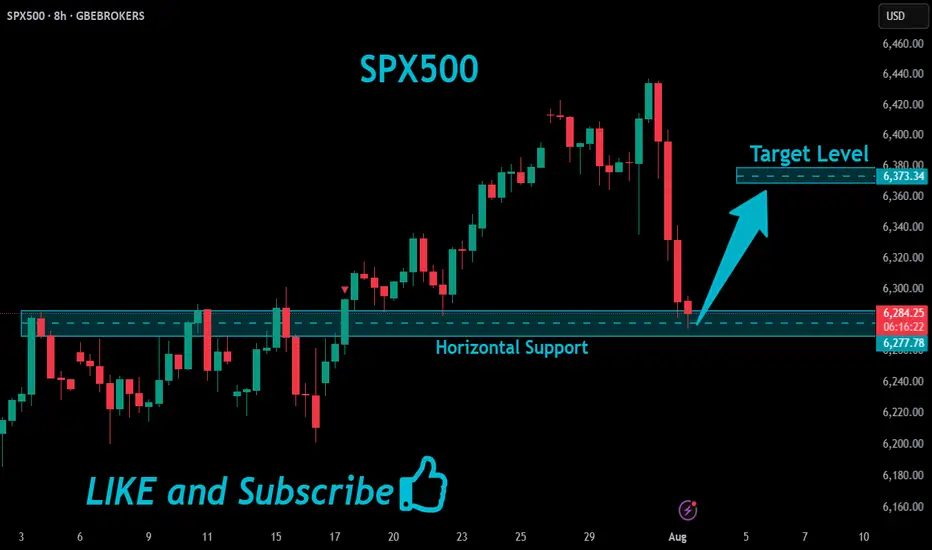
SPX500 Will Go UP!
HI,Traders !
#SPX500 made a retest
Of the horizontal support
Level of 6277.78 and we
Are already seeing a
Bullish rebound so we are
Locally bullish biased and
We will be expecting a
Further bullish move up !
Comment and subscribe to help us grow !
Spx500forecast
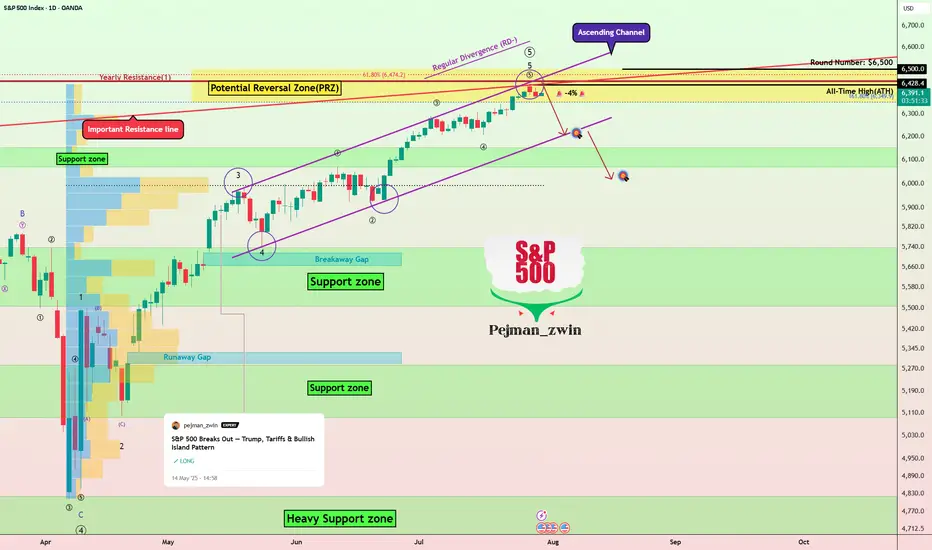
S&P500’s Bullish Island Turns Risky: Elliott Wave Says “Top”The S&P500 Index( SP:SPX ) started to rise and even created a new All-Time High(ATH=$6,428) with the help of the Bullish Long Island Pattern , as I published in my previous idea on May 14, 2025 .
The S&P500 Index is currently moving near the Potential Reversal Zone(PRZ) , upper line of the ascending channel , the Important Resistance line , and the Yearly Resistance(1) .
In terms of Elliott Wave theory , the S&P500 Index appears to be completing microwave 5 of microwave 5 of the main wave 5 .
Also, we can see the Regular Divergence(RD-) between Consecutive Peaks .
I expect the S&P500 Index to correct at least -4% and fall to the lower line of the ascending channel .
First Target: $6,233
Second Target: $6,033
Note: Stop Loss(SL) $6,513
Do you think S&P500 Index can create a new ATH above $6,500 !?
Please respect each other's ideas and express them politely if you agree or disagree.
S&P 500 Index Analyze (SPX500USD), Daily time frame.
Be sure to follow the updated ideas.
Do not forget to put a Stop loss for your positions (For every position you want to open).
Please follow your strategy and updates; this is just my Idea, and I will gladly see your ideas in this post.
Please do not forget the ✅' like '✅ button 🙏😊 & Share it with your friends; thanks, and Trade safe.
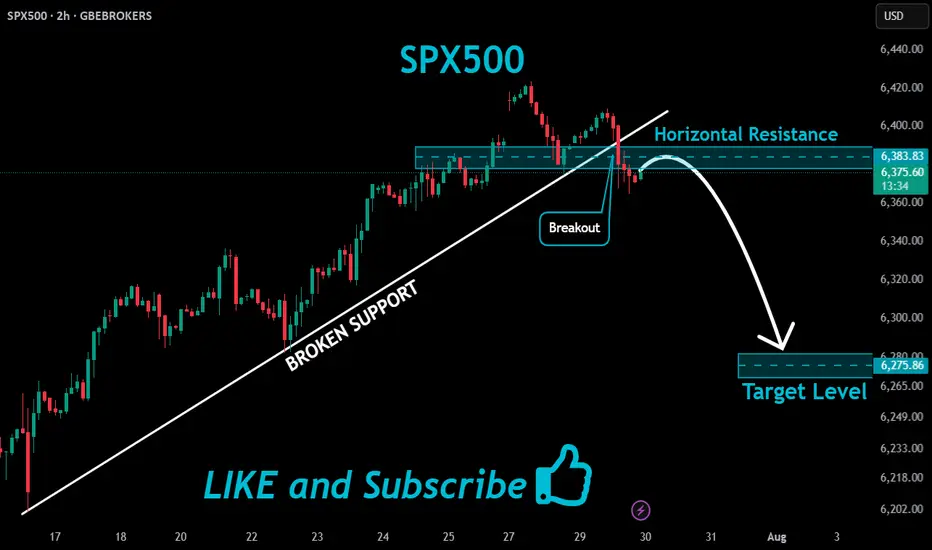
SPX500 Bearish Bias!
HI,Traders !
#SPX500 broke both the
Rising and horizontal
Support line which are
Now resistance areas
And the breakout is
Confirmed so we are
Bearish biased and we
Will be expecting a
Further bearish move down !
Comment and subscribe to help us grow !
New All-Time Highs for S&P 500 – No Resistance AheadThe S&P 500 is officially in price discovery mode, printing new all-time highs with clean higher highs and higher lows.
Each old resistance flipped into strong support—textbook bullish market structure.
As long as this trend holds, there's no ceiling in sight. Bulls are fully in control.

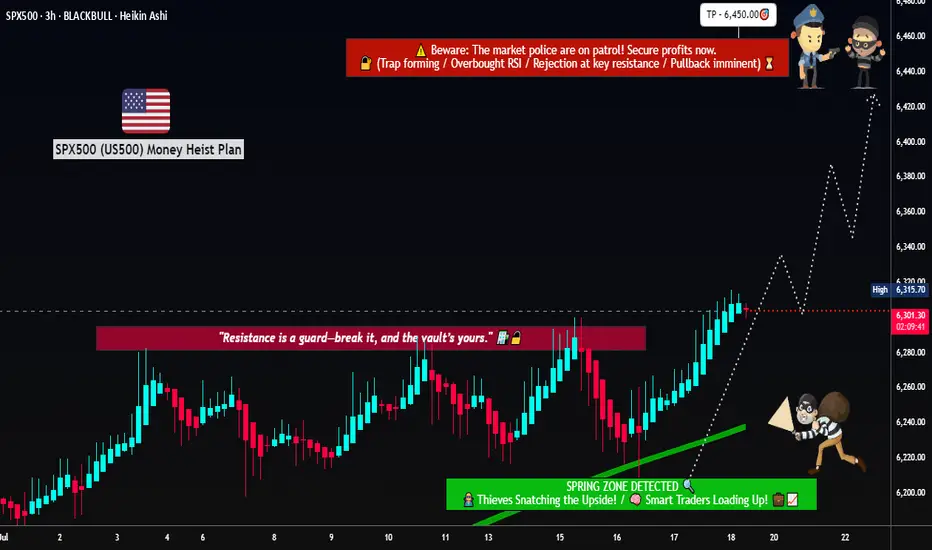
Rob the Rally SPX500: Enter Before Resistance Catches You🦹♂️💰**“SPX500 Street Heist” – Thief-Style Robbery Plan for Bulls!**📈💸
(Powered by Thief Trader's Market Robbing Tactics – Scalp | Swing | Day Trade Edition)
🌍Hello, Global Money Hunters!
📣 Salaam, Bonjour, Ola, Hola, Hallo, Marhaba & Welcome to the heist floor! 🎩💼
Thief Trader is back again with a loaded plan to rob the market clean — this time targeting the mighty SPX500 / US500 🎯. Based on a fusion of technical setups, macro sentiment, and the Thief Trading System, we’ve set our sights on the next breakout vault of Wall Street.
🎯 The Gameplan – Heist the Resistance Vault
The index is entering a high-risk resistance barricade — overbought, consolidated, and heavily guarded by bearish robbers (sellers). This is the zone where the market police lurk and trend reversals often get triggered. However, smart thieves always plan with precision.
Here’s the mission briefing:
🔓Entry Zone (Break-in Point)
💥 “The vault is open — grab the bullish loot!”
Enter Long anywhere close to market price or on pullbacks near recent swing lows/highs.
Preferred timeframes: 15-min to 30-min for sniper-level accuracy.
Deploy DCA-style limit orders (layered entries for maximum control).
🛑Stop Loss (Escape Hatch)
Base SL on recent swing low candle wicks on the 4H timeframe.
Suggested: ~6250.00 — but adapt based on your risk appetite, lot size, and position stacking.
📈Target / Loot Location
🎯 Primary Take-Profit: 6450.00
Or… pull out early if you spot resistance fighters guarding the vault.
Use trailing SL to secure gains and manage getaway.
⚡Scalper’s Notice
Only Long-side allowed!
Got big capital? Jump in now.
Running low? Tag along with swing traders and follow the robbery protocol.
Always protect your bag with dynamic trailing stops.
🧠Fundamental Fuel Behind the Plan
Bullish sentiment across major indices
Macro trends, COT positioning, sentiment outlook, and intermarket analysis all greenlit
Geopolitical and Fed tone supportive — tap into real data before entering
👉 Always analyze: News, Fundamentals, Sentiment, COT reports, and macro conditions.
🚨NEWS ZONE ALERT – No Loud Moves!
Avoid entry during major economic news drops
Use trailing SLs to guard profits
Don’t let your open trades get caught in the chaos of news releases!
💥Let’s Boost the Thief Army!
Smash the BOOST button 💖 to power up the robbery crew.
Support the strategy, share the love, and stay ahead of the game using Thief Trading Style. Every trade is a step closer to freedom from financial traps. 🚀💰🎉
📌Disclaimer: This is a general market analysis for educational purposes and should not be considered personal financial advice. Please evaluate your own risk management strategy before placing trades.
📌Markets shift fast — stay flexible, stay alert, and always rob smart.
🔥Stay locked in for the next heist plan — Thief Trader signing off for now…
💸💼📈 Trade smart. Rob harder. 🤑🦹♂️📊
S&P 500 Counter-Trend Setup After Bullish Week US500Currently watching the S&P 500 (US500) closely 👀. The index has been in a strong bullish trend 📈, but I’m now evaluating a potential counter-trend opportunity.
Given the strength we’ve seen this week — possibly a “foolish rally” — there’s a chance we’ve either printed or are close to printing the high of the week 🧱. That opens the door for a retracement setup, particularly as we head into Monday’s open 🗓️.
🧠 Trade idea: If we get a bearish market structure break, I’ll be looking to enter short — targeting a 1R take profit initially, and holding a portion for a 2R–3R extension 🎯.
Friday sessions, especially after strong trends, often present clean intraday pullbacks — and when Monday’s low is set early, it can trap late buyers and fuel the move 📉.
⚠️ This is not financial advice — just sharing my thought process and trade plan.

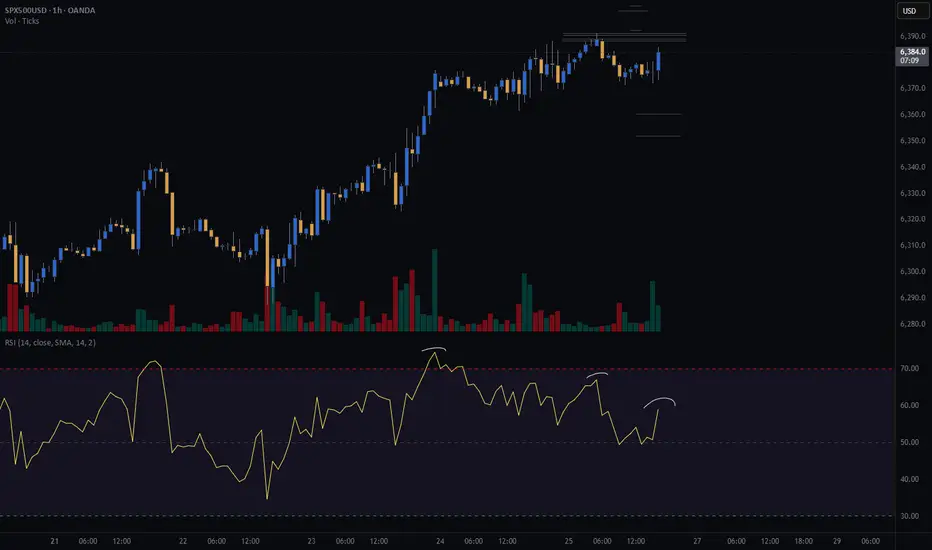
S&P 500 (CASH500) - Double Top H1Risk/reward = 2.7
Entry price = 6388.4
Stop loss price = 6399.7
Take profit level 1 (50%) = 6360.4
Take profit level 2 (50%) = 6352
Also, waiting on confirmation on some variables
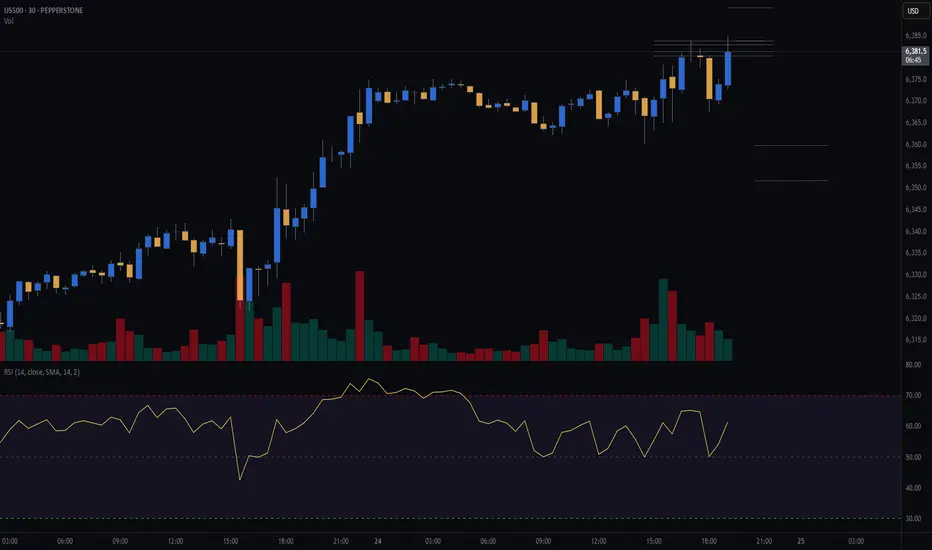
S&P (CASH500) SHORT - Double top 30minRisk/reward = 2.7
Entry price = 6384
Stop loss price = 6393.8
Take profit level 1 (50%) = 6359.8
Take profit level 2 (50%) = 6351.8
Will get confirmation of remaining variables at close of this 30min candle at 19.30.
SPX500 Short From Resistance!
HI,Traders !
#SPX500 is trading in an
Uptrend but the price will
Soon hit a horizontal resistance
Area around 6285.44 from
Where we will be expecting
A local bearish correction !
Comment and subscribe to help us grow !

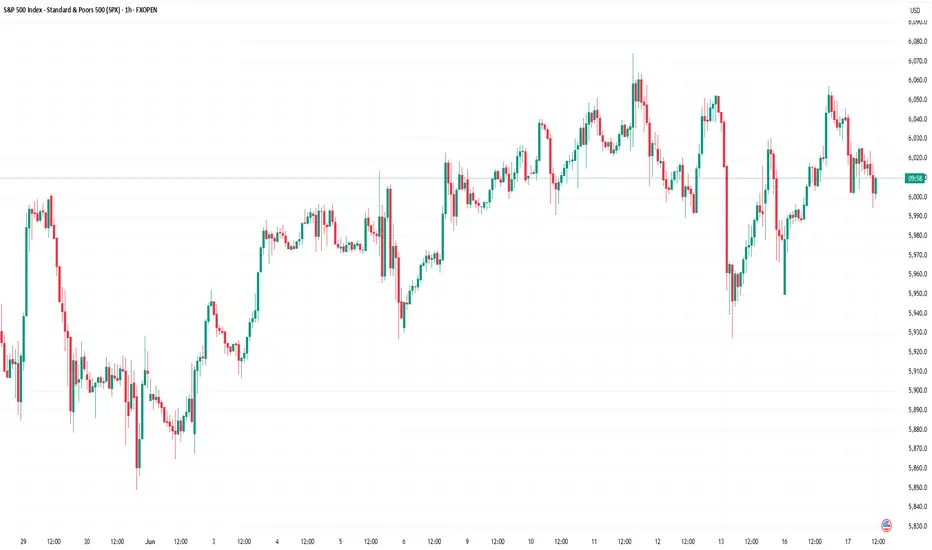
Equity Markets Ahead of the US Inflation ReportEquity Markets Ahead of the US Inflation Report
Today at 15:30 GMT+3, the US inflation report (Consumer Price Index, or CPI) is scheduled for release. According to ForexFactory, analysts expect the inflation rate to rise from 2.4% to 2.6%.
The actual figures will provide market participants with grounds to debate not only the likelihood of a Federal Reserve rate cut, but also the evolving tensions between Donald Trump and Jerome Powell.
Should the report deliver any surprises, it will almost certainly trigger heightened volatility across the equity markets. For now, however, investors are seemingly optimistic about the upcoming fundamental data — especially given the commencement of Q2 earnings season, which lends additional weight to today’s macroeconomic indicators.
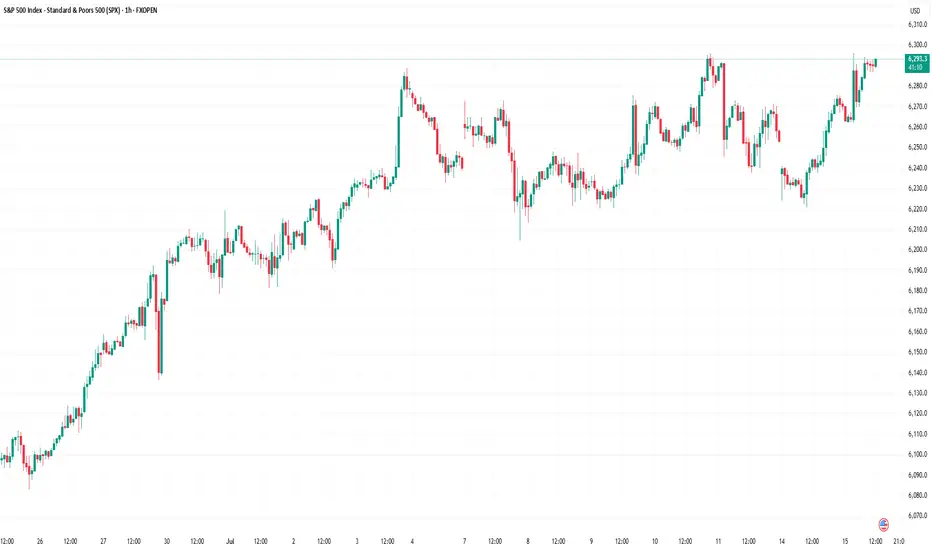
Technical Analysis of the S&P 500 Chart
The S&P 500 chart (US SPX 500 mini on FXOpen) shows the index fluctuating within a range defined by support at 6,222 and resistance at 6,290.
The upward impulses (as indicated by arrows) suggest that:
→ current market optimism, combined with the CPI release, may lead to a bullish breakout above resistance and the establishment of a new all-time high;
→ in a broader context, such a breakout could be interpreted as a continuation of the rally that began in April, following a period of consolidation between the aforementioned levels.
This article represents the opinion of the Companies operating under the FXOpen brand only. It is not to be construed as an offer, solicitation, or recommendation with respect to products and services provided by the Companies operating under the FXOpen brand, nor is it to be considered financial advice.
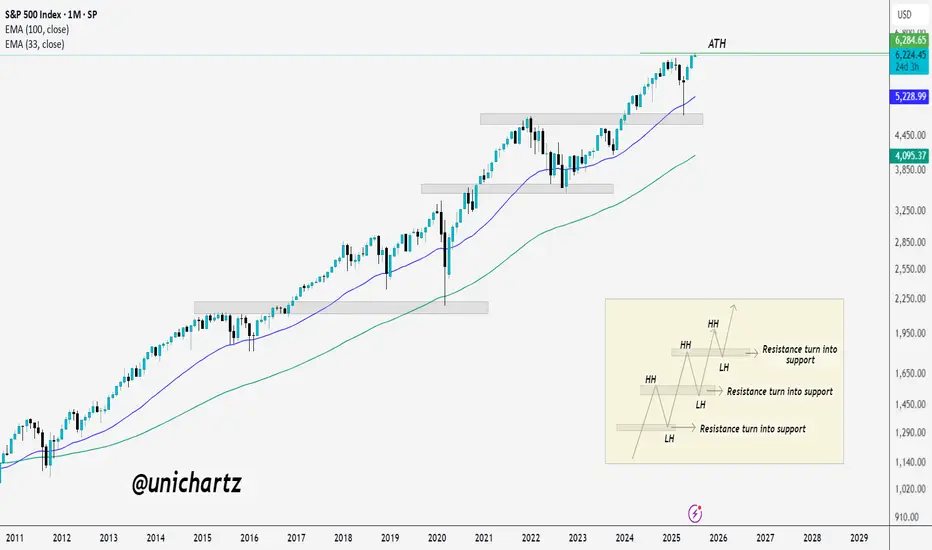
Decade-Long Uptrend Holds Strong – SPX Hits Fresh HighsS&P 500 Just Hit a New All-Time High (ATH) 🚀
The index has been in a strong uptrend for over a decade, consistently printing higher highs (HH) and higher lows (HL).
Every major resistance level has flipped into support, classic bull market structure.
Even during corrections, the 33 EMA and 100 EMA have acted like dynamic support zones.
Now that SPX has cleared its previous ATH, the structure remains intact, unless a strong breakdown occurs, momentum is still with the bulls.
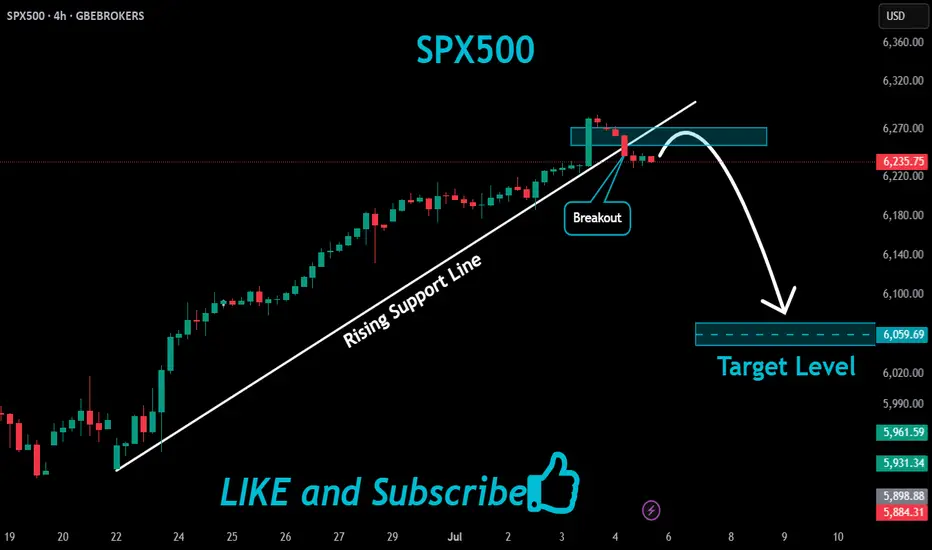
SPX500 Bearish Breakout!
HI,Traders !
#SPX500 was trading along
The rising support line but
Now we are seeing a bearish
Breakout so we are bearish
Biased and we will be expecting
A further bearish move down !
Comment and subscribe to help us grow !
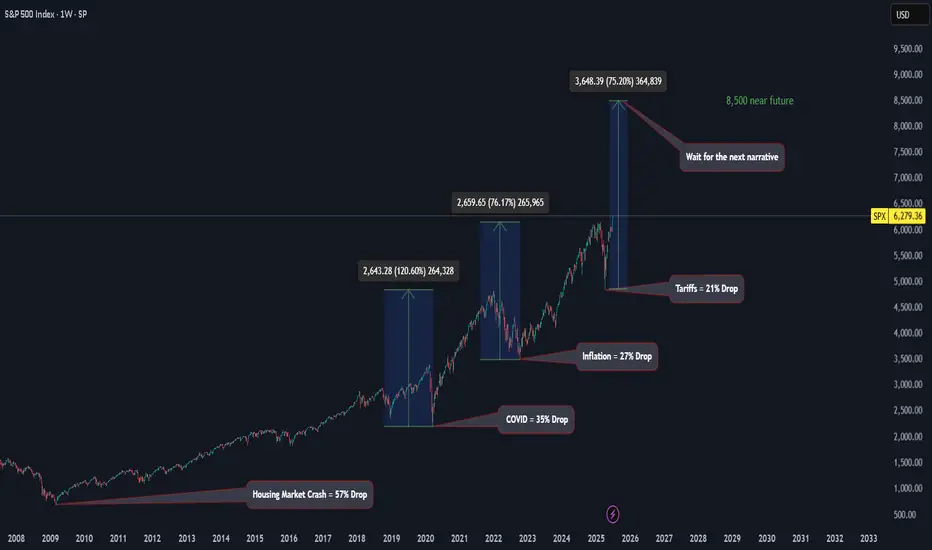
SPX Expansion with Historical DataGood morning everyone!
This week I wanted to elaborate more on my previous idea of SPX with the historical data that led to this analysis. This is almost all fundamental analysis adding in the retracement percentages which can also be evaluated through some technical instruments.
Unemployment rate is currently at 4.1%, with inflation at 2.4%. Based on the data, it is evident the market is currently in an expansion period which is why the narrative that we will see 2 interest rate drops by the end of year continues to diminish. I think we will probably see 1 before the year ends and that would just fuel the market and gain momentum to the upside.
If we were to measure the expansion of SPX going back to the 2000's, we get an extension of at least 75%. If we were to extend 75% based on the previous swing high (6,147) we could see future SPX price at 8,500. Now, do your own research, but the data is here. I expect the market to possibly retest previous high, but if you did not enter during the dip, no worries. There is still plenty of upside potential and better late than never.
Remember... CASH FLOW IS KING!
Avoid all the noise and distractions. The job of many platforms out there is to have something to put out for the public EVERYDAY! A good amount of that is noise. Look for macroeconomic news and let that be your indicator.
Historical Data:
(1) .com Bubble (2000 - 2002) We had a 50% drop of SPX. This lasted for almost 2 years before recovery.
(2) Housing Market (2007 - 2009) The SPX dropped 57% due to the collapse of subprime lenders collapsing. Housing prices decline drastically leaving people with high mortgage payments than what their homes are actually worth leading to a wave of foreclosures.
(3) Covid (2020) This was a global event with government mandated shutdowns causing the entire financial markets to come to a halt. Many business closures that led to jobs loss with an unemployment rate of approximately 15%.
(4) Inflation & Rate Hikes (2022) When Covid happened, upon recovery market expanded way too fast causing inflation to rise and the Feds to increase interest rates to slow down the economy.
(5) Tariffs (2025) Will stay away from politics on this one, however, a rebalancing of trade has taken place with some countries still working on tariff deals with the U.S. This has caused huge uncertainty for companies and corporation. VIX (fear index) reached 60.13.
Hope you enjoyed this post. Have a great rest of your week, don't forget to like and follow and Happy Trading!
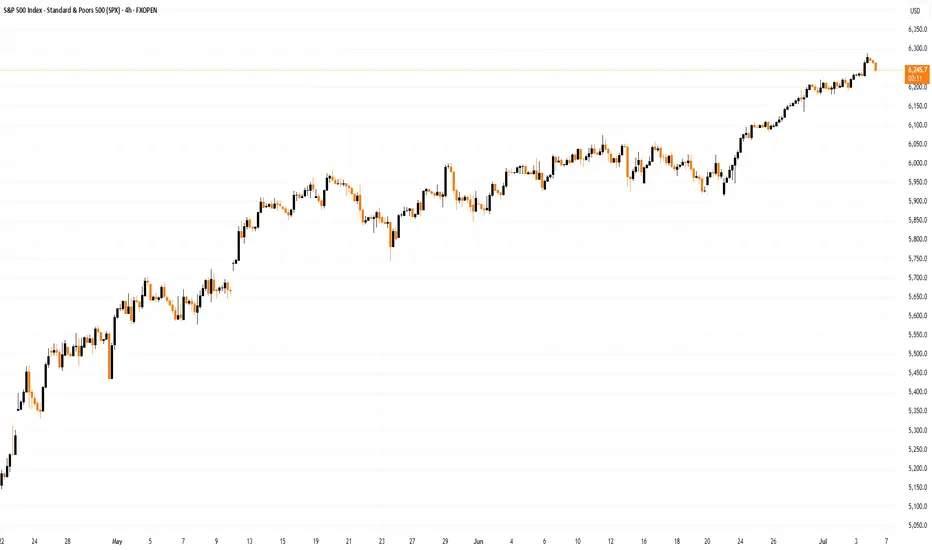
S&P 500 Hit Record High Ahead of Holiday BreakS&P 500 Hit Record High Ahead of Holiday Break
Today, financial markets in the United States are closed in observance of Independence Day. Investor sentiment was likely buoyed by the latest rally in the S&P 500 index (US SPX 500 mini on FXOpen), which set a new all-time high yesterday, surpassing 6,280.
The bullish momentum has been driven by robust labour market data in the US. According to ForexFactory, analysts had anticipated a rise in the unemployment rate from 4.2% to 4.3%, but instead, it unexpectedly declined to 4.1%.
Can the stock market continue to climb?
Technical Analysis of the S&P 500 Chart
Analysing the 4-hour chart of the S&P 500 index (US SPX 500 mini on FXOpen)on 30 June, we observed the following:
→ An ascending channel was formed (indicated in blue);
→ A developing bullish impulse (marked with an orange line) suggested the price would move towards the upper boundary of the channel – a scenario that materialised with yesterday’s rally (as shown by arrow 1).
However, from a price action perspective, the recent downward move (arrow 2) has now gained significance. It may indicate that sellers are becoming more active around the identified resistance level.
Should the price decline towards the lower orange line, this could negate the current bullish impulse altogether, effectively reflecting a classic bearish engulfing pattern.
Given the above, there is reason to believe that bears are attempting to regain control after the S&P 500 (US SPX 500 mini on FXOpen) surged over 5% in the past 10 days. As such, a potential breakout below the orange line cannot be ruled out, with price action possibly targeting the median of the blue ascending channel.
What happens next?
The market’s trajectory will largely hinge on developments related to tariffs. Trade policy will remain in the spotlight next week, as key deadlines set by the White House approach — events that traders will be closely monitoring.
This article represents the opinion of the Companies operating under the FXOpen brand only. It is not to be construed as an offer, solicitation, or recommendation with respect to products and services provided by the Companies operating under the FXOpen brand, nor is it to be considered financial advice.
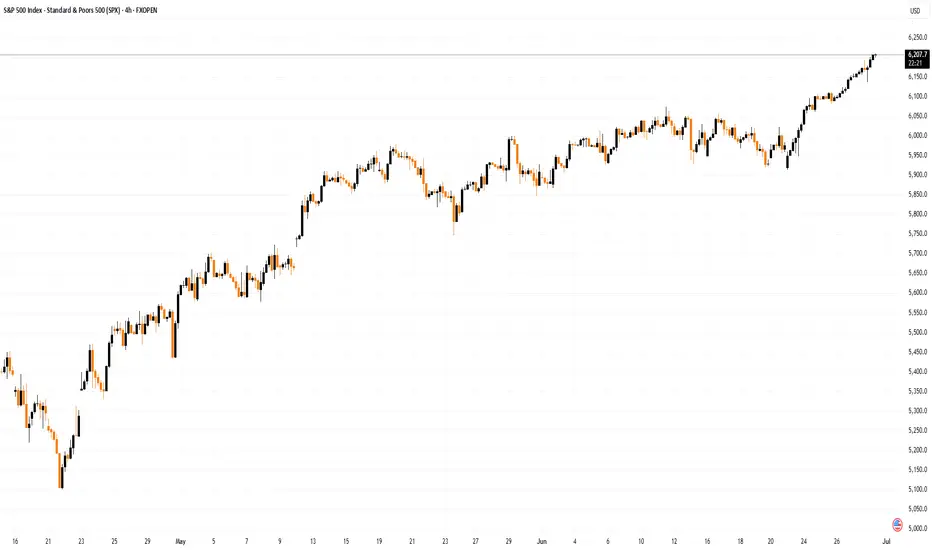
S&P 500 Sets New All-Time High, Surges Above 6200S&P 500 Sets New All-Time High, Surges Above 6200
The S&P 500 index (US SPX 500 mini on FXOpen) started the week by reaching a fresh all-time high. As shown on the chart, the index hit 6,210 points earlier this morning.
In addition to a reduced risk of US involvement in a large-scale war in the Middle East, market optimism has been fuelled by:
→ Tariff-related news. Last week, the US President announced the signing of a trade deal with China, while Treasury Secretary Scott Bessent expressed hope that the US would conclude trade negotiations with over a dozen countries by early September.
→ Strong corporate performance. On Friday, Nike (NKE) shares led the stock market, rising by more than 15% following an earnings report that exceeded analysts’ expectations. This could be boosting investor sentiment ahead of the upcoming earnings season.
Technical Analysis of the S&P 500 Chart
Evaluating the 4-hour chart of the S&P 500 index (US SPX 500 mini on FXOpen) in the context of June’s price movements reveals key reference points (marked on the chart) that outline an ascending channel. A consolidation zone, marked with an arrow, highlights a temporary equilibrium between supply and demand—after which buyers gained the upper hand, pushing the price upward.
It is possible that the ongoing bullish momentum could carry the price toward the upper boundary of the channel. However, attention should be paid to the RSI indicator, which suggests the market is heavily overbought; in fact, Friday’s reading marked the highest level of the year. In such conditions, a price correction cannot be ruled out—potentially back toward the local ascending trendline (shown in orange).
This article represents the opinion of the Companies operating under the FXOpen brand only. It is not to be construed as an offer, solicitation, or recommendation with respect to products and services provided by the Companies operating under the FXOpen brand, nor is it to be considered financial advice.
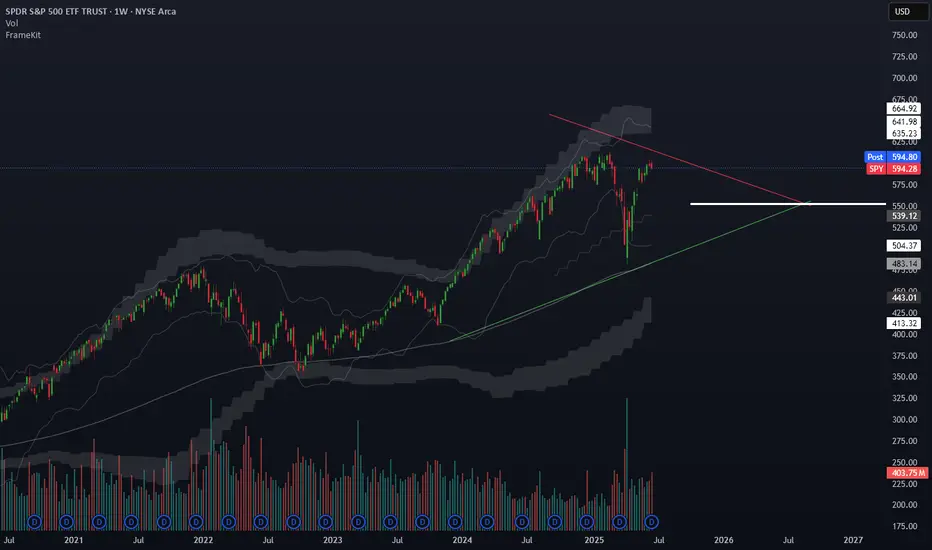
Low frequency trading (LFT) vs HFTHey fellow tarders and financial mojol,
I've got some insider info that's going to blow your minds! 🤯
According to my top-secret sources (aka my pet parrot who squawks numbers at me), low-frequency trading algorithms have finally figured out the true fair price of the S&P 500. Drumroll, please... It's $550! That's right, folks, all those high-frequency trading bots are currently aiming for this magical number as we speak.
But wait, there's more! The next step in this thrilling financial adventure involves radiowaving all the way down to $400. Yes, you heard it here first. We're talking about some serious next-level trading strategies that involve actual radio waves. Who needs fiber optics when you've got good old-fashioned radio, right?
So, buckle up and get ready for the ride of your life. The market's about to take a trip back to the good old days when $550 was the dream and $400 was just a stone's throw away.
Happy trading, and remember, if your broker gives you weird looks, just tell them you're tuning into the market's frequency! 📡💸
How Financial Markets Are Reacting to Middle East EscalationHow Financial Markets Are Reacting to the Escalation in the Middle East
The exchange of strikes between Iran and Israel continues. However, judging by the behaviour of various assets, market participants do not appear to expect further escalation:
→ Oil prices are falling. Monday’s candlestick on the XBR/USD chart closed significantly below the opening level.
→ Safe-haven assets are also retreating: the Swiss franc weakened during Monday’s U.S. session, while a bearish candle formed on the daily XAU/USD chart.
Equity markets, too, have largely held their ground.
The S&P 500 index (US SPX 500 mini on FXOpen) climbed on Monday (A→B) following reports of potential talks between Iran and the U.S. However, it pulled back (B→C) after the U.S. President urged citizens to evacuate Tehran.
Technical Analysis of the S&P 500 Chart
News of Israeli strikes on targets inside Iran led to a bearish breakout from the rising channel (marked with a red arrow), though the downward move failed to gain traction.
At present, the S&P 500 chart (US SPX 500 mini on FXOpen) shows the formation of an ascending triangle — a signal of temporary balance between supply and demand.
Still, given the elevated geopolitical uncertainty, this balance remains fragile. It could be disrupted by:
→ Further developments in the Iran–Israel conflict (notably, Donald Trump left the G7 summit early due to the situation in the Middle East);
→ U.S. retail sales data , due today at 15:30 GMT+3.
It is possible that the S&P 500 may soon attempt to break out of the triangle , potentially triggering a new directional trend.
This article represents the opinion of the Companies operating under the FXOpen brand only. It is not to be construed as an offer, solicitation, or recommendation with respect to products and services provided by the Companies operating under the FXOpen brand, nor is it to be considered financial advice.
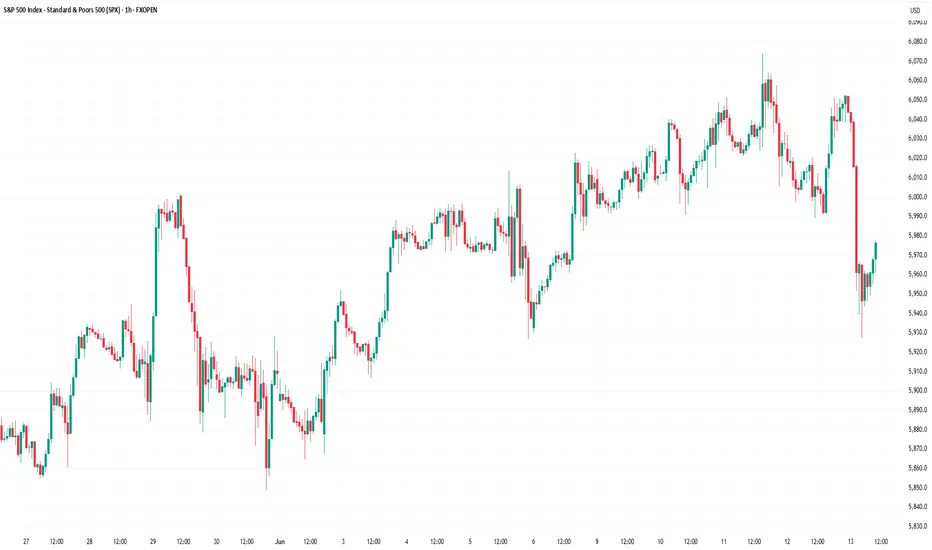
S&P 500 Breaks UptrendS&P 500 Breaks Uptrend
Only yesterday we questioned the sustainability of the stock market’s upward trend amid alarming news from the Middle East and the evacuation of the US embassy in Iraq — and today, the S&P 500 chart (US SPX 500 mini on FXOpen) shows a break below the lower boundary of the ascending trend channel.
According to media reports:
→ Steve Witkoff, US President Donald Trump’s special envoy to the Middle East, was expected to meet Iran’s Foreign Minister in Oman on Sunday.
→ Friday the 13th became the date when Israel launched strikes on Iran’s nuclear facilities, dramatically altering the outlook for a potential US-Iran nuclear agreement.
→ Secretary of State Marco Rubio stated that the US was not involved in the operation, while Israel’s state broadcaster reported that Washington had been informed ahead of the strikes.
Technical Analysis of the S&P 500 Chart
Yesterday morning, we noted that the Q-line, which divides the lower half of the channel into two quarters, had shifted from acting as support to becoming resistance. This was confirmed during the US trading session (as indicated by the arrow).
Selling pressure intensified, and the psychologically important 6,000 level — which showed signs of support earlier in June — now appears to be acting as resistance. It is in this area that the E-Mini S&P 500 (US SPX 500 mini on FXOpen) broke below the lower boundary of its uptrend channel.
In addition to ongoing discussions about potential Fed rate cuts this summer, geopolitical risk assessments are now also in focus. It remains unclear how Washington will respond if Iran retaliates.
Meanwhile, Israel’s Defence Minister has declared a state of emergency, warning of an imminent missile and drone attack — further fuelling fears of a possible escalation.
This article represents the opinion of the Companies operating under the FXOpen brand only. It is not to be construed as an offer, solicitation, or recommendation with respect to products and services provided by the Companies operating under the FXOpen brand, nor is it to be considered financial advice.
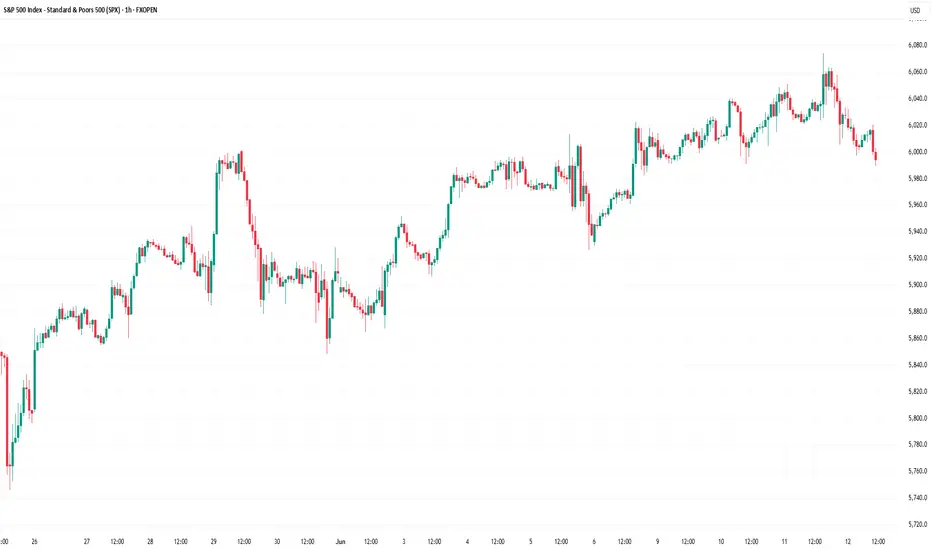
S&P 500 Maintains Uptrend — But for How Long?S&P 500 Maintains Uptrend — But for How Long?
As the chart of the S&P 500 (US SPX 500 mini on FXOpen) shows, price movements in June continue to form an upward trend (highlighted in blue).
The bullish momentum is being supported by:
→ News of a potential trade agreement between the United States and China;
→ The latest inflation report. Data released yesterday showed that the Consumer Price Index (CPI) slowed from 0.2% to 0.1% month-on-month.
President Donald Trump described the inflation figures as “excellent” and said that the Federal Reserve should cut interest rates by a full percentage point. In his view, this would stimulate the economy — and serve as another bullish driver.
However, as illustrated by the red arrow, the index pulled back yesterday from its highest level in three and a half months, falling towards the lower boundary of the channel. This decline was triggered by concerning developments in the Middle East. According to media reports, the US is preparing a partial evacuation of its embassy in Iraq, following statements by a senior Iranian official that Tehran may strike US bases in the region if nuclear talks with Washington fail.
Technical Analysis of the S&P 500 Chart
Currently, the price remains near the lower boundary of the ascending channel, reinforced by the psychologically significant 6,000-point level.
However, note that line Q — which divides the lower half of the channel into two quarters — has flipped from support to resistance (as indicated by black arrows). This suggests increasing bearish pressure, and there is a possibility that sellers may soon attempt to push the price below the channel support.
Be prepared for potential spikes in volatility on the E-Mini S&P 500 (US SPX 500 mini on FXOpen) chart as markets await the release of the Producer Price Index (PPI) at 15:30 GMT+3 today.
This article represents the opinion of the Companies operating under the FXOpen brand only. It is not to be construed as an offer, solicitation, or recommendation with respect to products and services provided by the Companies operating under the FXOpen brand, nor is it to be considered financial advice.
Spx500usdThere u go by decimals, almost there,
Here you go, it might be in bull today, I just hope so
Keep Ur own trades safe guy and DYOR
Do always Your Own Reseach
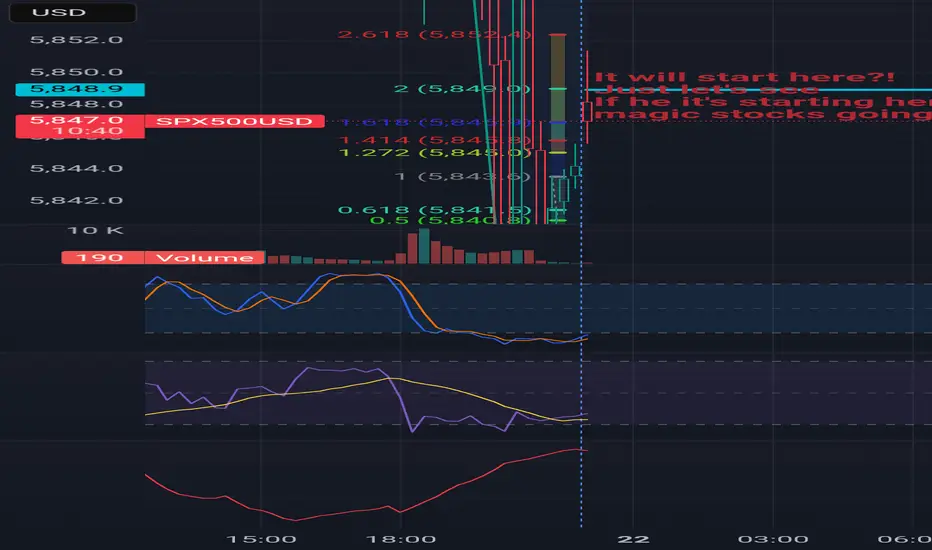
Spx500usd up? 1min chart at 23h London time?As it is , all I hope is that spx 500usd starts here at that blue line, after all, if it starts at the blue line the stock as might be up again, I'm not into the fundamentals by this time, I'm just making some Elliot and indicators-some mine, others don't, and trend analysis
Hope u guys all in profit
After all we all looking for the same
Keep Ur trades safe
And Do Always Your Own Research
DAYOR
Keep it safe
This my my graph at 1min candles, returned to 15min chart
Keep it safe.
And keep cool.

S&P 500 Falls Following Downgrade of US Credit RatingS&P 500 Falls Following Downgrade of US Credit Rating
On Friday, 16 May, after markets had closed, Moody’s Ratings announced a downgrade of the long-term sovereign credit rating of the United States from the highest level of Aaa to Aa1. The key reasons cited by Moody’s were the rising national debt and interest payments, as well as expectations of a further increase in the budget deficit. Notably:
→ The downgrade was hardly a surprise. A similar move was made by Standard & Poor’s back in 2011, while Fitch Ratings followed suit in August 2023.
→ The official response may be seen as reassuring for market participants. US Treasury Secretary Scott Bessent played down concerns about the downgrade in an interview with NBC News, calling credit ratings “lagging indicators” and placing the blame on the previous administration.
→ Despite the downgrade, Moody’s acknowledged the US dollar’s role as the world’s reserve currency and stated that the United States “retains exceptional credit strengths, such as the size, resilience, and dynamism of its economy.”
Stock Market Reaction
The announcement triggered a negative market reaction, reflected in falling prices during Monday morning’s opening session. E-mini S&P 500 futures (US SPX 500 mini on FXOpen) retreated, as indicated by the arrow on the chart, pulling back from the highs reached by Friday’s close.
Last week, we pointed out signs of slowing momentum in the S&P 500 rally. Could the decline continue further?
Technical Analysis of the S&P 500 Chart
By drawing lines A, B, and C through the May rally peaks, we can observe a gradual flattening of the slope — suggesting that the bulls are losing momentum and confidence.
The price is currently trading between local lines C and C1, but it is reasonable to assume that the opening of the US session may bring renewed bearish pressure — potentially pushing the price lower, towards the bottom boundary of the broader upward channel (marked in blue).
This article represents the opinion of the Companies operating under the FXOpen brand only. It is not to be construed as an offer, solicitation, or recommendation with respect to products and services provided by the Companies operating under the FXOpen brand, nor is it to be considered financial advice.

S&P500 Index Intraday Trend Analysis for May 12, 2025The S&P 500 Index is displaying bullish indications for the day. Key support levels are observed at 5789 and 5755, while resistance is expected around 5860 and 5930.
Please note, this is solely my personal view. Traders are advised to conduct their own technical analysis and ensure proper risk management before making any trading decisions.
