SPX Elliott Wave Analysis: Calling Correction LowerHello Traders,
In this Elliott Wave analysis, we will have a look at the SPX Index.
SPX short-term suggests that the rally from 4/02/2018 low to $2792.25 ended the blue wave (1). Down from there, correction against that cycle remains in progress in 3, 7 or 11 swing structure. Also, it’s important to note here that the decline from $2792.25 peak shows an overlapping price action thus suggesting that the correction is taking place in a corrective manner i.e either Double three or Triple three structure.
Down from $2792.25, red wave W unfolded as a double three structure with a combination of 3,3,3 swings in each leg. The black wave ((w)) of red wave W ended at $2743.10, black wave ((x)) ended at $2774.86 and black wave ((y)) of W ended at $2698.67 low. Up from there, red wave X bounce remains in progress to correct cycle from 6/13 high ($2792.25) where black wave ((a)) ended at $2746.09 and black wave ((b)) completed at 2710.93 low.
Near-term focus remains towards $2745.34-$2756.41, which is the 50%-61.8% Fibonacci retracement area of the cycle coming from $2792.25 high to black wave ((c)) of red wave X.
Afterwards, the index is expected to continue lower in red wave Y to correct cycle from 4/02/2018 low. We don’t like selling the proposed pullback.
Spx500forecast

S&P500 possible turning bearishMy previous call on S&P500 longs around 2692 almost have met the target of 2800, not yet hit that level but almost reached it. We may see it may test that and roll all the way back. For now- it seems like it is likely to complete the correction and i am expecting a big move to be setting up to test the lows over the coming weeks or so. So i should be looking for sell setups here.
Check out my twitter for my trade results and updates.
Happy Trading.
S &P 500 OUT OF pUFFPatterns are of course open to interpretation, it's an individual thing. When combined with price action and some basic
tools. You may find multiple aspects of confluence.
There are many here, the underlying tone at this time is bearish.
News may change the outcome temporarily.

UPDATE: SPX500 looks great, review at $2785Hi guys, thank you for the support! I will have this analysis out each weekend as well as daily updates throughout the week, if you guys like what I'm doing hit the "follow" button and you will get a notification each time I post a video or chart!
Have a great day everyone!

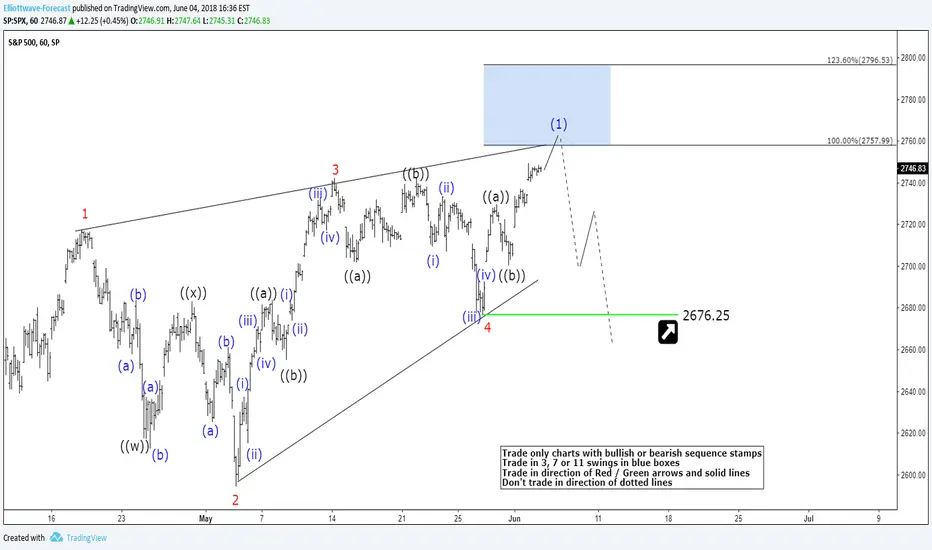
Elliott Wave Analysis: SPX Close to Ending A Cycle from 04/02/18Hello Traders,
In this short-term analysis, we will have a look at the SPX 0.45% in the 1 hour Elliott Wave chart. At this moment in time, the near-term cycle from 4/02/18 low (2555) remains in progress as a 5 waves leading diagonal .
Up from 2555 low, it has ended red wave 1 at 04/18/18 peak (2717.67). From that top, it has ended red wave 2 correction at 05/03/18 low (2593.98) and from that low, it has ended wave 3 at 05/14/18 peak (2742.10) and wave 4 correction at 05/29/18 low (2676.25).
While SPX 0.45% stays above 2676.25 low, the index is expected to see 1 more push higher in wave 5 to end the cycle from 04/02/18 low before starting its correction in 3-7-11 swings. The right side remains to the upside. Therefore, we don’t like selling it and prefer buying wave (2) pull backs in the sequences of 3-7-11 swings
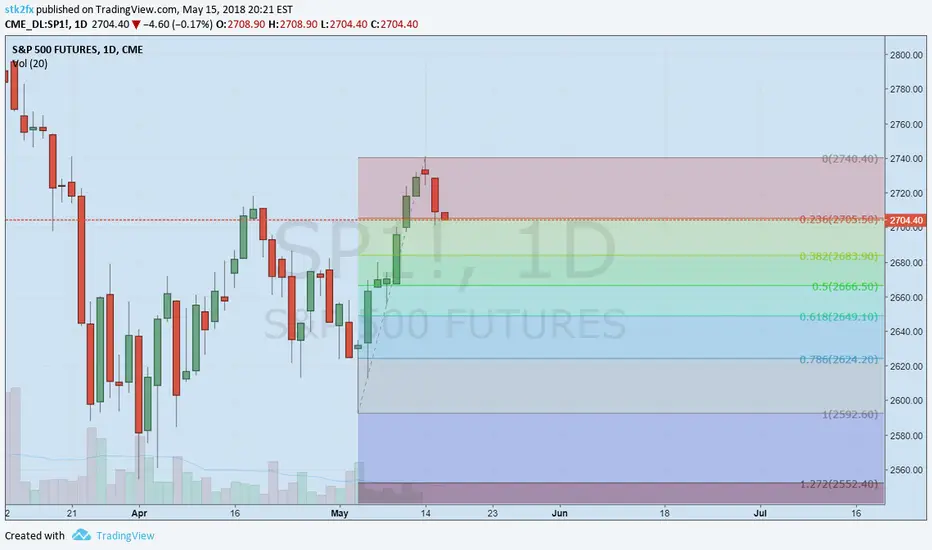
Quick short trade on /ES miniFibonacci tells me it would go at least 38% retracement range of 2685..
I think a short trade placed at 2710 with stop loss at 2715 and profit target of 2685 would yield more than 1:4 risk to reward trade..
Disclaimer: this is no recommendation for any trade. I am using it to track my paper trade prediction performance
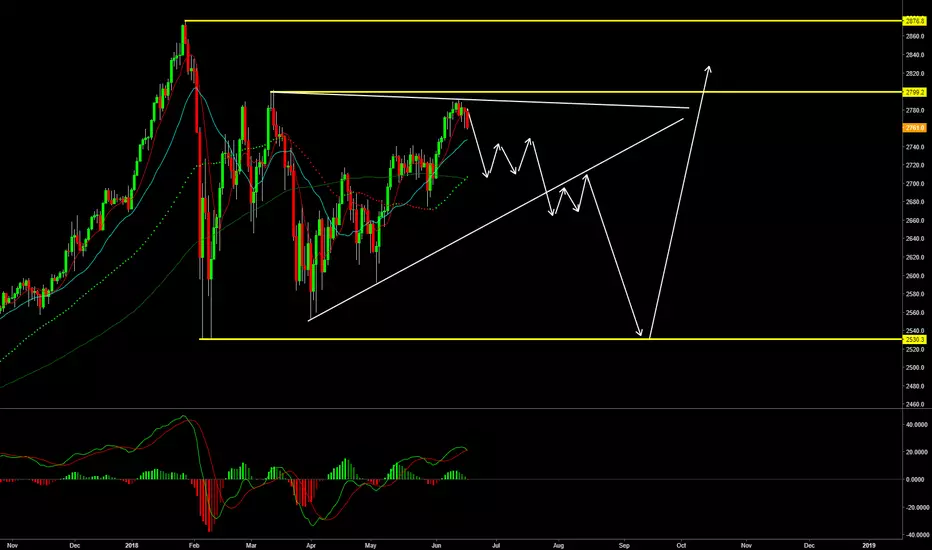
Elliott wave analysis of SPX (S&P 500): 4hr tfMy previous post for the SPX (S&P 500) can be found here:
A possible Elliott wave contracting triangle was discussed in the post to capture price action from January 29, 2018 to April 25 when the analysis was initially provided.
SPX (S&P 500) currently is sitting just above B-D trendline for the contracting triangle. The relative strength index (RSI) is also shown here and does have a rising, positive slope, which argues for more upside movement in SPX (S&P 500).
The projection of price action using this Elliott wave structure still stands as provided in the previous post.
The ideal point of entry (POE) is placed at ~$2718.73 (dotted horizontal line) when price action attempts a break out above the termination point of wave D of the contracting triangle.
The point of invalidation (POI) of this analysis still stands as provided in the previous post.
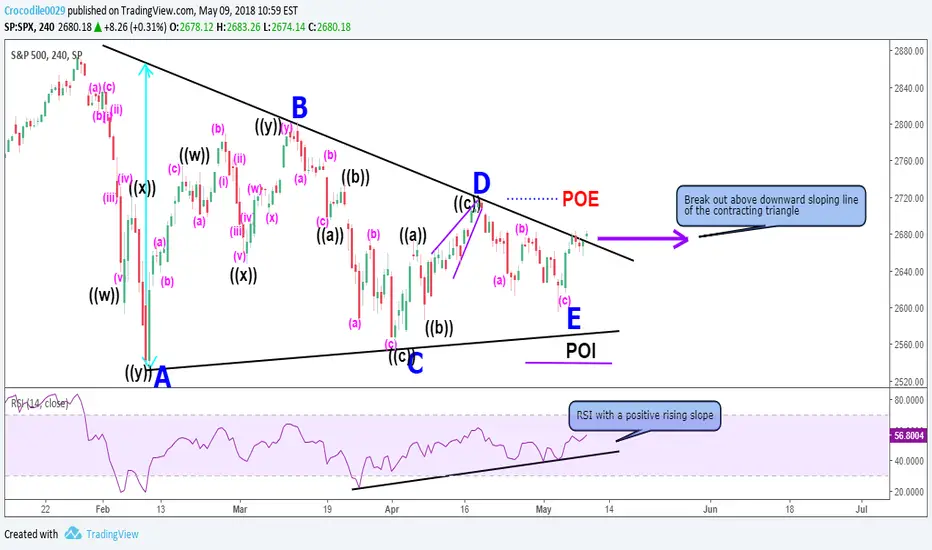
S&P 500’s (SPX) Elliott wave analysis: 4 hr tf analysisPrice action for the S&P 500 from January 29, 2018 till present date has been captured in this analysis using a contracting triangle Elliott wave structure. The implication of this structure for the S&P 500 is that price should resume its bullish trend once a breakout occurs out of the triangle. Breakout point as used in this analysis is ~ $2718.51
The post thrust measurement (target area) for the bullish interpretation can be calculated by measuring the width of the triangle and projecting it on top of the breakout point.
The width in this case is 2863.99 – 2533.29 = 330.70
A vertical projection of the width above the breakout point means that the S&P 500 should target ~ $3,049.21 (330.70 + 2718.51 = $3,049.21).
The point of invalidation (POI) of this analysis is a price close below ~ 2542.92 at which point the wave E would have overlapped wave C, which is unacceptable for a contracting triangle.

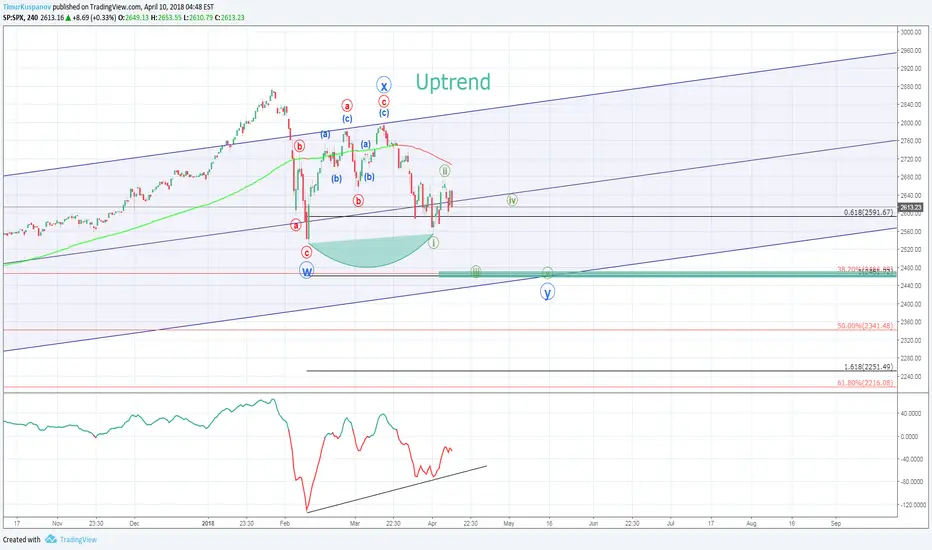
S&P 500 INDEX. The complex correction is ending
Complex correction is coming to an end. Support is on the chart, and they are rising pitchfork
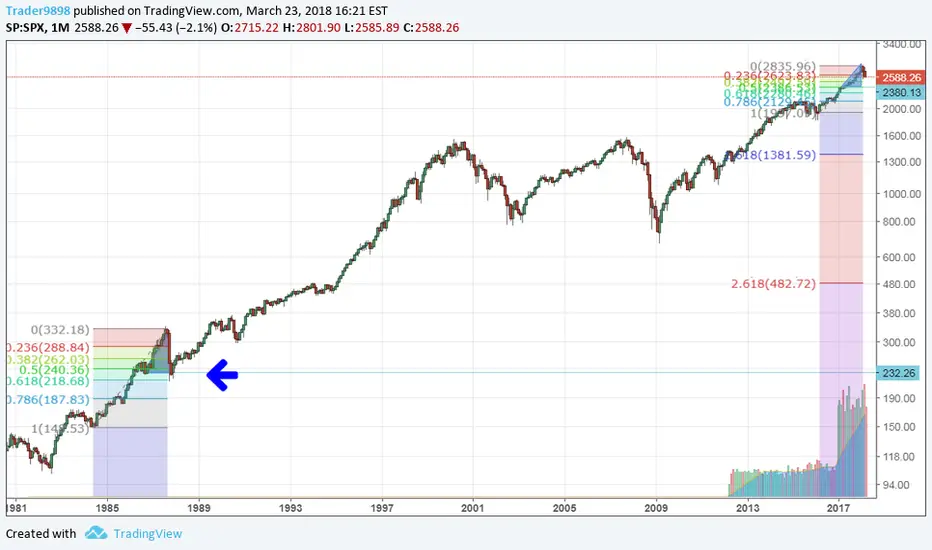
SPX - Half Way ThereThis is a re-post of a chart from one month ago after the dow dropped 700 points in one day. My extrapolation from that post compared this to 1987, in which there was a 2 year run up, and then a quick crash which erased 1 years worth of gains.
While this 2018 crash appears to be slower in time than 1987's two month crash period, the charts nonetheless look the same to me. If we extrapolate, then SPX's current price has only reached half way to where it will eventually bottom out, which should be around 2380.
S&P 500 - Potential Dead-Cat BounceThe S&P 500 gapped down yesterday on the daily chart.
It looks like a potential dead-cat bounce is setting up.
Let's see if the price finds support at the 2645 level, has a short correction, and then continues its decline to 2600 or lower.
~KP

SPXMorning Traders,
I would like to show you that techniques I teach work on all type of financial markets. This specific analysis is done on S&P 500.
Happy trading,
cheers,
Jim

Short SPX to 2200More of a forex and crypto guy but today the SP:SPX caught me eye for nice 2 month short to 2200. Ill update you guys as we go. If you would like a more in depth reasoning please feel free to leave a comment below.

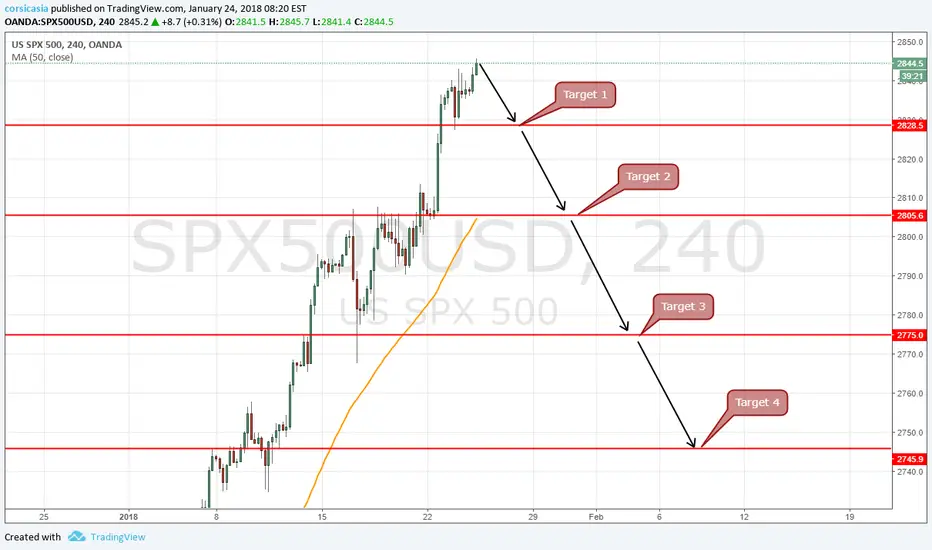
short at 2845 for 4 target and the last at 2745euphoria
bubble
overbought in every side and way and form and lol
i short for a target at only around 3.5-4% is very light and possibke because it need a real breath and more deep than my trade but we go like that for now
i open 2 x 1 lot
and i will manage until he down
i will cut first lot when he reach 40 pts and made a sl on second lot at + 25pts for save 65 pts but the goal is 40 pts + 100 pts with this 1 lot =145pts (1450pips)
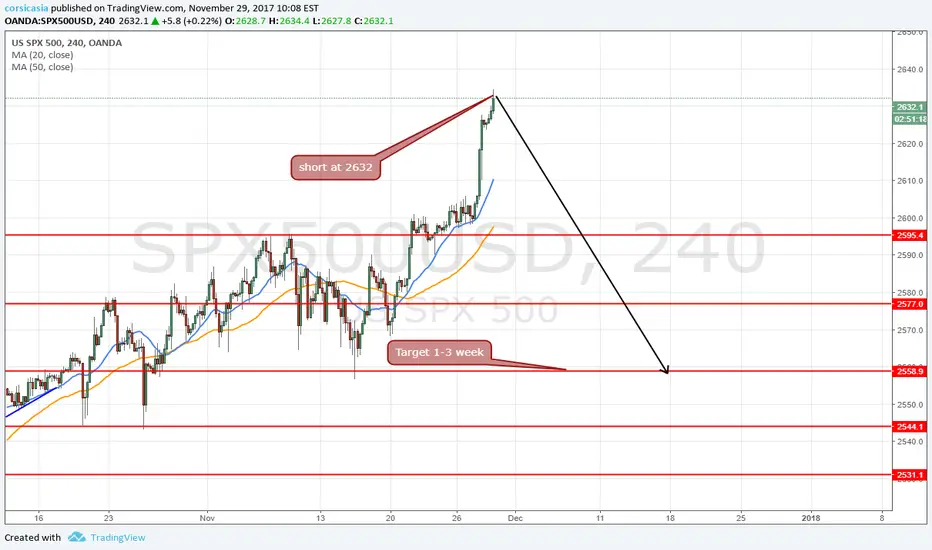
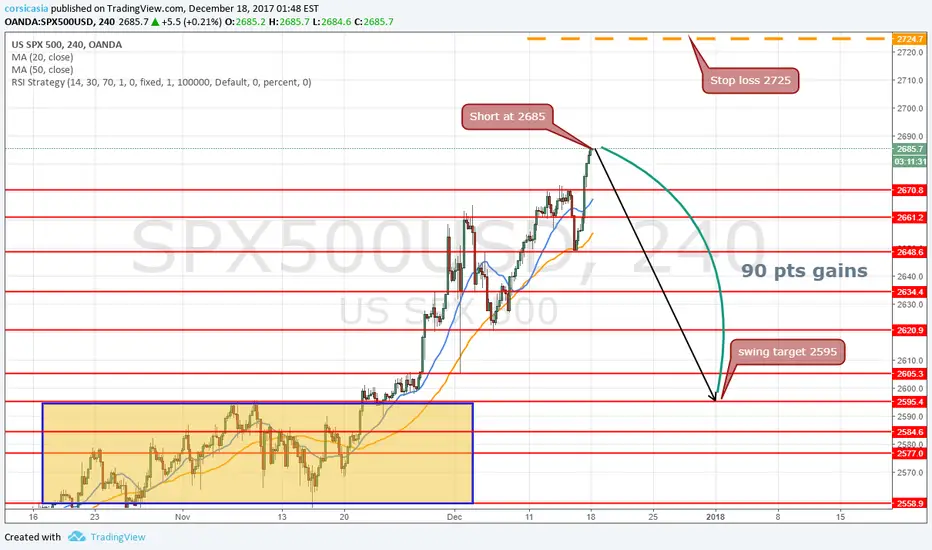
Short swing at 2685 for target 2595 SL 2525 i short SP500 because i think he done the Christmas rally more early than before and i think he will down a bit before end years may pull back before the 31 december for close the years i big gains then after in january fastly down more than my target...but is possible that my target can be reached before end year ( 12 days)
Overbought much in weekly and monthy
the ma20 and ma50 are so far from price in monthly somethign never seens in history
all good news about tax and health care was priced
even Fed hike rate stock continue to up..it should be opposite
so i think first quarter of 2018 will get a big correction
For me e are in Bubble and pure speculation
Market react at all good news and never react from bad news..something really crazy
the viw historical for a long period
and at the hedge fund and other big fish will finish to take them benefit they are not crazy ,they all know they so high now and abuse already too much
short at 2685
target at 2595 and surely 2550 and 2500 in 2018
SL 2725
i short again at 2632 double lot for target 2558i short again at 2632 as for target 2558 again.
market is in euphoria now sure is the last step of the bublle and it will down more than my target sure at 100% in less than 1 month
like my first trade i cut manually at 2330 = 27 pt lost
so this tile i short with 1 lot more more get more that double profit + mu lost back
short at 2632=2 lot
Target 2558
gain = 74x2=148 pts for lost before 27^ts ahhhhhhhhhhhh