SPX 500 index analytics: Growth potential to 4100 remains. Analyst of the spx 500 index on 07/19/22 Today we are here to talk about the SPX 500 index
What's on the market now:
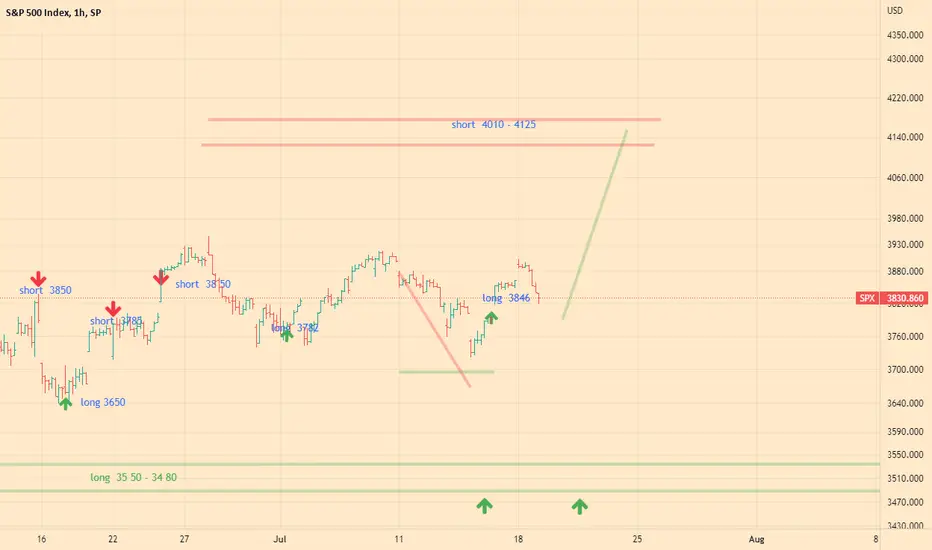
The index is trading at 3830. The market has been in a sideways correction for the last 2 weeks, but I think this stabilization will end in the near future.
In the last trading session, we saw a small correction of the last growth, which began on July 14th. I believe that the current correction will not be long and the upward movement will continue in the near future.
What I'm waiting for:
I maintain a positive view of the market and expect it to move towards the level of 4100. At the same time, my trading recommendations remain unchanged.
What I recommend:
If you want to go short:
Short positions are prohibited.
If you want to buy:
Market buys are possible, but limit your losses.
If you are not in the market:
If you want to buy, you can buy from the market, but limit your losses. The market is developing a steady upward movement, which I spoke about earlier. However, as we can see, not all market participants support the uptrend. But in the coming days it will be decided.
Like and subscribe, thanks!
Also remember to contact me in 2 or 3 days for further trading advice.
Don't forget to like it, it really motivates me to share my market knowledge. Subscribe to me and you will always be aware of the movement of the SPX 500 index.
See you next time!
Bye!
Spx500long
SPX long Builidng pivot for these couple days Today opened high, then pull back to fill the gap. Expecting another open high, then pull back for pivot Builidng. Wednesday or Thursday till Friday for a leaving spike towards $4150

Market Analysis - SPY PerformanceIn this post, I will attempt to analyze where the market currently stands, and present both a strong bull case and a strong bear case.
Bull case:
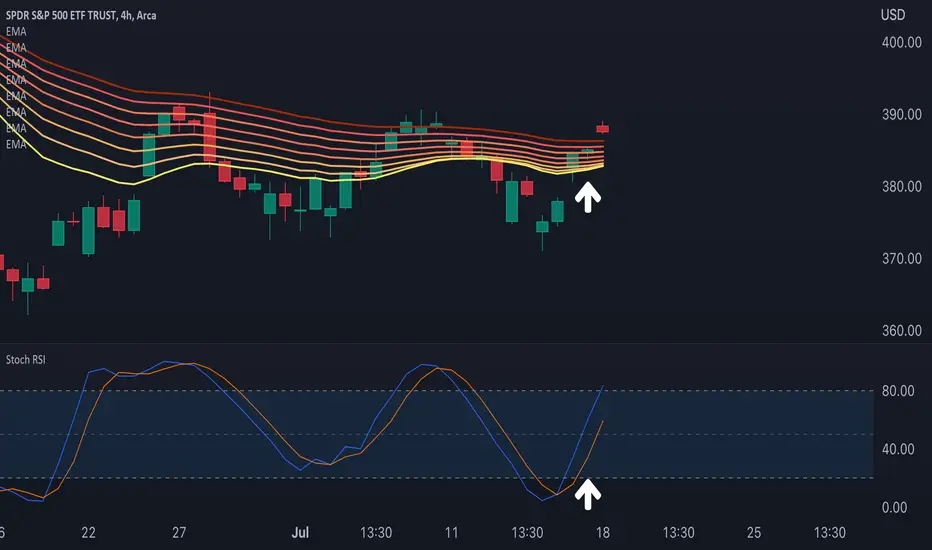
First, the chart:
The chart above shows the S&P 500 ETF (SPY) on a 4h timeframe. The yellow and orange lines are exponential moving averages that represent the MA Exp Ribbon. As noted in a prior post, the MA Exp Ribbon acts as resistance when price hits it from below. In order to pierce through the ribbon, and make a bullish breakout, a candle must do so on high volume and with strong momentum. On the bottom is the Stochastic RSI oscillator, which helps measure momentum. For the first time, in a long time, the 4h chart of SPY has seen price near the top of MA Exp Ribbon with strong momentum building to push through it. It is quite likely that the price will break through.
Second, the VIX:
As the chart below shows, the VIX has broken down from the trend that it held during its most volatile period over the second quarter. Just be cautious and patient because the VIX has not yet broken below its weekly MA Exp Ribbon.
Third, the Advance-Decline Line (ADL):
The advance-decline line has broken out and is absolutely soaring. This is possibly one of the most bullish-looking charts out there. The advance-decline line is a technical indicator that plots the difference between the number of advancing and declining stocks on a daily basis. The advance-decline line is used to show market sentiment, as it tells traders whether there are more stocks rising or falling. It is used to confirm price trends in major indexes, and can also warn of reversals when divergence occurs. Right now there is a strong bullish divergence and the major indices have yet to break out.
Seasonality:
The current period (mid- to late-July) is typically bullish from a seasonality perspective: charts.equityclock.com . Indeed, there was a bull run during this period even in 2008 during the Great Recession.
Bear case:
(Warning this part is scary - but remember never to invest or trade based on emotion)
Yield curve inversion:
The 10-year minus the 2-year Treasury yield is used to detect an impending recession. When the 2-year yield rises above the 10-year yield that creates a yield curve inversion, which can often indicate that a recession is coming. In essence, it creates the presumption that shorter-term yields are higher than longer-term yields because we're in the late phase of an economic cycle when the economy is overheating, and that soon, the economy will slow down. Right now the yield curve inversion is very steep. In fact, just last week, the yield curve inversion actually steepened to a level that was even worse than what we saw before the Great Recession.
Perhaps even more alarming is the extremely odd fact that the 10-year minus the 3-month Treasury is NOT indicating a recession. The federal reserve uses the 10-year minus the 3-month as a more reliable indicator for detecting an impending recession than the 10-year minus the 2-year.
Right now that indicator is only showing a 6% chance of a recession in the year ahead: www.newyorkfed.org
However, there's a major problem that throws into question the reliability of that indicator at the current time, and that problem is: The Rate of Change in the 10-year yield is off the charts. Look at the 10-year yield Rate of Change on a 3-month basis:
There's no way the 3-month yield could possibly invert relative the 10-year yield when the latter's rate of change is off-the-charts, unless the former's rate of change was even more off-the-charts (as we see with the 2-year, which is why the 2-year was able to invert against the 10-year).
Here's the 2-year yield rate of change:
Therefore, the 10-year minus the 3-month may be showing no inversion, not because the chance of a recession is actually low, but more likely because the indicator itself is no longer working because the rate of change in the 10-year yield is so parabolic. The 10-year minus 3-month indicator only reliably works if the assumption that the 10-year yield rate of change will be relatively stable compared to the 3-month yield rate of change holds true. In the current environment, that assumption does not hold true.
We've never seen this kind of rate of change in the 10-year yield during the period for which this indicator has been used to predict recessions. The 3-month yield would have inverted against the 10-year yield months ago, if the 10-year yield had remained relatively stable as it has during the past several decades. However, the 3-month yield cannot invert against something moving so fast to the upside. This is just simple math. This is extremely worrisome because many people are using this tool as a reason to believe that no recession will occur, when in fact, the tool has likely broken.
In the scientific community, we know that a tool only works if its validity and reliability can be established. Validity refers to the extent to which the tool actually measures what it is being used to measure, and reliability refers to the extent to which the tool consistently makes accurate measurements. In this case, the reliability of the 10Y-3M tool has broken down because the assumption that the 10-year yield would always be more stable relative to the 3-month yield is not true this time around. This time is indeed different...
So I leave you with these strong bull and strong bear considerations, and it is for you to determine how you want to play the market. Remember the rules of good trading!
SPX Daily quick updateI didnt have much time for a research this weekend, it's our family trip we are on and I have no time to trade at all.
As promised, do a quick weekend update, will do a broader one for those who are on my email list (if I find time later today)
Next week most important resistance is 3918-20SPX on a daily closing level and 4090SPX on weekly closing.
4090 is the dev bull bear line now, where the main resistance is down to 4300 from 4425
Looking back at the last year same week opening, Im kinda expecting the same with a big gap down and bottom on the 20-21st.
Or it can stretch to 3900 (smaller degree resistance) and 3918-20SPX.
With making lower highs and lows since Jun rally of the lows, I think we have one more unfinished flush to go.
I dont rule out a move up to 3900-20 on Monday/Wednesday to top this weak move off the Jun lows, then more weakness into EOM before a significant rally in Aug.
It could be a move down to 3660-70 or a new low to 3500, the timing is running out for the later number.
I have 20-21st as dates of importance, so either a low (if we fall apart on Monday) or a high (follow through on Monday).
I will be exiting most of my short if its a low and the opposite if its a high.
Again I have mixed signals, so cant be certain at this moment, but Im in lotto puts on to of my main fut short position, just in case we get a last year repeat.
Then the rally up into Aug/early Sep high and then we will get a real move down to finish this first wave of the bigger bear decline we have going into the 2023 and even possibly 2024.
Something suppose to happen in Sep which will produce a crash and Oct should cap the bottom. Then we will have a nice damage control/flight of capital from EU move up into the EOY and continue lower into Mar/Apr of 2023.
P.S. I doe expect the whole rally of 2020 lows to be erased with a possibility of seeing the 2020 lows next year
Enjoy your Sunday!

SPY breakout attempt Number 1Breakout attempts can happen without any triggers but when a trigger appears and coincides with market bottom, then there is an agreement and slight trading conviction that may be worth considering into the last half of the year. There is a daily wolfe wave setup that triggered on June 21 closing day at 3767.75. The projected target is calculated by extending a linear line between pivot 1 and 4 and projecting the line. This is represented as the green perforated line, as shown in the chart. The projected target is 4332 which is expected to reach this price target before Sept 30. Projected targets are defined by identifying the apex of the wolfe wave and projecting a vertical line toward the green perforated projection tgt which is extending from left to right.

SPX quick update - Main closing support is 3820Just got time to do an update.
Very important to close above 3820 today, otherwise we will be on the way to my 3730-60 zone, 3750 will become the next target.
If we close below 3820 today, I will short any rip and do some lotto puts.
On the other hand closing above 3820 will get me long for tomorrow
Broke 3820 already, could be an ugly close

SPX still pointing to 3980 zone to hitSPX can retrace a bit tomorrow, 3810-30 should hold.
Looking for a rally up to 3960-90 zone from there.
C&H possibility is still alive!

SPX500 LONG ABCD COMPLETIONLooking at the spx500 index to run back up to fill liquidity imbalance at 127% extension

possible C&H targets 4240Its a very deep C&H but still can be valid. NQ and ES have a better looking formation.
All we need here is to get above 3955SPX and then we are off the races.
Its a long way up, resistance levels are:
- 3913-15
- 3965-82
- 4075

The growth of the index to 4050 is inevitable. Analyst of the spx 500 index on 07/07/22 Today we are here to talk about the SPX 500 index
What's on the market now:
The index is trading at 3873. In the last trading session, we saw the expected increase in the index that I mentioned earlier, here is a link to the idea. In today's trading session, I expect a move up to the level of 39 20. The struggle that has been going on in the market for the last week has been resolved and now the market is ready for an impulse movement.
Today we are waiting:
I expect the market to move towards the level of 3920.
What I recommend:
If you want to go short:
Short positions are prohibited.
If you want to buy:
Buying on the market is possible, limit your losses.
If you are not in the market:
If you want to buy, you can buy from the market, but limit your losses. The market is developing a steady upward movement, which I spoke about earlier, and I hope you had time to participate in it.
Like and subscribe, thanks!
Also remember to contact me in 2 or 3 days for further trading advice.
Don't forget to like it, it really motivates me to share my market knowledge. Subscribe to me and you will always be aware of the movement of the SPX 500 index.
See you next time!
Bye!

SPX - Its all about closing above 3838-40, otherwise down3838-40 is the dividing line for today, failing closing above it will get us down to test new lows.
The markets are weak with not being able to close the highs for several days, a warning sign

SPX looking for 3720-30 zone test and hold or double bottom hereLooking for either a double bottom here or a 3720-30 test


SPX longer term updateThis is a quick update with levels of importance.
I will update in more detail those who are on my email list, cant do it all.
So
I think we will see a really this week and I have 2 targets - 3880 and 3960-90SPX
Both are good for the lower lows to come sometime mid of the month, ideal bottom target is July 14-18th.
The top in 3960-90 zone actually better fit with expected by me 3500 test.
3500 is a very important level and failure of that level will get us to 3200 very quickly.
Off that expected low, Im expecting a good size rally, maybe a month or month an half (into end of Aug) all the way to 4300 and maybe even 4425SPX.
From there we will see either 3200 or 2900-2800 (depends on the July bottom 3500 and 3200 respectfully) sometime in Oct.
That low alone will be a one big A wave of the correction and the bigger B wave will go up into Jan and final low might come in Mar of 2023, unless its really extended and we wont see the low till 2024. But its too far out to speculate at this point.
So my this week trading plan is to exit longs at 3880 and it taken out re-enter to ride to 3960-90 zone and then I will be naked short for the trip down to 3500 zone.
If we lucky to see 3750-60 tomorrow, then I will be long for the trip to 3880 at min.

SXP500 Index: The day when the markets are ready to move. Analyst of the spx 500 index on 04/07/22, today we are here to talk about the SPX 500 index
What's on the market now:
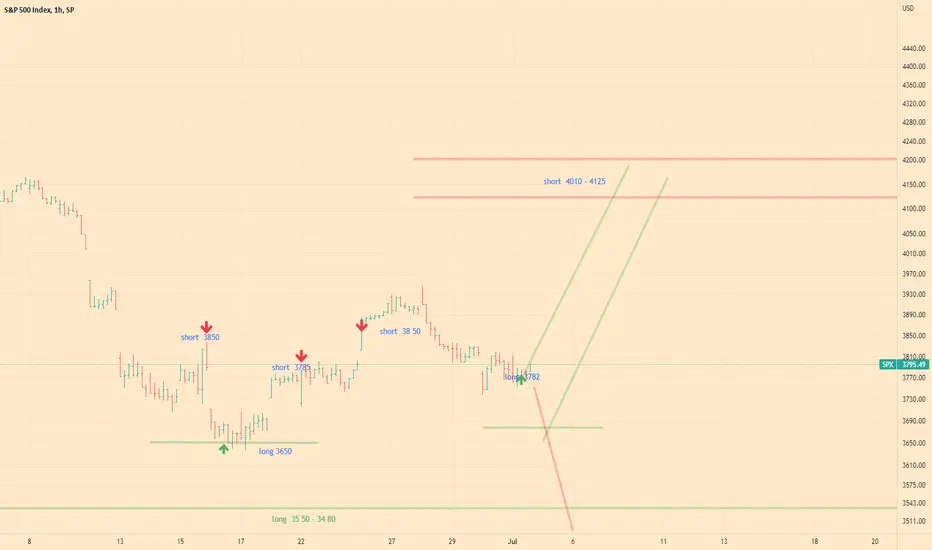
The index is trading at 3825. In the last trading session, the market began to move up, but in essence the market has stabilized. Now market participants need to choose a general trend in the direction of which the new trend will develop. Currently, the market is at a point of equilibrium and is clearly waiting for new trading ideas.
I expect the market to move to the level of 4000 and above.
Today we are waiting:
In the current trading session, I expect the market to move towards the level of 3900. But if this trend is broken, then a sharp movement of the market to the level of 3650 is possible.
What I recommend:
If you want to go short:
Short positions are prohibited.
If you want to buy:
You can enter the market, but there remains the possibility of a sharp downward movement of the index.
If you are not in the market:
If you are out of the market. I recommend that you try to go short around 4125.
If you want to buy, you can buy from the market, but limit your losses. It is important to remember that if this new upward trend breaks, we will see a sharp drop in the index to the level of 3550 - 3480.
Like and subscribe, thanks!
Also remember to contact me in 2 or 3 days for further trading advice.
Don't forget to like it, it really motivates me to share my market knowledge. Subscribe to me and you will always be aware of the movement of the SPX 500 index.
See you next time!
Bye!

SXP500 Index: New big game! Is there a green wind?Today we are here to talk about the SPX 500 index.
What's on the market now:
The index is trading at the level of 3788. Currently, we see a developing correction with its end in the area of 3735-3700. In this zone, the market will have a chance to reverse and move up to the level of 4050. However, if the market does not have enough strength, then we will see a sharp movement of the market to the level of 3580-34 80.
Today we are waiting:
In the current trading session, I expect the market to decline to the level of 3750 - 3700. But if this does not happen, then the market may develop from the current levels and begin its upward movement. It is this movement that I call the "big game"
What I recommend:
If you want to go short:
It is too early to open short positions now, it is better to open them from the level of 4050, limit your losses.
If you want to buy:
You can buy the index now, but limit your losses. Better buy below around 3735.
We need to watch the level at 3700 as this will be the critical point where there will be an opportunity to enter the market. In doing so, we need to limit our losses.
If you are not in the market:
If you are out of the market. I recommend that you try to go short around 4050 - 4150. But if you want to buy, then I recommend that you go long from the 3700 level. Remember to always limit your losses.
Like and subscribe, thanks!
Also remember to contact me in 2 or 3 days for further trading advice.
Don't forget to like it, it really motivates me to share my market knowledge. Subscribe to me and you will always be aware of the movement of the SPX 500 index.
See you next time!
Bye!
SPX must close above 3800 for tomorrow to continue upWatching the close here.
Its really must close above yesterday's lows, above 3801SPX for tomorrow to continue this move.
Failing closing above 3800 wont be good going into EOW tomorrow, below 3780 will be bearish for tomorrow's open imo
Must save the day with EOD squeeze. Closing above 3825 will be perfect for tomorrow's continuation

SPX is setting up for a squeeze into 4050SPX zone of am lowsSo far so good from my yesterday's update. We should test 3760SPX (already did on the ES), with an ideal stretch to 3735 in am.
3725-35 is a must hold for today imo, otherwise it opens a door to 3662SPX, which I'm not in favor to test just yet.
Looking to exit remaining short at 3755ES from yesterday's close and start layering in with longs for a potential 200-250 trip into the 4050 zone

SPX setting a up a test of 3760, next is 35 for the EOM runIm back from my little trip. So far so good since my last update, we are going to test 3760 and ideally 35 today/tomorrow and then a run back to 4017-20 by the 4th-6th.
There is a chance we see 3500 sooner then later, so have to be very careful in sizing on any trade.
Im going to buy longs today starting from 3780 and 60 will add if we see 35

ES is at Bull/Bear lineES is at Bull/Bear line, hit 110 MA and 50% retracement. A real test of who is in charge is right here.
As well as ABC move up with perfect 100% extension hit on the SPX close.
Jumping over the 110MA and test from the above will be a good sign of continuation of this move.
There is also a possible fakeout to watch.
A perfect place for a pause of this move up and some retracement.
An ABC move up to 4017SPX or so is what Im looking for with A being done and we get to test 3730-40 zone before the continuation higher.
Ideally we see the whole move going into the 4th of July weekend!
Im slightly short as of close, kinda risky trade as this can just continue extending to 1.618
Will send a separate email with more charts to those who are on the email list.
Enjoy your weekend, lots of volatility is coming after the 28th, so prepare for huge moves both ways

SPX must close the gap or it will be very bearish imoSo far so good from yesterday's update, we gaped up and the longs must be very profitable to those who followed.
Must close the gap today or Monday, otherwise this could be a stop run and the target will be 3585-90SPX (fibs agree if we top here)
Otherwise another breakout on Monday would do it and the main resistance is at 3970-90SPX, which will be heavy shorted by me
Watching the close of the gap now, which is super close @ 3900.16

SPX crucial support 3636Weekly closing price is the price available for the world for two days.
It is the maximum resting time of a stock or index price, than daily or even monthly.
All investors ,traders, institutions, owners are scratching their heads for next action
So we have some logics;
Every thing is out, inflation, rate Hike, corona lock down, supply chain lock , BUT remember market is already factored in.
public is under fear of recession, market collapse ,thanks to Media for over shouting .
what they will do? they wait for Monday to sell their stocks
what smart BULLS do? they will always act fast before the public realizes
they BUY at low level (market oversold to the level of 2015 )
As per EW counts, 'Y' wave will end at 3636 (X*1.618)
as long as this level is supported by smart BULLS, we have another new Rally

SPX bullish looking as well as IHS setupSPX is looking bullish and has the same structure as the ES with IHS setup
