SPX500 Will Go UP!
HI,Traders !
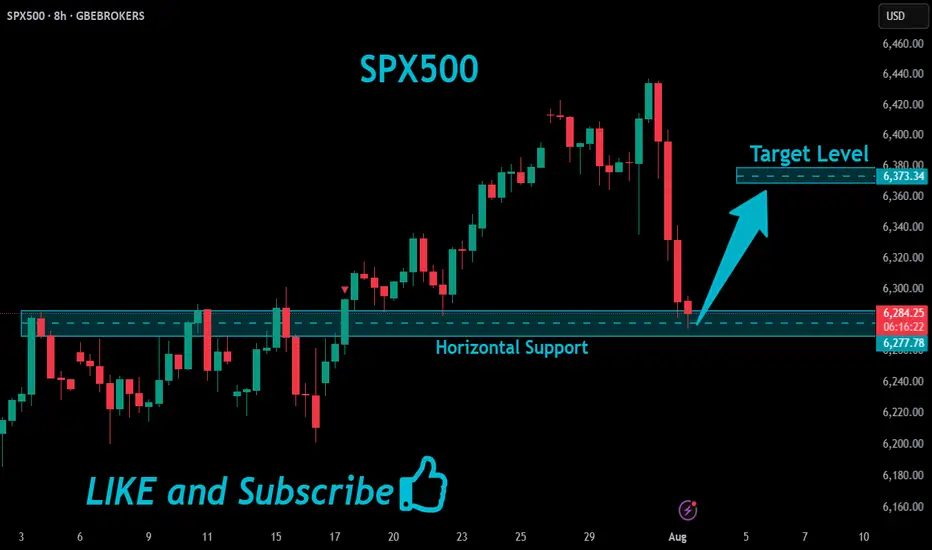
#SPX500 made a retest
Of the horizontal support
Level of 6277.78 and we
Are already seeing a
Bullish rebound so we are
Locally bullish biased and
We will be expecting a
Further bullish move up !
Comment and subscribe to help us grow !
Spx500signals
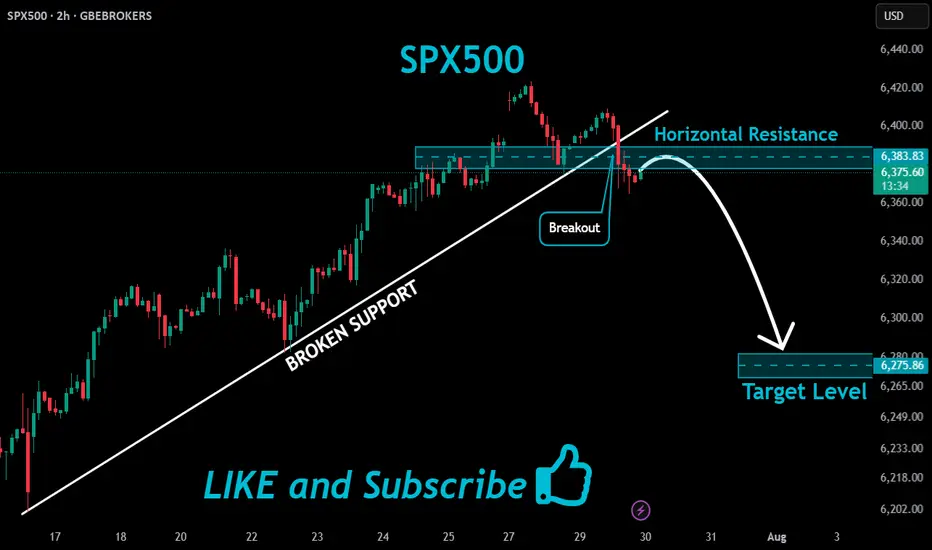
SPX500 Bearish Bias!
HI,Traders !
#SPX500 broke both the
Rising and horizontal
Support line which are
Now resistance areas
And the breakout is
Confirmed so we are
Bearish biased and we
Will be expecting a
Further bearish move down !
Comment and subscribe to help us grow !
S&P 500 (CASH 500) SHORT - Double top H8Risk/reward = 4.1
Entry price = 6343.3
Stop loss price = 6365.3
Take profit level 1 (50%) = 6268.1
Take profit level 2 (50%) = 6232.1
Still waiting on some variables on checklist to be confirmed before I enter the trade.

S&P500 (CASH500) (SPX500) SHORT - Head and shoulders 30minRisk/reward = 3.3
Entry price = 6314.8
Stop loss price = 6318.4
Take profit level 1 (50%) = 6301.3
Take profit level 2 (50%) = 6297.5
Waiting on validation from a few other variables.
For example, waiting for the current 30min candle to close in range.
Letssss goooooo

SPX500 Short From Resistance!
HI,Traders !
#SPX500 is trading in an
Uptrend but the price will
Soon hit a horizontal resistance
Area around 6285.44 from
Where we will be expecting
A local bearish correction !
Comment and subscribe to help us grow !

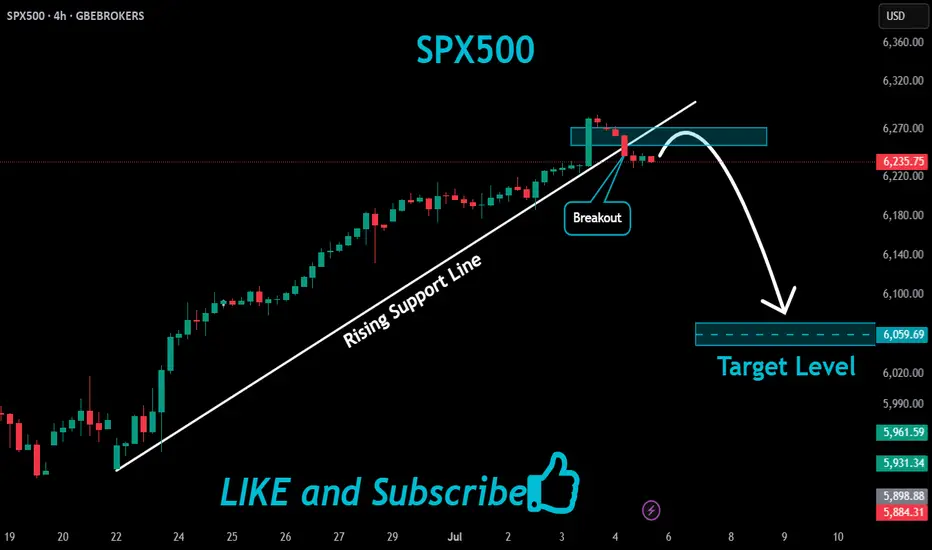
SPX500 Bearish Breakout!
HI,Traders !
#SPX500 was trading along
The rising support line but
Now we are seeing a bearish
Breakout so we are bearish
Biased and we will be expecting
A further bearish move down !
Comment and subscribe to help us grow !
S&P500 Index End of Day Trend AnalysisS&P 500 Index Outlook:
The index may experience bearish momentum starting around April 25th or 28th, with key support at 5160. If this level holds and bearish confirmation does not emerge, the bullish trend is expected to continue toward the target of 6109.
Traders should wait for a confirmed short signal before considering bearish positions. Otherwise, the ongoing bullish momentum is likely to persist. The MastersCycle indicator has signaled a buy, with a suggested stop-loss at 5100.
Disclaimer: This is a personal market view. Traders are encouraged to rely on their own technical analysis and always trade with an appropriate stop-loss.

S&P 500 Index intraday trend analysis for April 01, 2025The intraday trend confirmed Sell signals with a stop loss at 5650. It may take support at 5613 and 5575 on the lower side. The support levels are in degrees of Square of 9.

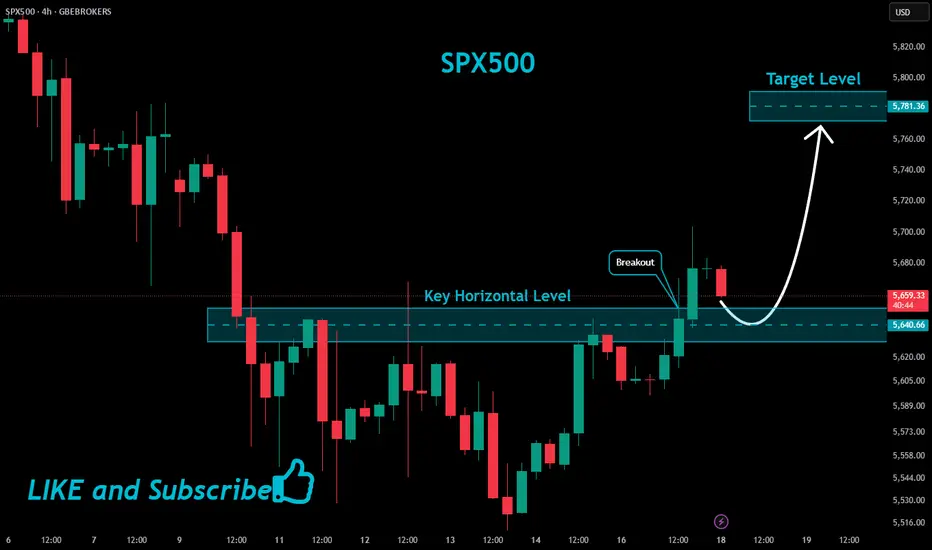
SPX500 Move Up Expected!
HI,Traders !
SPX500 made a bullish
Breakout of the key horizontal
Level of 5640.66 and the
Breakout is confirmed
Because the daily candle
Closed above the key level
So on the market open
We will be expecting a
Local pullback and then
A strong move up !
Comment and subscribe to help us grow !
"SPX500USD" Indices Market Bearish Heist Plan🌟Hi! Hola! Ola! Bonjour! Hallo!🌟
Dear Money Makers & Robbers, 🤑 💰🐱👤🐱🏍
Based on 🔥Thief Trading style technical and fundamental analysis🔥, here is our master plan to heist the "SPX500USD" Indices Market. Please adhere to the strategy I've outlined in the chart, which emphasizes short entry. Our aim is the high-risk Green Zone. Risky level, oversold market, consolidation, trend reversal, trap at the level where traders and bullish thieves are getting stronger. 🏆💸Book Profits Be wealthy and safe trade.💪🏆🎉
Entry 📈 : "The heist is on! Sell below (5930) then make your move - Bearish profits await!"
however I advise placing Sell Stop Orders below the breakout MA or Place Sell limit orders within a 15 or 30 minute timeframe. Entry from the most recent or closest low or high level should be in retest. I Highly recommended you to put alert in your chart.
Stop Loss 🛑: Thief SL placed at 6025 (swing Trade Basis) Using the 4H period, the recent / swing high or low level.
SL is based on your risk of the trade, lot size and how many multiple orders you have to take.
Target 🎯:
Primary Target - 5875 (or) Escape Before the Target
Secondary Target - 5750 (or) Escape Before the Target
🧲Scalpers, take note 👀 : only scalp on the Short side. If you have a lot of money, you can go straight away; if not, you can join swing traders and carry out the robbery plan. Use trailing SL to safeguard your money 💰.
📰🗞️Fundamental, Macro, COT, Sentimental Outlook:
"SPX500USD" Indices Market is currently experiencing a Bearish trend., driven by several key factors.
👉Fundamental Analysis
Earnings Growth: The SPX500 earnings growth rate is expected to slow down in 2025, driven by economic uncertainty and trade tensions.
Valuation: The SPX500 forward P/E ratio is around 17.5, slightly below the historical average.
Dividend Yield: The SPX500 dividend yield is around 2.0%, relatively attractive compared to other asset classes.
👉Macro Economics
GDP Growth: The US GDP growth rate is expected to slow down in 2025, driven by economic uncertainty and trade tensions.
Inflation: The US inflation rate is expected to remain around 2.0% in 2025, slightly above the Federal Reserve's target.
Interest Rates: The Federal Reserve is expected to keep interest rates relatively stable in 2025, with a possible rate cut in the second half of the year.
👉COT Data
Commitment of Traders: The COT data shows that large speculators are net short SPX500, indicating a bearish sentiment.
Open Interest: The open interest in SPX500 futures is decreasing, indicating a declining interest in the market.
👉Market Sentimental Analysis
Bearish Sentiment: The market sentiment is currently bearish, with many investors expecting the SPX500 to continue its downward trend.
Risk Aversion: The market is experiencing high risk aversion, with investors seeking safe-haven assets such as bonds and gold.
👉Positioning
Short Positions: Many investors are holding short positions in SPX500, expecting the index to continue its downward trend.
Long Positions: Some investors are holding long positions in SPX500, expecting a potential bounce or reversal.
👉Next Trend Move
Bearish Trend: The current trend is bearish, with the SPX500 expected to continue its downward trend driven by economic uncertainty and trade tensions.
Support Levels: The next support levels are seen at 5700 and 5600.
👉Overall Summary Outlook
Bearish Outlook: The overall outlook for SPX500 is bearish, driven by economic uncertainty, trade tensions, and slowing earnings growth.
Volatility: The market is expected to remain volatile, with investors closely watching economic data, earnings reports, and geopolitical developments.
👉Real-Time Market Feed
SPX500 Price: 5990.0
24-Hour Change: -1.2%
24-Hour High: 6050.0
24-Hour Low: 5950.0
Trading Volume: 2.2 billion
👉Prediction Next Target
T1: 5875 (short-term target)
T2: 5750 (medium-term target)
T3: 5650 (long-term target)
📌Keep in mind that these factors can change rapidly, and it's essential to stay up-to-date with market developments and adjust your analysis accordingly.
⚠️Trading Alert : News Releases and Position Management 📰 🗞️ 🚫🚏
As a reminder, news releases can have a significant impact on market prices and volatility. To minimize potential losses and protect your running positions,
we recommend the following:
Avoid taking new trades during news releases
Use trailing stop-loss orders to protect your running positions and lock in profits
💖Supporting our robbery plan 💥Hit the Boost Button💥 will enable us to effortlessly make and steal money 💰💵. Boost the strength of our robbery team. Every day in this market make money with ease by using the Thief Trading Style.🏆💪🤝❤️🎉🚀
I'll see you soon with another heist plan, so stay tuned 🤑🐱👤🤗🤩

Don't Miss Out We Predicted S&P 500 Drop to 5740 It Happened📉 Don't Miss Out – We Predicted S&P 500 Drop to 5740 , and It Happened! 🔥
In our previous recommendation, we clearly stated that S&P 500 would drop to 5740 , and it happened exactly as predicted, reaching the 61% Fibonacci level! ✅
🚨 Will You Wait Until You Fall with Losing Stocks? 🚨
The market doesn’t wait, and opportunities don’t last forever! If you’ve been following our recommendations, you’ve avoided the collapsing stocks we warned about.
⚠️ Don’t let the market get ahead of you – Follow our recommendations to stay on the winning side! 🔥💰
#SPX500 #Trading #TechnicalAnalysis #InvestmentOpportunities

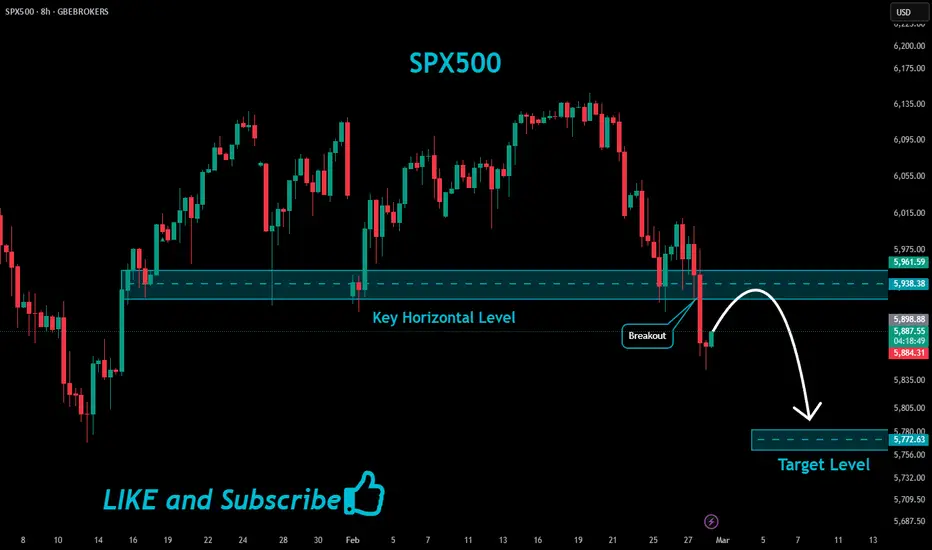
SPX500 Bearish Breakout!
HI,Traders !
SPX500 is going down
And the Indice made a bearish
Breakout of the key horizontal
Level of 5938.38 and the
Breakout is confirmed so we
Are bearish biased and we
Will be expecting a further
Bearish move down!
Comment and subscribe to help us grow !
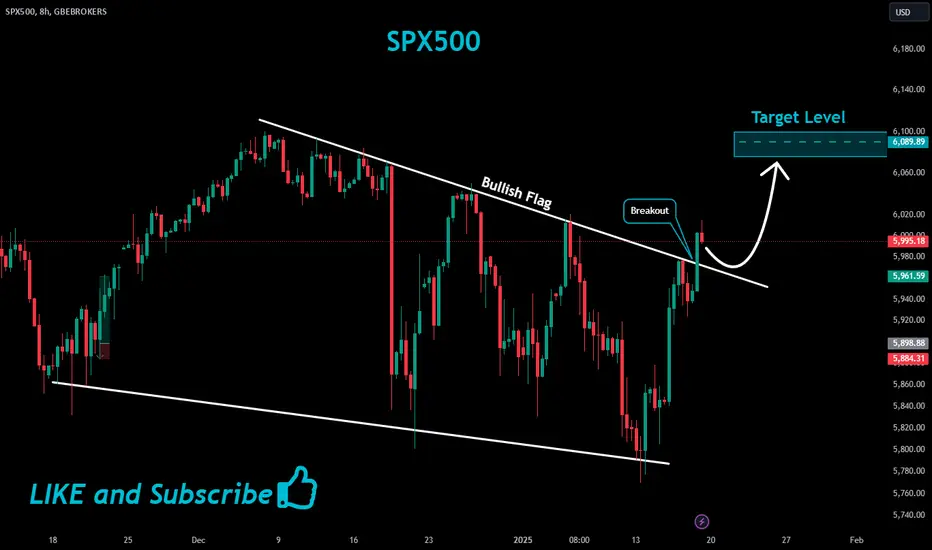
SPX500 Bullish Bias!
HI,Traders !
SPX500 is trading in an
Uptrend and the Indice has
Formed a bullish flag
Pattern so as the Indice
Is breaking out we
Are bullish biased
And we will be expecting
A further move up!
Comment and subscribe to help us grow!
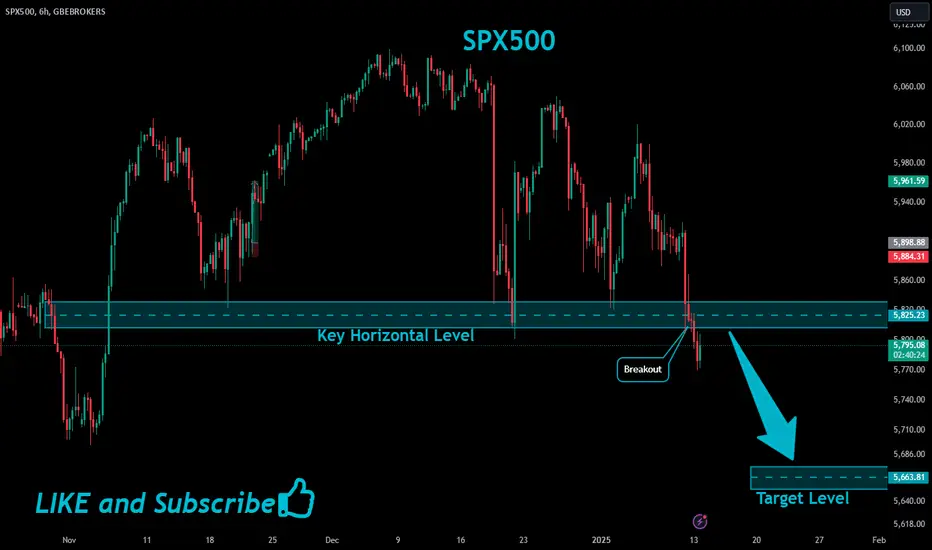
SPX500 Will Keep Falling!HI,Traders !
SPX500 broke the key
Horizontal level of 5825.23
While trading in a downtrend
So we are bearish biased and
We will be expecting a further
Bearish move down !
Comment and subscribe to help us grow!
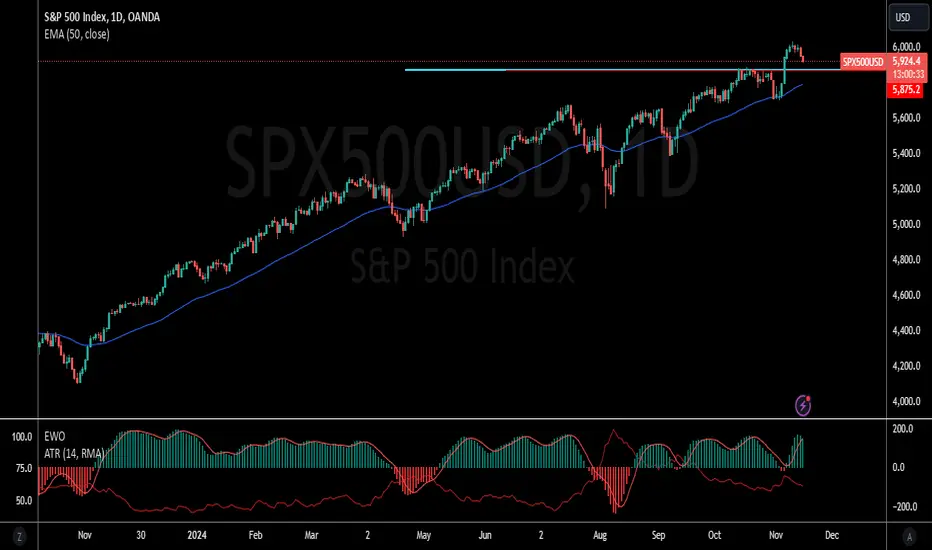
S&P 500 Potentially BullishFOREXCOM:SPX500 has been in a bullish direction. We have seen it make new highs and right now it is coming for a retest on the previously broken high. I will wait for a retest and see some price action at the 5,875.2 area before going long.
Until then, fingers crossed.
Past results does not guarantee future results, please do your due diligence
Like and follow for more
S&P 500 Index→Simple Analysis SP:SPX The S&P500 index (SPX) has had an excellent run since the time (August 28, see chart below) we introduced the following piece of analysis on the similarities between the 2015 - 2017 fractal and today's 2022 - 2024:
If it continues to replicate the past pattern into the 2018 fractal as well, then we may experience the last correction of the Bull Cycle around March 2025 towards the 1W MA50 (blue trend-line) as it happened in February - March 2018 and then the final rally to a new All Time High (ATH) towards the end of the year (October - December 2025).
What this pattern shows, and what we've presented to you as a possible scenario on previous analyses, is for a new Bear Cycle to begin in 2026, four years after the Inflation Crisis of 2022, that will once more test the 1W MA200 (orange trend-line), which is the market's long-term Support.
As a side-note to investors, it is important to understand that corrections are cyclical and crises systemic. Long-term, multi-year patterns like this, help us understand with a certain degree of efficiency, when to enter and when to exit. Timing is at times (especially on such long-term horizons), more important than pricing.

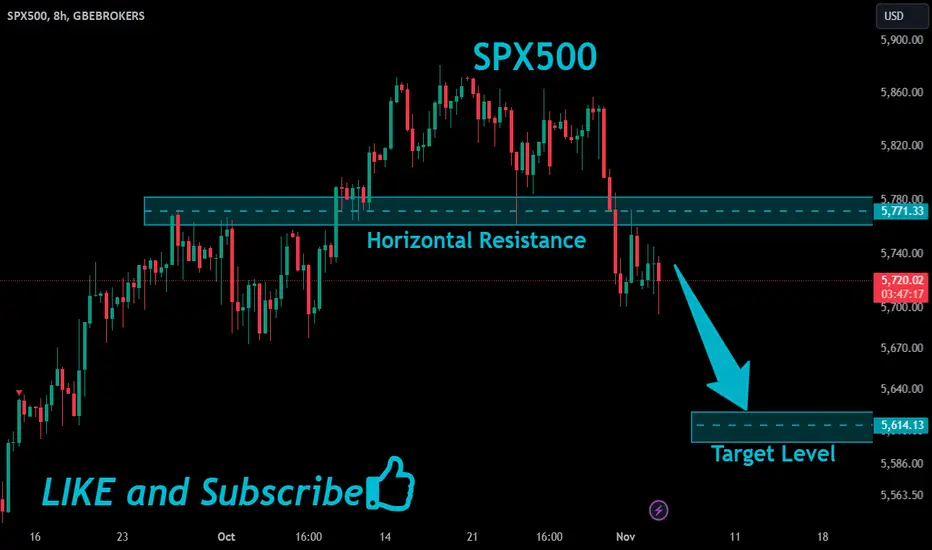
SPX500 Will Fall!FOREXCOM:SPX500 is trading in a
Downtrend and the indice
Is making a pullback
From the horizontal resistance
Of 5771.33 from where
We will be expecting a
Further move down !
SPX500 Potential Short!SPX500 made a strong
Move upwards and the indice
Will soon retest a horizontal
Resistance of 5859.42 from
Where we will be expecting
A local bearish pullback
And a move down !

SPX500 Will Go Down!SPX500 is going down
Now after the bearish
Breakout of the rising support
So after a potential local
Pullback we will be
Expecting a further move down

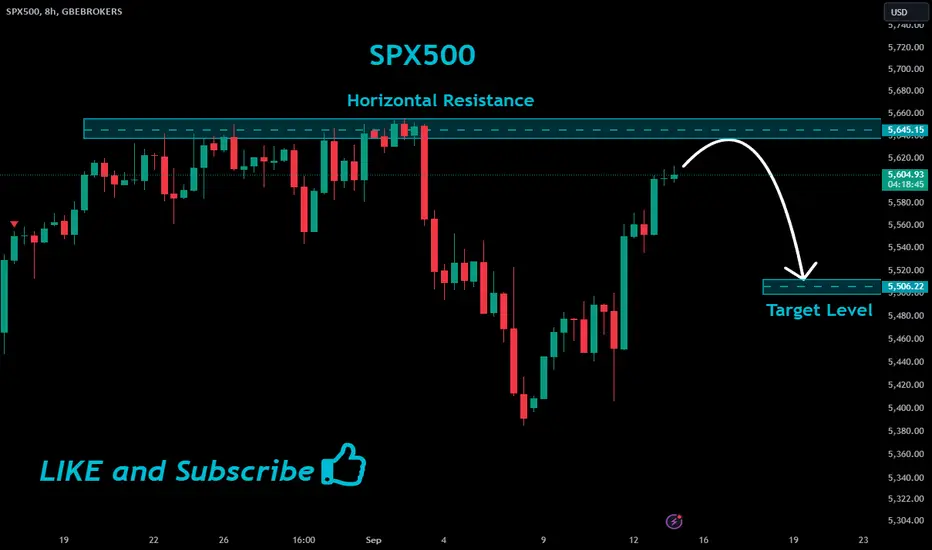
SPX500 Resistance Ahead!SPX500 keep growing in
An uptrend but the index
Will soon hit a horizontal
Resistance of 5645.15 and
After the retest we will
Be expecting a local
Bearish reaction!
SPX500 Potential Long!SPX500 is trading in an
Uptrend and indice is now
Making a pullback to
Retest a horizontal support
Of 5645.80 so after the retest
We will be expecting
A local bullish rebound !

SPX500 Resistance Ahead!SPX500 is making a bullish
Correction and will soon
Hit a horizontal resistance
Level of 5492.01 from where
We will be expecting a
Further move down !

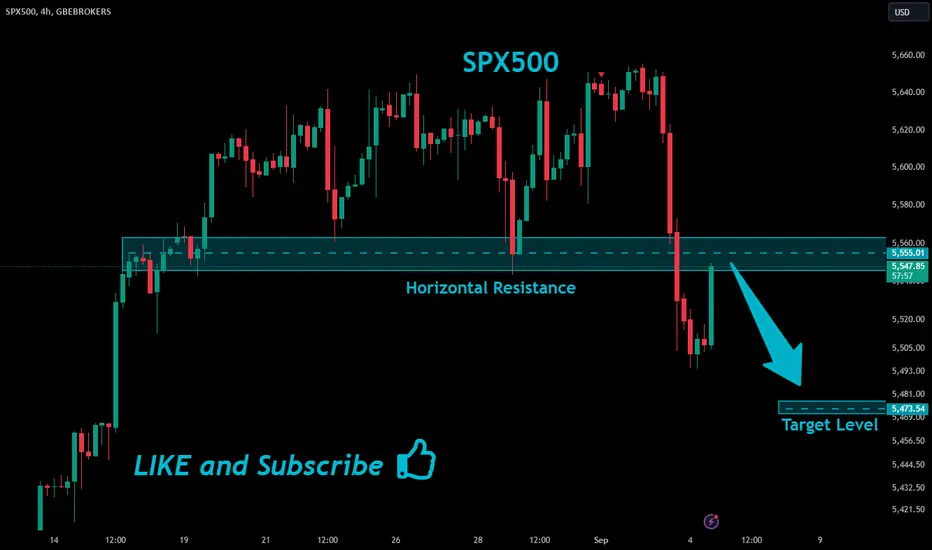
SPX500 Will Fall! SPX500 made a swift
Bullish recovery from the
Lows but the Indice is now
Retesting a horizontal
Resistance level of 5555.01 we will be
Expecting a local
Bearish correction!