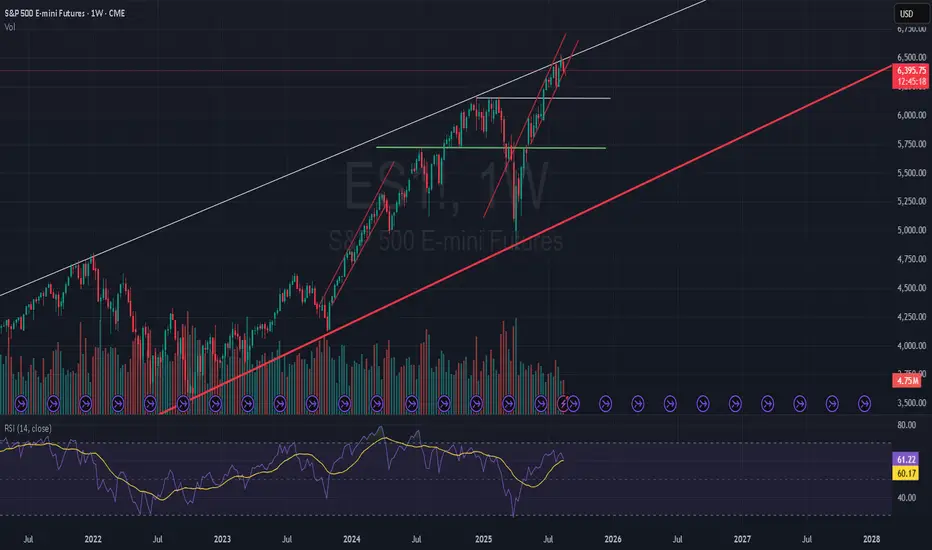
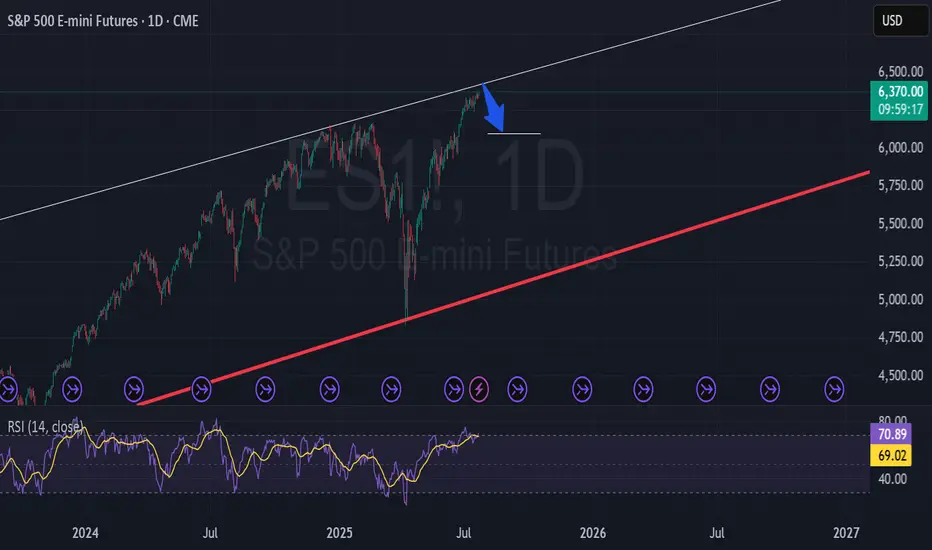
S&P500 about to BREAK downLook at the chart, its very EVIDENT. with this overbought and bullish sentiment, i expect the markets to CORRECT further. its still extreme greedy. You can see the support lines. S&P can correct somewhere between 5-9%. Be prepared.
SP:SPX TVC:SPX CBOE:SPX SPREADEX:SPX CBOE:XSP
US SPX 500
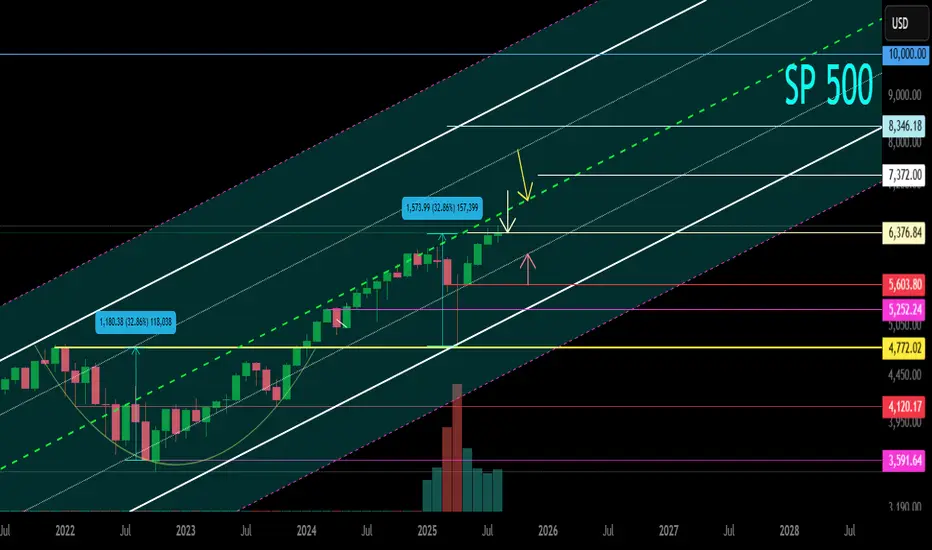
SP500 Secondary trend. Part of the channel. Reversal zone. 2025 Logarithm. Time frame 1 month (less is not necessary). The SP500 index primarily reflects the "health" of the American stock market and the economy as a whole. This is reflected in all markets by the domino effect.
Now, after a huge takeout and recovery, the price is at the maximums of the local trend that has formed, and this is also the maximum of the index as a whole for its entire 100-year existence (before displaying on the chart).
🔄 Locally, the price has run into the resistance of the median of the ascending channel (green dotted line). Now the resistance level of this zone will be formed.
🟢 A breakout of this zone upwards - an exit above the median, promises strong growth and pumping of the stock market as a whole.
🔴 And the reverse process is not a breakthrough and not a consolidation above this zone - consolidation in the range under resistance and above the dynamic support of the internal channel. An extremely negative case is a decline in the lower zone of the channel.
🧠 The chart as a whole shows the channel range itself. Including on both sides, price slippage zones (low probability), as well as key support / resistance levels of this secondary trend that exist, and those that will be formed in the future, but will be key for the development of the trend. This can be an addition to the analysis and formation of tactics and money management in other markets, including cryptocurrency.
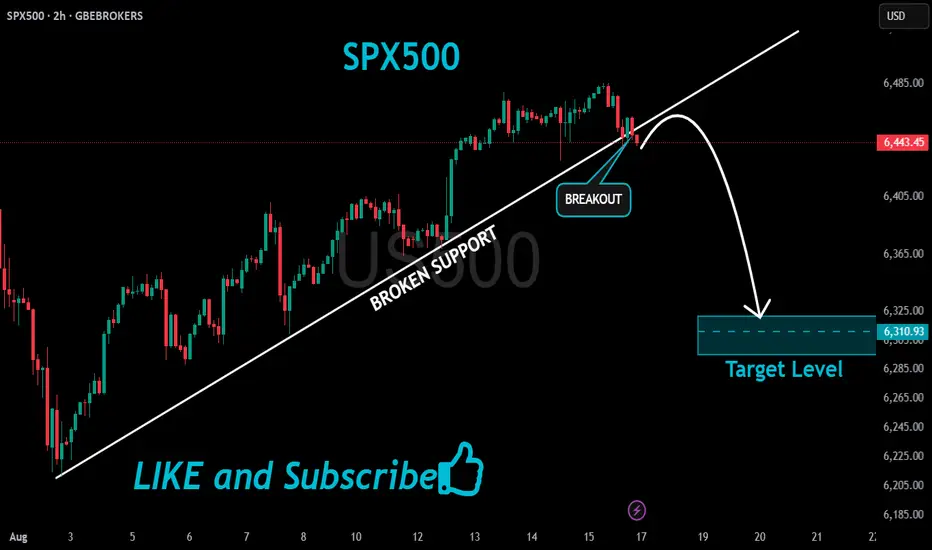
SPX500 Bearish Breakout!
HI,Traders !
#SPX500 made a bearish
Breakout of the rising support
Line and we are bearish biased
So we will be expecting a
Further bearish move down !
Comment and subscribe to help us grow !
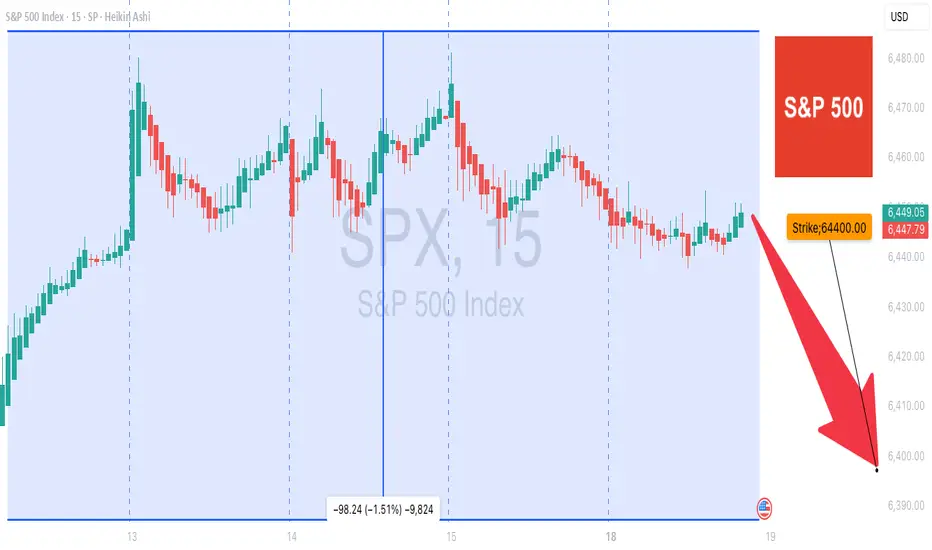
SPX Weak Bearish Bias → 6440P Caution Trade
# 🏦 SPX Weekly Options Analysis – 8/18
📉 **Market Context**
* Mixed signals across metrics → weak bearish bias
* Price below VWAP → potential short-term downside
* Volume insufficient → low conviction
* Call/Put ratio neutral → no strong directional bias
---
## 🎯 Trade Setup (Cautious Put)
* **Instrument**: SPX
* **Direction**: PUT (SHORT)
* **Strike**: 6440
* **Expiry**: 2025-08-18
* **Entry Price**: \$0.60
* **Profit Target**: \$1.20
* **Stop Loss**: \$0.30
* **Size**: 1 contract
* **Confidence**: 60%
* **Entry Timing**: Market Close
---
## 📈 Breakeven @ Expiry
👉 6439.40 (Strike – Premium)
SPX must **close < 6439.40 by market close** to profit at expiry.
---
## 🧠 Key Risks
* Mixed signals → potential whipsaw ⚡
* Market structure unclear → downside not guaranteed
* Theta decay risk → short-term option, fast time decay
---
# ⚡ SPX 6440P SHORT PLAY ⚡
🎯 In: \$0.60 → Out: \$1.20
🛑 Stop: \$0.30
📅 Exp: 8/18
📈 Bias: Weak Bearish, trade cautiously 🐻
---
📊 **TRADE DETAILS JSON**
```json
{
"instrument": "SPX",
"direction": "put",
"strike": 6440.0,
"expiry": "2025-08-18",
"confidence": 0.60,
"profit_target": 1.20,
"stop_loss": 0.30,
"size": 1,
"entry_price": 0.60,
"entry_timing": "close",
"signal_publish_time": "2025-08-18 15:02:25 UTC-04:00"
}
"US500 BREAKOUT – TIME TO LOAD LIMIT ORDERS FOR THE PUMP?"🔥🦹♂️ "SPX500 BANK HEIST – LAYERED BULL RAID IN PROGRESS!" 💰📈
(Thief Trader’s Multi-Limit Order Bullish Ambush – No Weak Hands Allowed)
📍 ASSET: US500 / SPX500 (S&P 500 INDEX)
🎯 HEIST PLAN: BULLISH BREAKOUT
💣 ENTRY: ANY PRICE LEVEL (Thieves use Layered Limit Orders – adapt like a pro!)
🔫 SAMPLE LAYERS: (Scale in like a boss!)
BUY LIMIT LAYER 1: 6475.00
BUY LIMIT LAYER 2: 6460.00
BUY LIMIT LAYER 3: 6440.00
(Add more layers if needed – flexibility is key!)
🛑 STOP LOSS: 6400.00 (Thief’s Emergency Exit – adjust based on your risk!)
🎯 TARGET: 6600.00 (First profit zone – trail or take gains!)
🦹♂️ THIEF TRADER’S MASTER PLAN:
"We don’t ask for permission – we take profits."
🔹 ENTRY TACTICS:
Use multiple limit orders (LAYERED STRATEGY) – like planting timed explosives at key levels.
No panic entries – thieves strike with precision, not emotion.
DCA if needed – but keep bullets for the real move.
🔹 STOP LOSS RULES:
6400 = Danger Zone – if price breaks, abort mission & regroup.
SL too tight? You’ll get stopped out by market noise. SL too wide? You’ll bleed. Find balance.
🔹 TAKE PROFIT STRATEGY:
First TP @ 6600 – secure partial profits.
Let runners ride with trailing stop – or full exit if momentum fades.
🚨 THIEF’S GOLDEN RULES:
✅ Only LONG – no revenge shorts, no greed traps.
✅ Trade in SILENCE – avoid high-impact news (CPI, NFP, Fed).
✅ Risk management = Survival – don’t blow your account on one play.
✅ BOOST & SHARE – if this plan helps, spread the word!
📢 FINAL WARNING:
"This is not financial advice – it’s a thief’s blueprint.
Plan your escape before entry. Market heists require discipline."
💬 COMMENT "ROBBING SPX" if you’re in!
🔥 LIKE & BOOST if you ride with the Thief Trader crew!
🦹♂️ THIEF TRADER OUT.
💸 STEAL SMART. GET RICH. REPEAT.
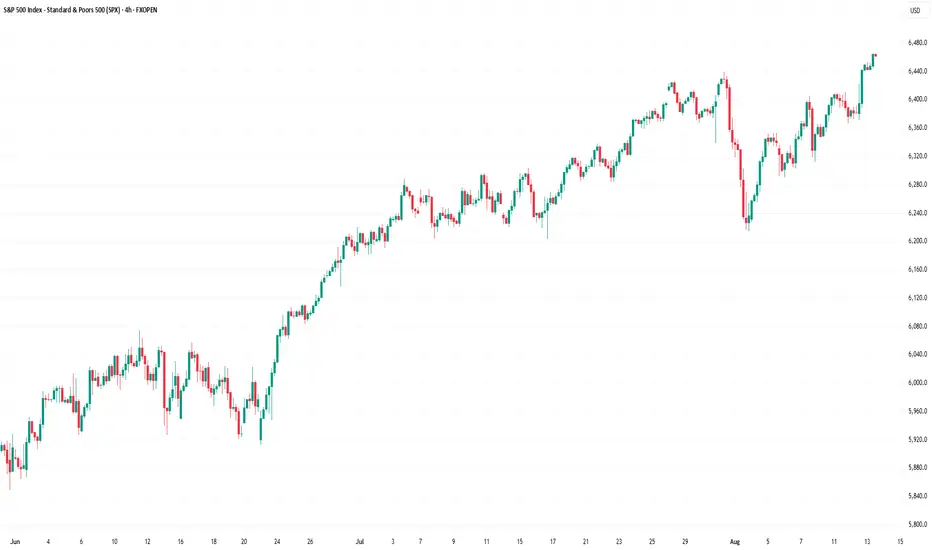
S&P 500 Index Reaches New All-Time HighS&P 500 Index Reaches New All-Time High
The S&P 500 index set a new all-time high, climbing above the 6,460 mark. The rally in equities is a direct result of yesterday’s CPI report.
According to Forex Factory, the annual CPI remained at 2.7%, whereas analysts had forecast an increase to 2.8%. Moderate inflation readings provide stronger grounds for a Federal Reserve interest rate cut — a move President Trump has been strongly advocating.
Data from the CME FedWatch tool shows that traders now price in a 94% probability of a key rate cut in September, compared to nearly 86% the day before and around 57% a month ago. This prospect of monetary policy easing acts as a bullish driver for the stock market.
Technical Analysis of the S&P 500 Chart
On the H4 chart of the S&P 500, there are grounds to outline an ascending channel (shown in blue). The price is currently in the upper half of the channel — a sign of prevailing optimism in the market.
Following yesterday’s CPI release, the price generated a strong bullish impulse, breaking two resistance levels from below (as indicated by the arrow):
→ August high at 6,406
→ Previous all-time high around 6,440
As a result, these former resistance levels now form the 6,406–6,440 zone. We can assume that:
→ this area may act as support going forward, as buyers clearly held the advantage here;
→ the median line of the ascending channel may also provide support, having shown signs of resistance in early August before being decisively broken on yesterday’s strong impulse.
The RSI indicator is hovering near overbought territory, making the market vulnerable to corrections. However, given the improved fundamental backdrop, any pullbacks might be shallow.
In the short term, the S&P 500 may reach the upper orange line, which defines the growth trajectory from the lower to the upper boundary of the long-term ascending channel. Should the fundamental outlook be further reinforced by positive news — for example, relating to a US–Russia leaders’ meeting — the index could advance towards the upper boundary of the blue channel.
This article represents the opinion of the Companies operating under the FXOpen brand only. It is not to be construed as an offer, solicitation, or recommendation with respect to products and services provided by the Companies operating under the FXOpen brand, nor is it to be considered financial advice.
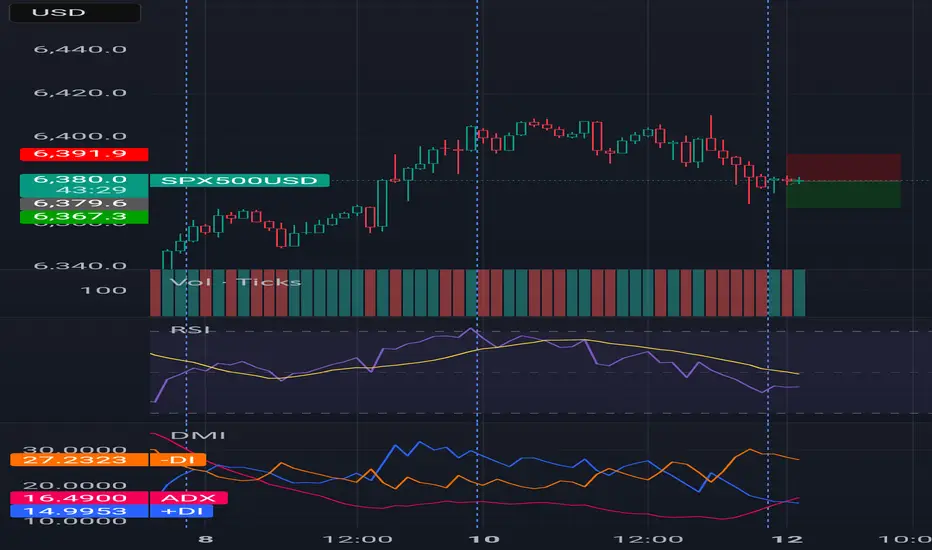
Spx500 usdGetting some pips before spx going up again,
This is my bet in the meanwhile,
Dyor always.
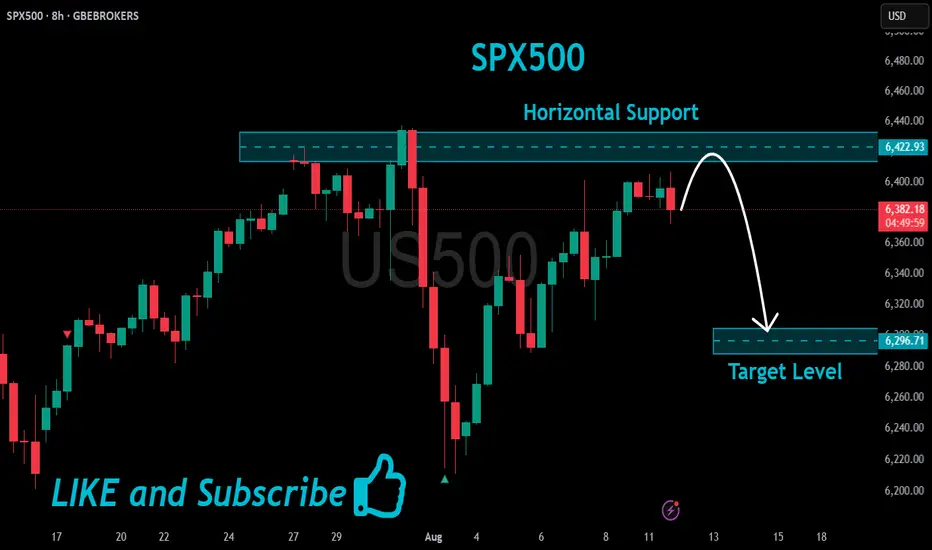
SPX500 Swing Short!
HI,Traders !
#SPX500 keeps growing
And is locally overbought
So after the price hit a very
Strong resistance level
Around 6422.93 we will be
Expecting a pullback and
A local bearish correction !
Comment and subscribe to help us grow !
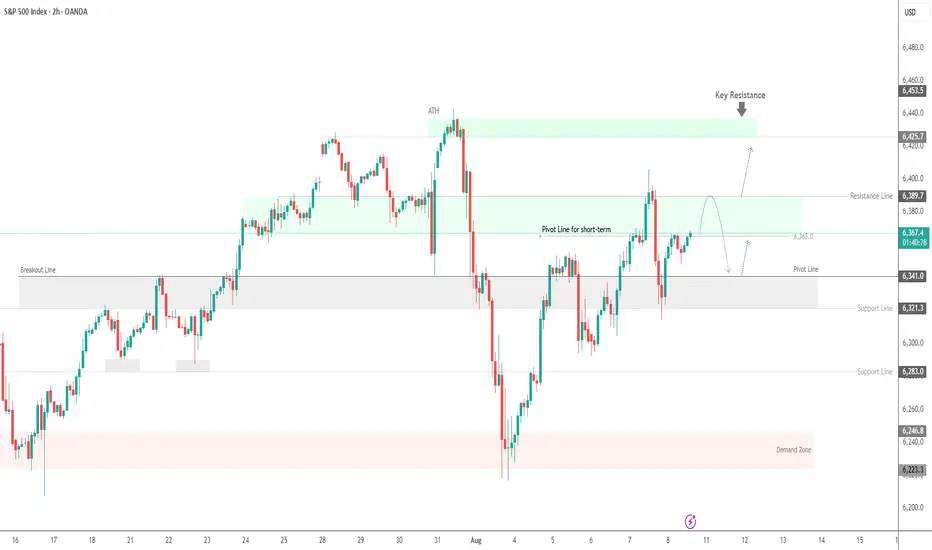
SPX500 at Key Pivot – Bearish Below 6365, Bullish AboveSPX500 – Market Overview
U.S. stock index futures rose on Friday after President Donald Trump’s temporary pick for a Federal Reserve governor boosted expectations for a more dovish central bank board.
Technical Outlook
Stability below 6365, we expect a move down toward 6341.
A 1H close below 6321 would likely extend the bearish trend toward 6301.
A 1H close above 6365 could trigger a push toward 6389.
A confirmed break above 6389 would shift the bias to bullish, targeting 6425 and 6453.
Pivot Line: 6365
Resistance: 6389 – 6425 – 6453
Support: 6341 – 6321 – 6301
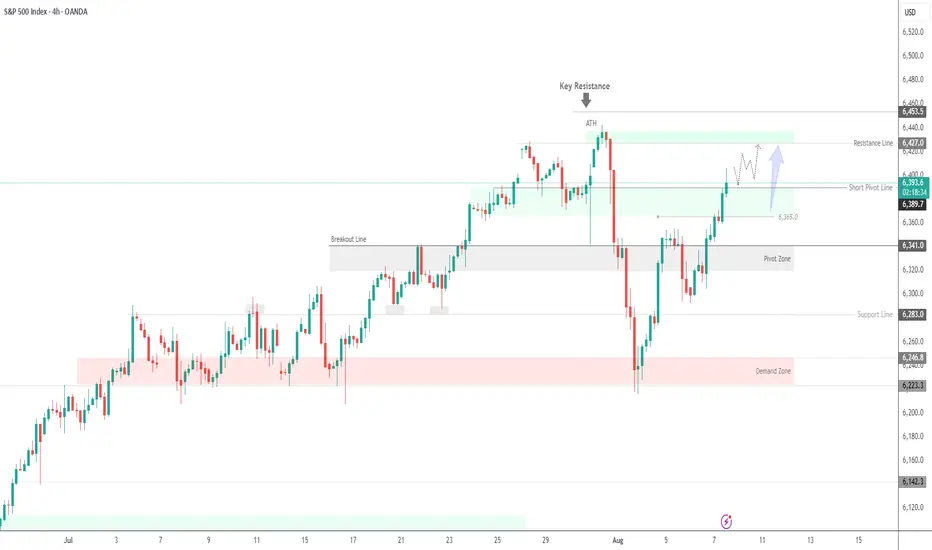
S&P 500 Futures Hold Ground After Tariffs Take EffectS&P 500 Futures Rise After New Tariffs Kick In
President Trump's sweeping tariffs officially took effect just after midnight, escalating trade tensions with dozens of countries. While negotiations are ongoing behind the scenes to secure exemptions and reduce tariff rates, market reactions are already underway.
Technical Outlook
S&P 500 Futures continue to show bullish momentum as long as price trades above 6289, with the potential to retest the All-Time High (ATH).
To confirm a move toward 6453, price must close above 6437 on the 1H chart.
🔻 However, if the price stabilizes below 6389, a correction toward 6365 becomes more likely.
Key Levels:
🔹 Resistance: 6424 – 6453
🔹 Support: 6365 – 6341
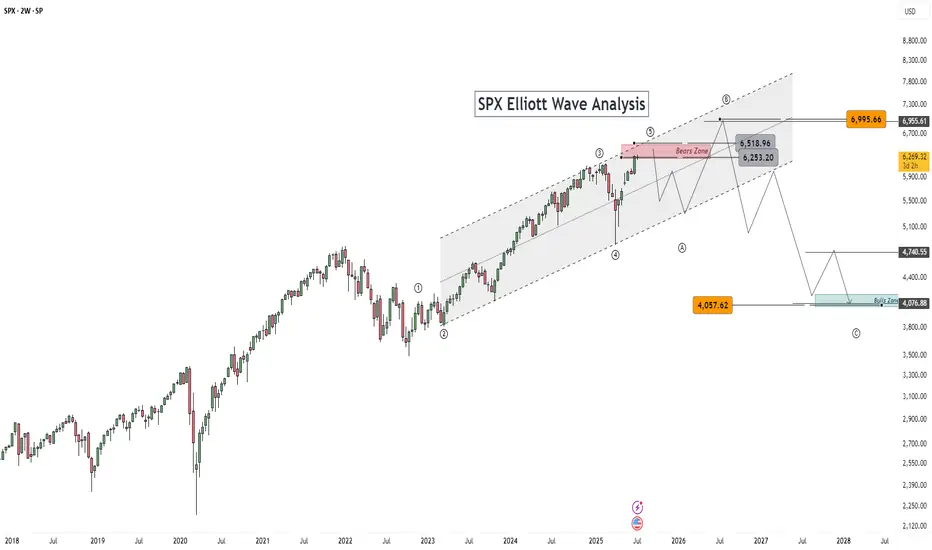
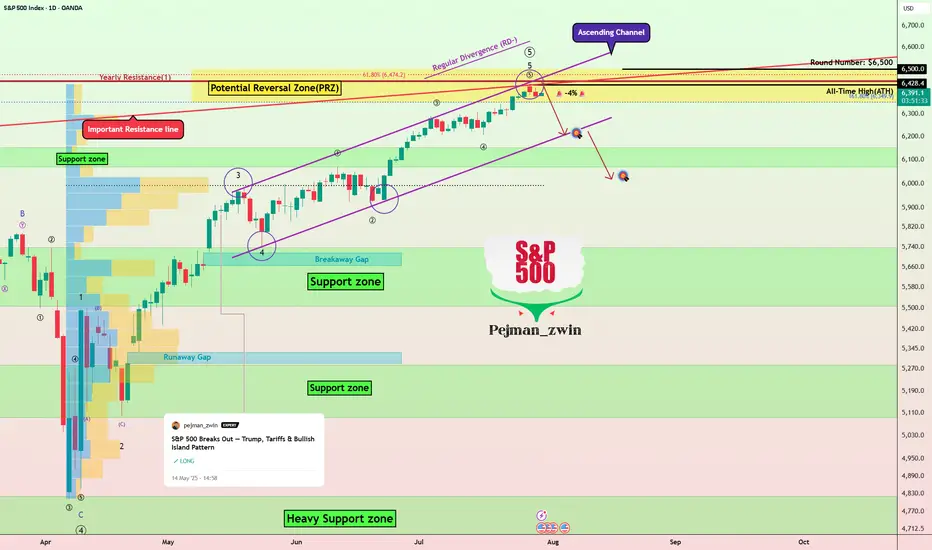
S&P500’s Bullish Island Turns Risky: Elliott Wave Says “Top”The S&P500 Index( SP:SPX ) started to rise and even created a new All-Time High(ATH=$6,428) with the help of the Bullish Long Island Pattern , as I published in my previous idea on May 14, 2025 .
The S&P500 Index is currently moving near the Potential Reversal Zone(PRZ) , upper line of the ascending channel , the Important Resistance line , and the Yearly Resistance(1) .
In terms of Elliott Wave theory , the S&P500 Index appears to be completing microwave 5 of microwave 5 of the main wave 5 .
Also, we can see the Regular Divergence(RD-) between Consecutive Peaks .
I expect the S&P500 Index to correct at least -4% and fall to the lower line of the ascending channel .
First Target: $6,233
Second Target: $6,033
Note: Stop Loss(SL) $6,513
Do you think S&P500 Index can create a new ATH above $6,500 !?
Please respect each other's ideas and express them politely if you agree or disagree.
S&P 500 Index Analyze (SPX500USD), Daily time frame.
Be sure to follow the updated ideas.
Do not forget to put a Stop loss for your positions (For every position you want to open).
Please follow your strategy and updates; this is just my Idea, and I will gladly see your ideas in this post.
Please do not forget the ✅' like '✅ button 🙏😊 & Share it with your friends; thanks, and Trade safe.
Rob the Rally SPX500: Enter Before Resistance Catches You🦹♂️💎 “SPX500 Vault Breach – Layered Robbery in Progress!” 💼📈
(Thief Trader's Multi-Limit Entry Bullish Blueprint – No Mercy, Just Money)
📍Asset: SPX500 / US500
🎯Plan: Bullish Heist
🧠Style: Layered Limit Orders | Thief Strategy Entry | Zero Mercy Execution
📈Target: 6600.00
🛑Stop Loss: 6200.00
💣Entry: Any level — thieves adapt, not wait!
🌍 Welcome to the Global Robbery Room, Traders!
It’s your boy Thief Trader, back in the vault with another plan to crack the SPX500 like a safe on Wall Street. This one’s for the bold bulls who like to rob with precision, not permission. 🎯💰
💼 The Setup – High Stakes, High Floors
SPX500 is lining up for a classic breakout breach. This isn’t just technical — it’s tactical warfare. Market noise? Ignore it. We operate on strategy and steel nerves. 🧠🔫
🔥 Entry Protocol – Layer Up or Miss Out
🧱 Multiple limit orders across price zones — like planting C4 charges on every door.
🎯 Enter wherever price dips — don’t wait for permission from retail traders.
🎯 No fixed entry — this is Thief Layering: get in where you fit in.
🚪 Escape Plan – Stop Loss Strategy
📍 SL: 6200.00
Why? That’s where the guards start showing up. If price drops below, we vanish.
💡 Be flexible — smart robbers don’t get caught, they regroup.
💎 Target Loot – The Golden Zone
📍 Primary TP: 6600.00
Once we breach the 6500+ resistance, it's a moonwalk. Lock gains or trail with confidence.
📢 Warning for Scalpers & Swing Thieves Alike:
Only play Long-side. Don’t try to rob both ends — that’s suicide.
Big wallet? Scale heavy. Small bag? Layer light but tight.
Always use trailing stops — never trust the market with your escape bag. 🎒💸
📊 Thief Intel – Why We’re Bullish
✅ Index rotation favors large-cap strength
✅ Macro sentiment + institutional bias points UP
✅ No bearish COT signals in sight
✅ Fed tone & economic backdrop: neutral to supportive
This isn’t hopium. It’s strategy.
🚨 NEWS FLASH – Stay Stealthy!
Do NOT enter during economic bombs 💣 (NFP, CPI, Fed minutes, etc.)
Market noise kills precision. We only move in silence and with SLs trailing tight.
💬 Smash that BOOST 💖 if you’re riding with the Thief Army.
Share this plan, spread the word, and let’s rob the markets the smart way.
📢 Tag your crew, stack your layers, and let’s hit 6600 like pros.
📌Disclaimer: Not financial advice — this is a market operation plan for educational use. Trade at your own risk. Smart thieves plan exits before entries. 💼📉📈
🦹♂️ Thief Trader out.
💸 Rob smart. Rob clean. Rob global.

SPX500 Dips Ahead of NFP as Tariff Risks RiseSPX: S&P 500 Dips to Close July — Still Positive for the Month Amid Tariff Tensions & Fed Uncertainty
The S&P 500 retreated in the final session of July, weighed down by renewed tariff concerns and lingering uncertainty around the Fed’s next move. Despite the late pullback, the index remains positive for the month overall.
Looking ahead, non-farm payrolls (NFP) and U.S. jobs data are expected to have a strong impact on market direction. In addition, August 1st marks a key date for potential tariff developments, which could trigger further volatility.
Technical Outlook – SPX500
The index has dropped approximately 2.5% since yesterday and maintains a bearish bias as long as it trades below 6283. If the price continues to slide, the next downside target is 6246, with further support at 6223.
However, if the price manages to close above 6289 on the 1H timeframe, it could trigger a bullish recovery toward 6320 and 6341.
Pivot Line: 6283
Support Levels: 6246 • 6223
Resistance Levels: 6320 • 6341
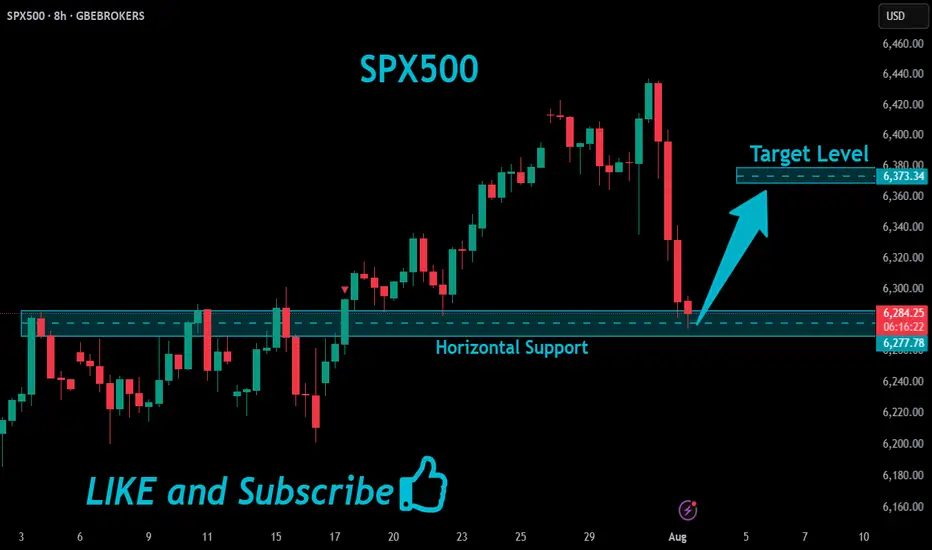
SPX500 Will Go UP!
HI,Traders !
#SPX500 made a retest
Of the horizontal support
Level of 6277.78 and we
Are already seeing a
Bullish rebound so we are
Locally bullish biased and
We will be expecting a
Further bullish move up !
Comment and subscribe to help us grow !
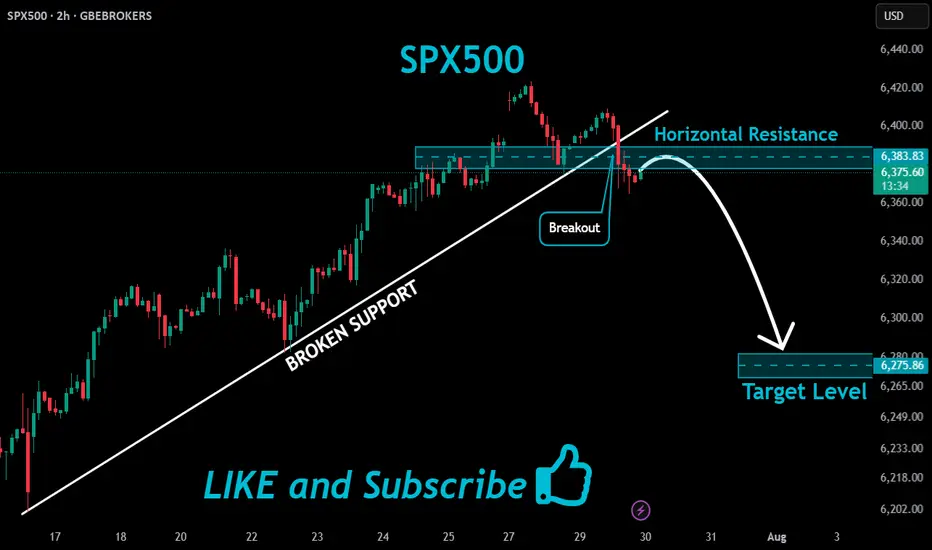
SPX500 Bearish Bias!
HI,Traders !
#SPX500 broke both the
Rising and horizontal
Support line which are
Now resistance areas
And the breakout is
Confirmed so we are
Bearish biased and we
Will be expecting a
Further bearish move down !
Comment and subscribe to help us grow !
New All-Time Highs for S&P 500 – No Resistance AheadThe S&P 500 is officially in price discovery mode, printing new all-time highs with clean higher highs and higher lows.
Each old resistance flipped into strong support—textbook bullish market structure.
As long as this trend holds, there's no ceiling in sight. Bulls are fully in control.

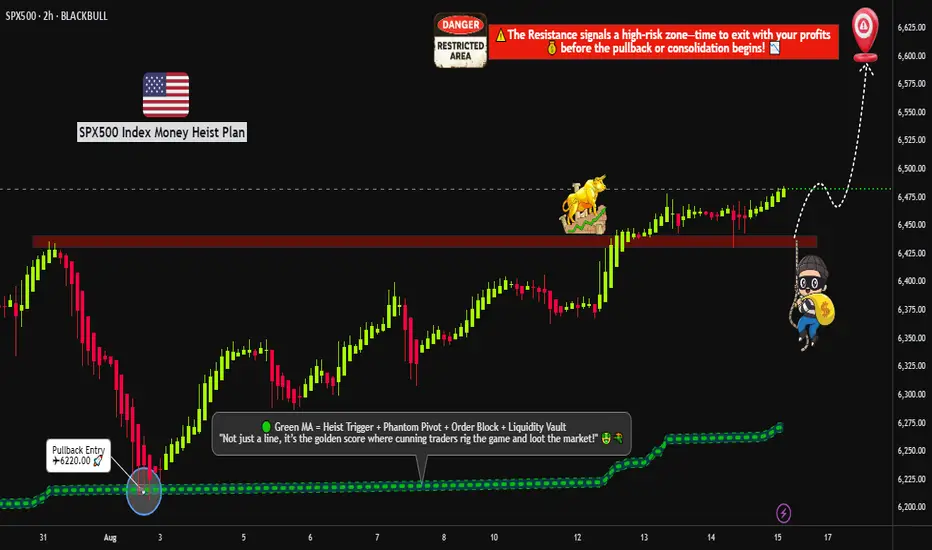
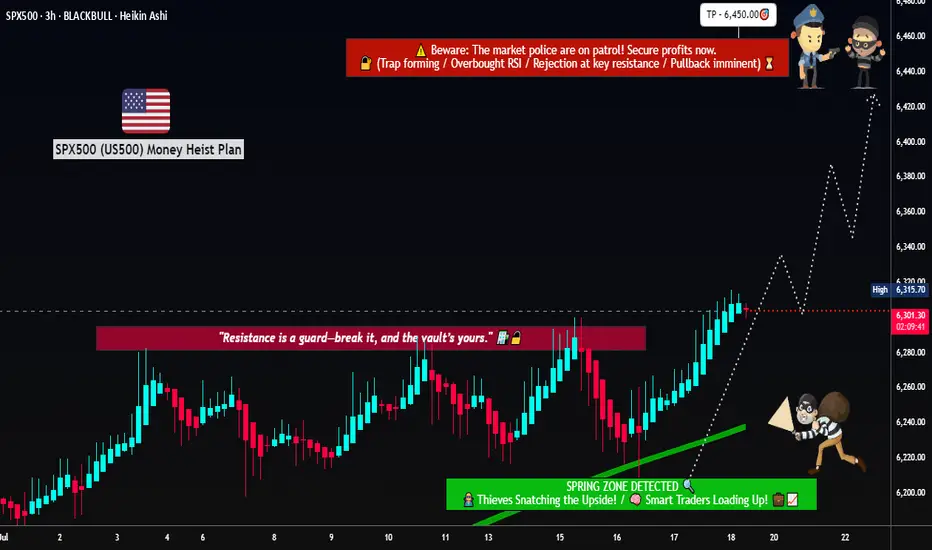
Rob the Rally SPX500: Enter Before Resistance Catches You🦹♂️💰**“SPX500 Street Heist” – Thief-Style Robbery Plan for Bulls!**📈💸
(Powered by Thief Trader's Market Robbing Tactics – Scalp | Swing | Day Trade Edition)
🌍Hello, Global Money Hunters!
📣 Salaam, Bonjour, Ola, Hola, Hallo, Marhaba & Welcome to the heist floor! 🎩💼
Thief Trader is back again with a loaded plan to rob the market clean — this time targeting the mighty SPX500 / US500 🎯. Based on a fusion of technical setups, macro sentiment, and the Thief Trading System, we’ve set our sights on the next breakout vault of Wall Street.
🎯 The Gameplan – Heist the Resistance Vault
The index is entering a high-risk resistance barricade — overbought, consolidated, and heavily guarded by bearish robbers (sellers). This is the zone where the market police lurk and trend reversals often get triggered. However, smart thieves always plan with precision.
Here’s the mission briefing:
🔓Entry Zone (Break-in Point)
💥 “The vault is open — grab the bullish loot!”
Enter Long anywhere close to market price or on pullbacks near recent swing lows/highs.
Preferred timeframes: 15-min to 30-min for sniper-level accuracy.
Deploy DCA-style limit orders (layered entries for maximum control).
🛑Stop Loss (Escape Hatch)
Base SL on recent swing low candle wicks on the 4H timeframe.
Suggested: ~6250.00 — but adapt based on your risk appetite, lot size, and position stacking.
📈Target / Loot Location
🎯 Primary Take-Profit: 6450.00
Or… pull out early if you spot resistance fighters guarding the vault.
Use trailing SL to secure gains and manage getaway.
⚡Scalper’s Notice
Only Long-side allowed!
Got big capital? Jump in now.
Running low? Tag along with swing traders and follow the robbery protocol.
Always protect your bag with dynamic trailing stops.
🧠Fundamental Fuel Behind the Plan
Bullish sentiment across major indices
Macro trends, COT positioning, sentiment outlook, and intermarket analysis all greenlit
Geopolitical and Fed tone supportive — tap into real data before entering
👉 Always analyze: News, Fundamentals, Sentiment, COT reports, and macro conditions.
🚨NEWS ZONE ALERT – No Loud Moves!
Avoid entry during major economic news drops
Use trailing SLs to guard profits
Don’t let your open trades get caught in the chaos of news releases!
💥Let’s Boost the Thief Army!
Smash the BOOST button 💖 to power up the robbery crew.
Support the strategy, share the love, and stay ahead of the game using Thief Trading Style. Every trade is a step closer to freedom from financial traps. 🚀💰🎉
📌Disclaimer: This is a general market analysis for educational purposes and should not be considered personal financial advice. Please evaluate your own risk management strategy before placing trades.
📌Markets shift fast — stay flexible, stay alert, and always rob smart.
🔥Stay locked in for the next heist plan — Thief Trader signing off for now…
💸💼📈 Trade smart. Rob harder. 🤑🦹♂️📊
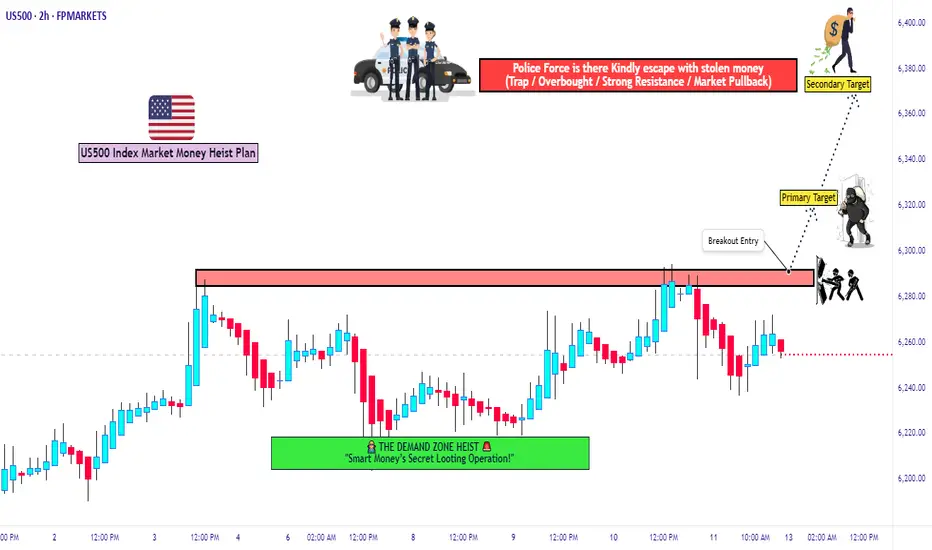
US500 Bulls Assemble | Breakout Heist Strategy📈🚨 MASTER HEIST PLAN: “SPX500 ROBBERY – THIEF TRADING STYLE 🔥💸” 🚨📈
(The Ultimate Long Strategy Blueprint for Smart Day/Swing Traders)
🌍 Greetings to All Market Bandits, Bullish Burglars, and Chart Snipers!
Hola! Bonjour! Ola! Hallo! Marhaba! 🙌
🦹♂️This is your friendly chart thief checking in with the latest SPX500/US500 masterplan!
This isn’t just a trade—it’s a heist 🎯. We’re not here to participate, we’re here to dominate! Welcome to the Thief Trading Style, where we map, trap, and snatch those pips with ruthless precision. 🧠🔍💰
🚀 THIEF TRADE SETUP - SPX500/US500
A mix of technical sniper entries + fundamental black ops analysis = 💸 Maximum Extraction. 💸
🎯 ENTRY PLAN: THE BREAKOUT HEIST
📍Buy Entry Zone: Wait for the clean breakout + candle close above 6270.00.
"The vault opens once we clear that wall. Let the bullish getaway begin!" 💥🚪📈
🛠️Thief Tips for Entry:
Use Buy Stop Orders above resistance levels.
OR layer in Buy Limit Orders near recent pullbacks (15/30m swing zones) using DCA Style (Dollar Cost Average layering like a pro).
Want stealth mode? Set that alert (alarm), and strike when the breakout sings. 🔔🎯
🛑 STOP LOSS – PROTECT THE LOOT
🧨Set your SL smart—beneath the nearest swing low using the 2H timeframe for stronger structure.
💬 “Look, don’t gamble. A thief knows when to run. Set that stop where I showed ya, or risk losin’ the bag.” 💼💣
❗Your SL should reflect your risk per trade, lot size, and number of entries. It’s your getaway plan—don’t mess it up.
💥 TARGETS – WHERE WE CASH OUT
🏴☠️Primary Take Profit (TP1): 6310.00
🏴☠️Secondary Take Profit (TP2): 6370.00
💹 Scalp Traders: Stick to the Long Side Only. Ride the momentum, but use trailing SL to lock it in.
🔍 THIEF FUNDAMENTAL INTEL: WHY THIS IS OUR MOMENT
Current SPX500 bullishness driven by:
✅ Positive macro & geopolitical tailwinds
✅ Institutional positioning (COT reports)
✅ Intermarket analysis showing strong correlations
✅ Momentum building with sentiment and volume
📌 Stay sharp—check all your fundamental reports, news catalysts, and sentiment tools before executing your move. Smart thieves plan every detail. 🎓📊
⚠️ NEWS RELEASE REMINDER
📢 News = Chaos. Don’t get caught in the spray:
🔒Avoid entering trades just before big announcements.
🚀 Use Trailing SL to secure profit if you're already in.
Stay agile. Stay smart. Stay rich. 💼🚁
❤️ SUPPORT THE HEIST – HIT THAT BOOST BUTTON!
👊 Liked the plan? Hit the Boost to join the elite robbery crew.
Every boost fuels the mission. Every like sharpens the strategy. Let's build a team of smart, profitable traders. 🚀💸🔥
🧠 Remember: This is general analysis – not financial advice. Manage your risk like a true thief. Stay updated. Adapt fast. Don't get caught. 🕵️♂️
🎉See you in the next Heist Plan! Keep your tools sharp, your charts cleaner, and your profit bags fatter. 🤑🔥
S&P 500 (CASH 500) SHORT - Double top H8Risk/reward = 4.1
Entry price = 6343.3
Stop loss price = 6365.3
Take profit level 1 (50%) = 6268.1
Take profit level 2 (50%) = 6232.1
Still waiting on some variables on checklist to be confirmed before I enter the trade.

Expect Correction august/septemberMarkets MUST correct, everything is overbought and sentiment is Extreme greed. RSI points to extreme overbought territory, VIX very low and not going any lower (reached bottom).
Usually august/september the market corrects. so i expect a correction around 5-8%.
Be prepared, dont chase FOMO. Be careful.
SP:SPX TVC:SPX CBOE:SPX CBOE:XSP AMEX:SPY
BTC/USD Fake out before Pump | Bullish Flag formationBTC/USDT (1D) Market Outlook – July 1, 2025
Introduction
BTC is currently consolidating within a bullish flag pattern after printing a swing high at 108.9K and a recent swing low at 98K. The price sits just below a major supply zone.
Context 1: Key Zones
Supply: 104.6K – 112.1K
Demand: 74.4K – 82.5K
Fair Value Gaps (FVG): 3 zones below price, with one near 88–90K
Context 2: Technical Confluence
Liquidation Zone: 106.2K
Golden Pocket (Fib 0.618): 102.1K
Psychological Levels: 105K and 110K
Context 3: Market Structure
Pattern: Bullish flag
Trend (LTF): Sideways/consolidation
Volume Profile: Heavy activity near 105K–110K
Bullish Scenario
Breaks above 106.2K (liq zone)
Pulls back to 102.1K (golden pocket), forms higher low
Retests resistance for continuation
Alt scenario: clean breakout above resistance → ATH retest
Bearish Scenario
Breaks below 106.2K and flag support
Fills FVG, breaks prior low at 98K
Triggers macro downtrend toward 88–90K zone
Summary
BTC is at a decision point inside a bullish flag, facing supply. A break above 106.2K favors upside continuation, while rejection and a lower low could trigger a deeper retracement. Watch key levels closely.

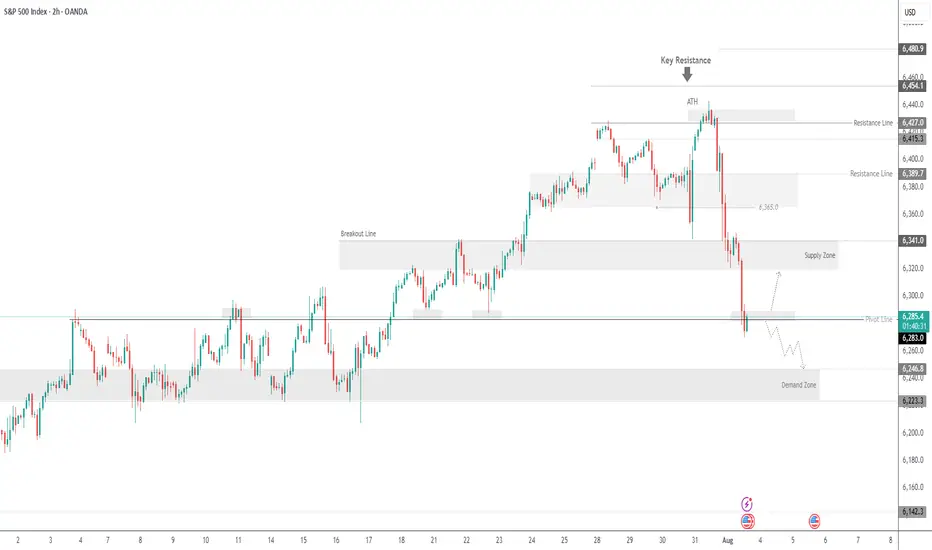
SPX500 Short From Resistance!
HI,Traders !
#SPX500 is trading in an
Uptrend but the price will
Soon hit a horizontal resistance
Area around 6285.44 from
Where we will be expecting
A local bearish correction !
Comment and subscribe to help us grow !

This is just my Elliott Wave Analysis not financial Advice. $SPThis is just my Elliott Wave Analysis not financial Advice. SP:SPX #SPX SP:SPX