SPX Long Term View 4300 becomes the main resistanceMy weekend update is a day early, I will update those who are on my list with a bit more details on shorter time frame view tomorrow.
We are in a bear market and those 5500 callers got destroyed all the way down calling every bottom from Jan.
This is my long term view and I think we have bottomed here today or super close to it!
I got targets for the potential bottom left, all SPX:
- 3643 (came super close to it today)
- 3688.50
- 3555
We clearly had 5 down or A completed on this move! Now the time for the B (still think this will be an ABC correction going into Mar of 2023)
My main target now is 4300, down from 4425. Extension target now is 4425-45 down from 4600
110MA (descending every day) becomes the main magnet for the move up to hit at least
I got 2 main targets to hit for the C, one in Oct/Nov of this year and next one is Mar of 2023.
Ideally we see the first target hit and then some sort of damage control move into the EOY close and finish up in to 2600 handle (2800 at min) in Q1 of 2023.
I was saying for a while now, that the whole move from 2020 will be erased this year, its getting supper close to it now!
That yellow dotted line is line in sand for the bears and bulls, break it above and test it from the top will make me change my view to the whole view and look higher.
Before it happens its the main line Im paying attention to now.
Have a nice day
P.S. next week should rally up and ideally we make a higher low end of the month before the window dressing rally
Spxanalysis

DeGRAM | SPX500 recession fear?SPX went down on fundamentals and made a huge gap.
It will probably try to fill the gap on Monday.
The 4000 level is a great level to take short trades.
-------------------
Share your opinion in the comments and support the idea with like. Thanks for your support!

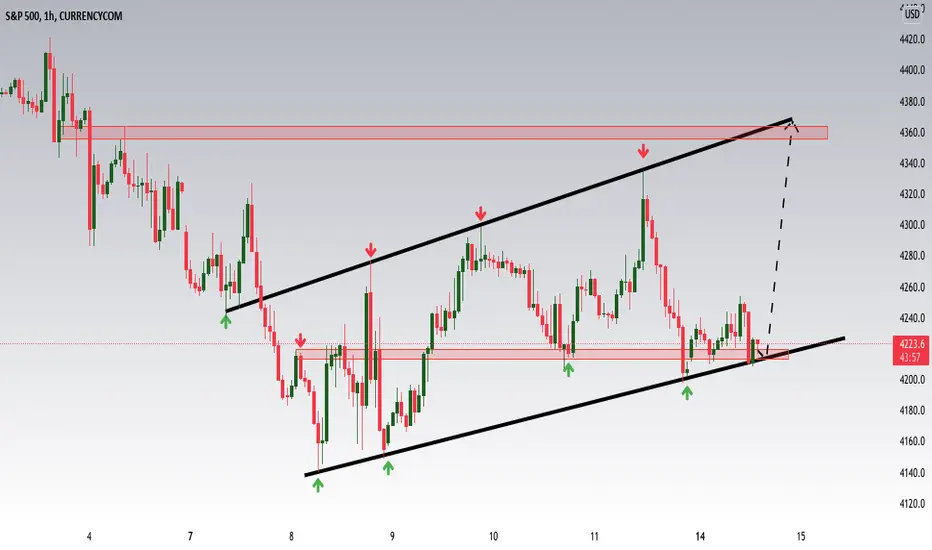
SPX 2 pathwaysIm watching 2 numbers - 3980 and 3950SPX (there is 4008 as a smaller degree support, so far held AHs in futs)
We should hold the am low and rally um into Monday high.
2 pathways:
- either we get to test 4077 (after 4008 or 3980test in am) and decline lower into Monday to 3950
- or just blast up into the 13th high, can stretch to 4215SPX for a fake out move I'm looking for

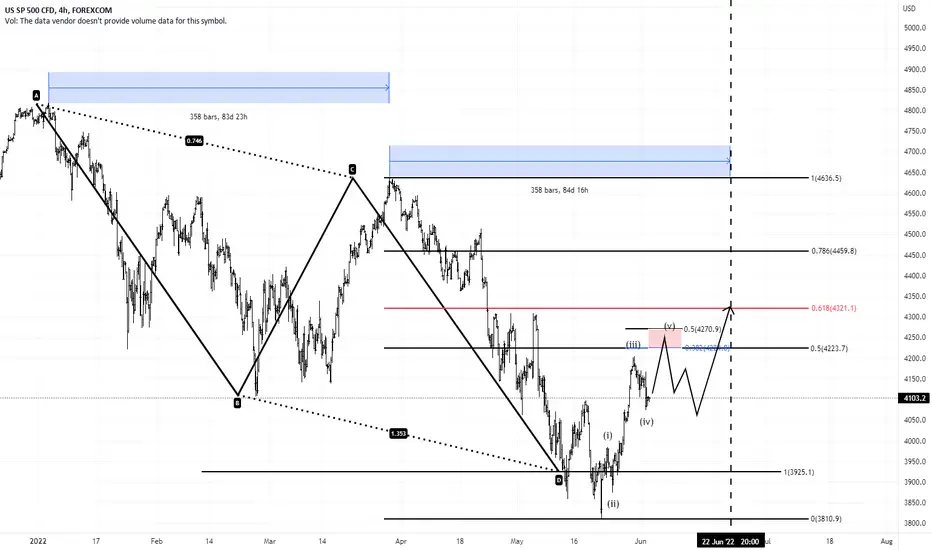
SPX500 - One more rally before sell off. SP:SPX is rallying from the low which completed the ABCD down.
Now im looking for one more rally into 4230-4250 before we get another correction down followed by another rally into 4400-4450.
For this to be correct we need the completion of the 5 waves up, then that will be the start of either a move to all time highs or the start of an ABCD correction to set off the next major sell signal which could see us heading down into the low 3000s.
But for now just following this rally to see where we go next.
If time and price is right the rally should stop around June 22.
Exciting times ahead. 👍👍
$SPX PVI Volatility RangesAnother week of writing successful Credit Spreads on $SPX...almost 49% NET Returns YTD

SPX Weekly RangesHere are the past 7 weeks of PVI Volatility Ranges for SPX . The Ranges are computed every weekend from a myriad of data points and ratios (Index, Volatility variations, SKEW, HV, IV, etc...)
We compute the ranges on the weekend, along with our roadmap & Game Plan for the week ahead. Some of us enter their first tranche on Sunday nights or early Monday (depending on confirmation from Futures ).
We do NOT sell fixed Deltas for our credit spreads, but rather utilize the data driven from our volatility algo for the specific Index (primarily SPX ).
The PVI Weekly SPX Credit Spread portfolio is up just over 47% YTD with 20 straight weeks of profits and zero drawdowns. The ranges have been breached 3 times since the start of 2021 (by an amount greater than 10 SPX points). The system is NOT designed or programed to be perfect, it is to provide us with the most competitive SPX weekly Range with the highest VALUE between Premium & Expectancy

SPX Updated Thoughts 5/19/22I am continuing my bearish sentiment on SPX for now.
Most importantly on this chart is the dotted trendline that shows a support line converting into a resistance line where we are currently
I believe this will lead to bearish results and respect given to the solid downtrend line, finding support once hitting 0.618

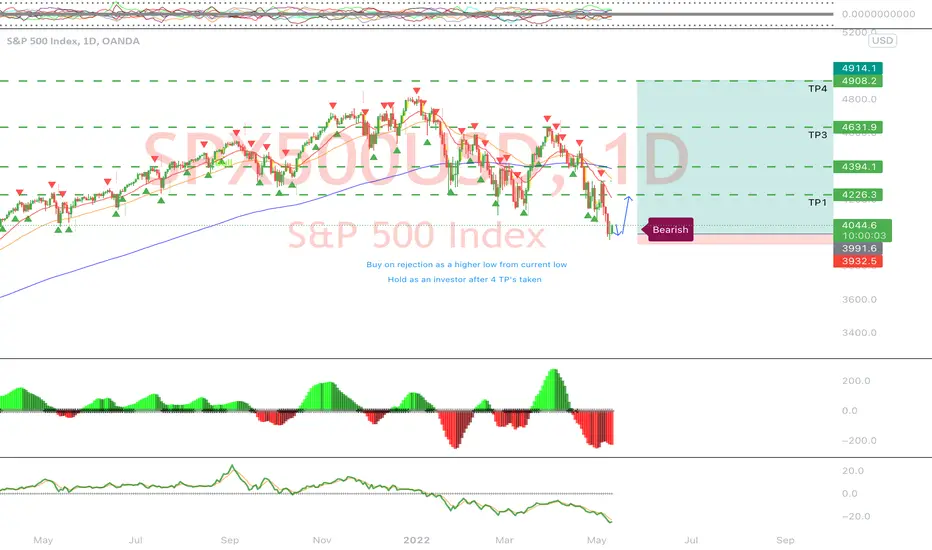
S&P LongS&P has hit below its 50 year mean average meaning investors and institutional buyers are going to be delighted to get back into S&P, we're waiting for a higher low to present itself before buying into S&P, Volume flow on the weekly chart has crossed 0 and we're expecting this to now hold above it, Squeeze indicates it is dying out for sells, exciting times ahead if everything goes to plan. We have several TP's set to secure profit but we will be keeping on our buy long term if price reacts the way we hope it to.
GL
SPX500Are we in a bull market correction? Or is this it & the big Crash is finally here? Have the chickens finally come home to roost?
What my video and comment below let me know what you think.

SPXWould like to see the 618% fib retracment level around 4350 get tested. This should hold for W2 as we continue higher into W3. Levels marked off in a minor trend as I expect this to take a few months 6 plus.

SPX Short, Recession incoming?Potentially SPX falling even more. The macro/geopolitical situation is not looking good. This week will be very important.

US500 LongHey traders, in today's trading session we are monitoring US500 for a buying opportunity around 4220 zone, once we will receive any bullish confirmation the trade will be executed.
Trade safe, Joe.
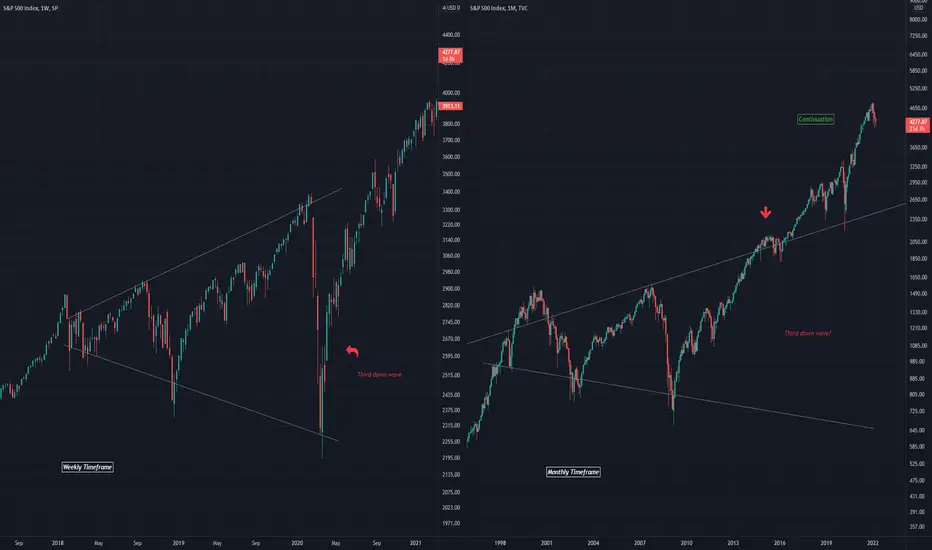
Something That Bothers Me - SPX On the Weekly chart it can be seen that the wedge pattern is respected with three down waves
The same pattern arose on the Monthly timeframe, yet a third wave is absent, and bullish continuation was the result
Thoughts?
$SPX Correction Level PotentialAsset & equity valuations are elevated across the board given unfettered QE. Loose monetary policy and a dovish Fed are no longer sustainable in the face of rising inflation at levels not seen since the late 1970's.
Major SPX retracement levels since 2020:
1. dot.com bubble realized >50% retracement
2. 2008 housing bubble realized >57% retracement
3. 2020 pandemic realized >35% retracement
Bringing these levels forward, SPX has realized nearly 15% correction from ATH... further correction is likely.
Given 3 previous corrections, this gives approximate correction targets of:
1. 35% retrace: 3140
2. 50% retrace: 2400
3. 57% retrace: 2050

S&P 500 A study of Market Cycles: Will History Repeat Itself?This video is a study of the history of The stock market when it comes to bull cycles and consolidation/ranging periods, which I think is a very educational thing to investigate in a period of market correction like the one we are currently living in. Please also refer to the Important Risk Notice.

SPX - Relief rally soon? Key highlights:
1. Bounced off weekly demand
2. Closed just above 50MA on weekly
3. Bounced off weekly support level
4. Formed a high volume Hammer on weekly
5. Formed a bullish engulfing on daily
6. Trying to reclaim 200MA cluster
7. RSI oversold on daily and is curving back upwards.
Conclusion : Expecting a relief rally in the coming week.
Disclaimer : This is NOT investment advice. This post is meant for learning purposes only. Invest your capital at your own risk.
Happy learning. Cheers!
Rajat Kumar Singh (@johntradingwick)

SPX's William % & Stoch weekly conflicting results !!!I could not find a set-up for both indicators ? for tops they both can stay up their hitting the Roof for months !!! .
it is like a dog chasing his tail !!! literally . For bottoms William is much better in searching for one. but, as usual
it gives quite early signal !!! which make it risky if used alone and quite frankly you could get caught in the middle or miss !!!
wish u all the best.

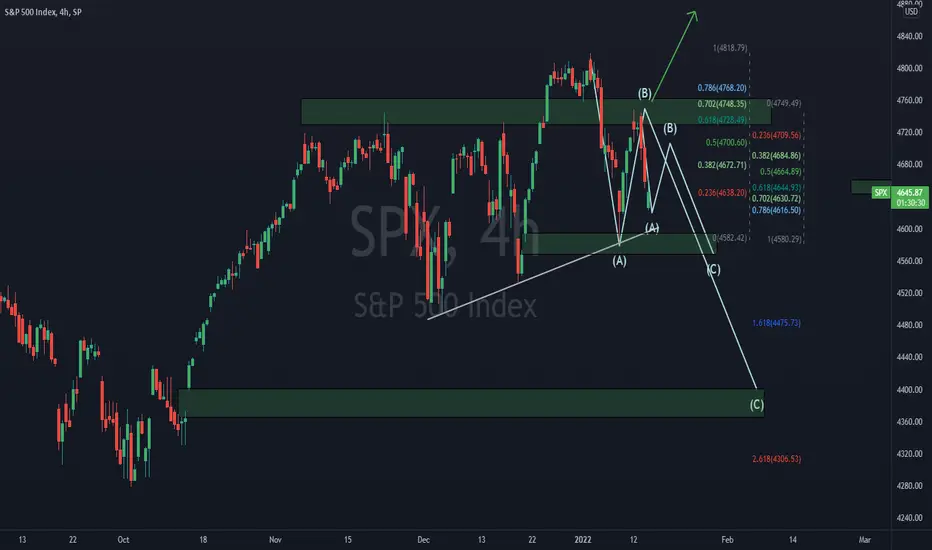
$SPX possible ABC correction $SPX hit a rejection at the 0.702 retracement fib 4745 and potential could be in an ABC correction that could be the start of a larger selloff down to 4400 eventually. $SPX is now currently battling the 4645 area, a break above 4650 should take it to 4700 next where it’ll face resistance and likely resume a downward trend. $SPX breaking above 4745 will invalidated the bearish setup
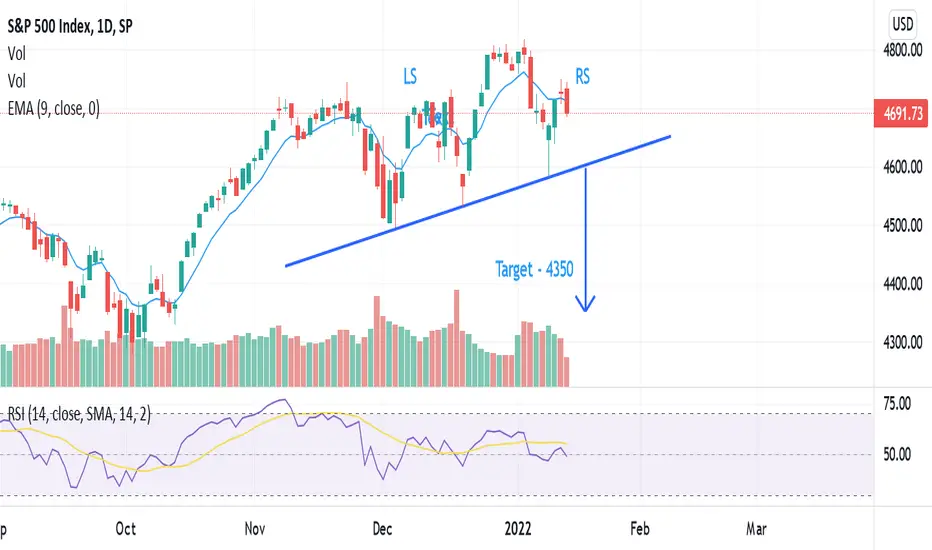
S&P downside target 4350S&P is completing right shoulder. On neck line break, 4350 level may be reached.
Perspective #2 on spxI believe that there are so many ways to view any one pair. Here is another viewpoint/perspective on spx500 aka #bae lol. Instructions on screen. feedback welcome.

SPX500 Rangebound again!!! All levels hitWhat a rebound by the S&P. Check my analysis. Sniper on this lately.

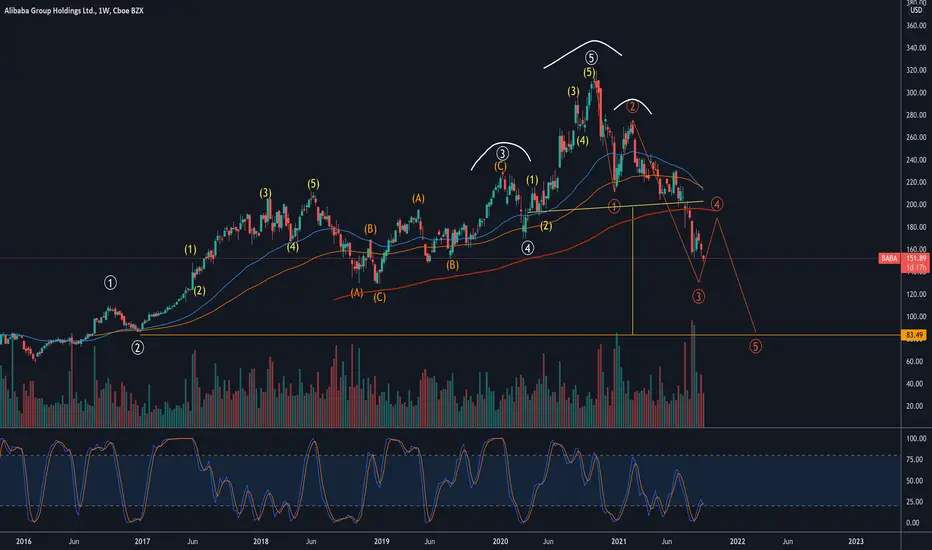
BABABABA looks to be in real trouble here and most likely will land around $84 long term to finish the massive H&S pattern
SPX500SPX500 narrowly missed my 1.618 W3 TP by 60 base appoints or there about, then began what we are now currently in and I am calling W4 and expect another ABC correction here to lead us into W5 which can break above 5,000 EOY
