SPX500 Rangebound againS&P500 had another nice day of price action but still no direction. Tested the lows early and tested the highs late. Selling the rallies and buying the dips until a direction is revealed.
Spxanalysis
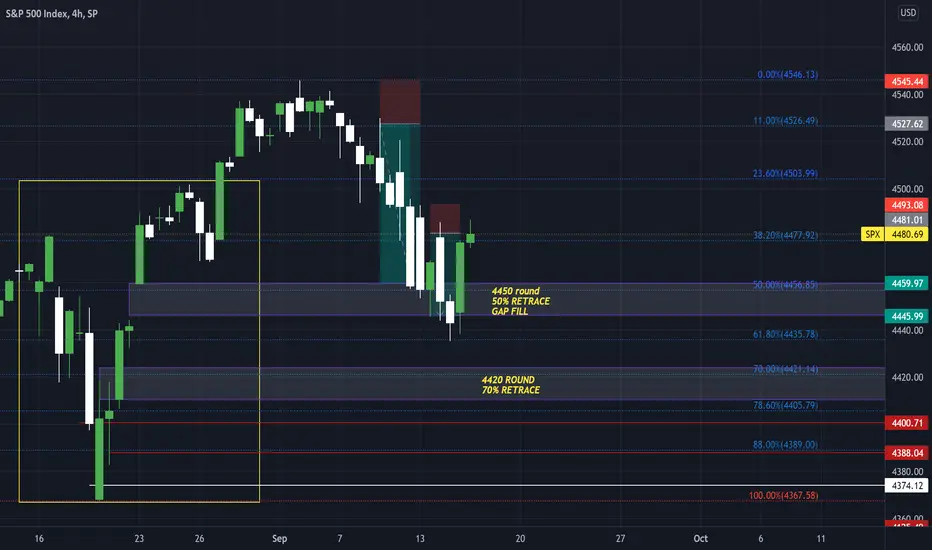
SPX Leading the wayAs SPX has been leading the way this week, today was no different. Starting off with some downward pressure seaking liquidity it found some @61.8 level and gave a really nice reaction pushing towards the previous 2 day highs but not closing above. this leads me to believe were going into a bit of a range so im looking for this rally to be short lived and possible downside Thursday. watch for a positive retail sales number as this could drive the price higher.
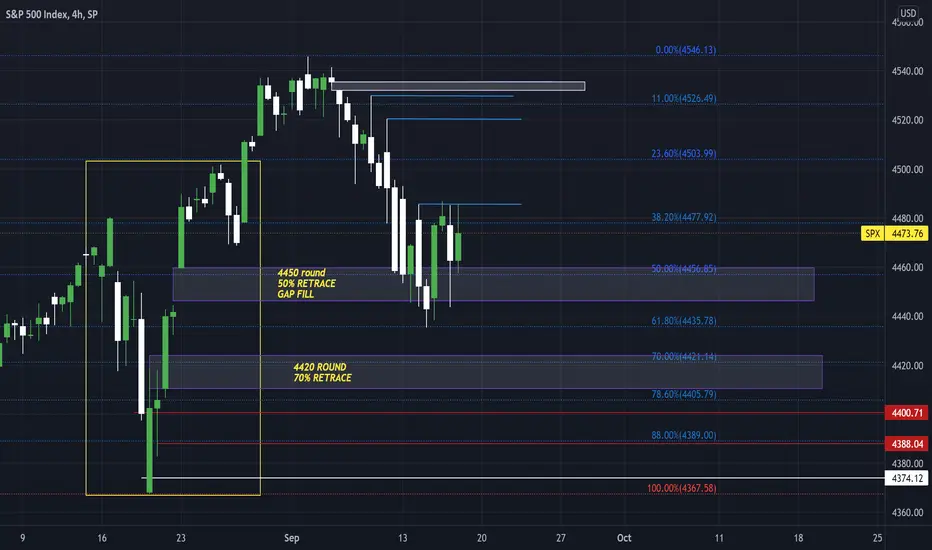
S&P Still showing downward pressure...S&P some beautiful price action today leading to more downside as predicted. could get a decent reaction @4430/61.8 level. im stilll very interested in the 4420 reaction but big focus on the 4400 in between the 79-88% levels.

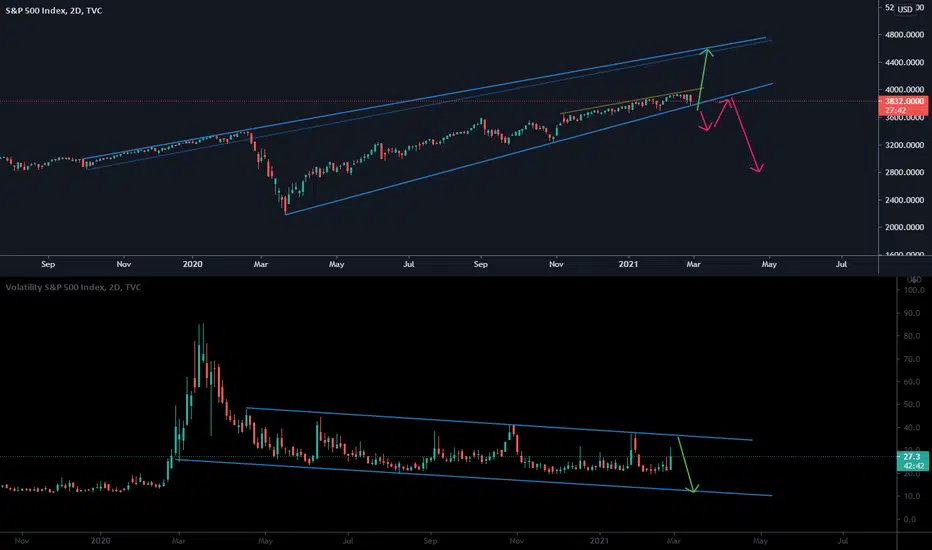
Interesting correlation between S&P 500 and VIXI have noticed this correlation between S&P 500 and Vix.
1. Whenever there is a spike in volatility and volume, that seems to mark the bottom for SPX.
2. This theory seems to be holding for the last 7-8 months.
3. Currently, we are facing a similar kind of situation. The Vix has spiked and the price is tanking.
4. If the theory holds its value, the bottom may be reached soon.
5. However, this is just a probability like every other theory. Hence, we will have to wait and see it out.
Disclaimer: This is NOT investment advice. This chart is meant for learning purposes only. Invest your capital at your own risk.

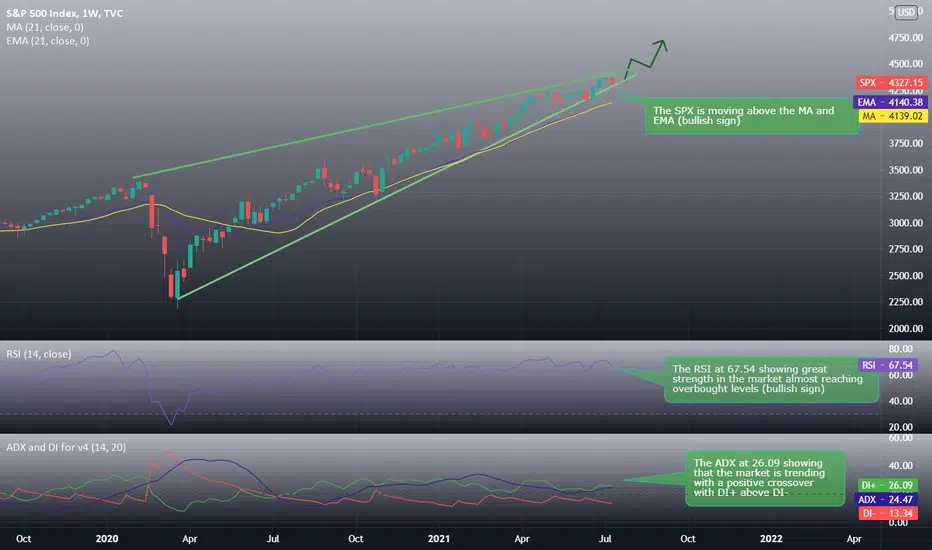
S&P 500 still going up !! Hello everyone , as we all know the market action discounts everything :)
The SPX keeps going on as the Index price moved from 4147.36 to the range of 4371.08 in the last month alone almost a 5.4% increase in 30 days , the price seems to be moving in an rising wedge with no breaking of the trend line, the bulls trying not to lose control to the bears and they hope to keep working to keep this uptrend going and so far it looks like its still on the move.
Using different indicators confirm this movement where we see that :
1_The SPX is at 4327.15 moving above the MA at 4139.02 and EMA at4140.38 (bullish sign)
2_The RSI is at 67.54 showing great strength in the market almost reaching overbought levels, no divergences between the RSI and the market price (bullish sign)
3_The ADX at 26.09 showing that the market is trending with a positive crossover with DI+ at 26.09 above DI- 13.34
Support & Resistance points :
support Resistance
1_ 4315.42 1_4397.65
2_ 4261.28 2_4425.74
3_ 4233.19 3_4479.88
Fundamental point of view :
The prior week saw a bit of excitement around the S&P 500, with the index pulling back on Thursday to trendline support. But the move on the Friday following that sell-off was a pronounced bullish engulfing candlestick that propelled price action to another trendline, helping to mark resistance on a rising wedge pattern.
That bullish engulfing candlestick led into another move of strength on Monday, with prices setting that fresh all-time-high, with another showing up in US markets on Tuesday a few hours after that 5.4% CPI print.
While rising wedge formations will often be approached with the aim of bearish reversals, given the length and force of the move, there’s not yet a bearish trigger nearby. For that scenario to begin to set up, traders would likely want to look for a test below near-term support around 4280, followed by a test of longer-term support around 4127. That could begin to set a reversal framework into motion.
_____________________________ Make sure to Follow and Like for more content _____________________________
This is my personal opinion done with technical analysis of the market price and research online from fundamental analysts for The Fundamental point of view , not financial advice.
If you have any questions please ask and have a great day !!
Thank you for reading.
SPX500USD 2021 July 12 WeekOANDA:SPX500USD
SPX500USD 2021 July 12 Week
Bar 1 confirmed as SOW and move was manifested on 06 Jul. Theme last week was similar
to Nasdaq - trapping longs and shake out
Weekly chart: Net gain from previous bar has diminished, volume has picked up slightly..
Daily chart: No significant weakness observed
H4 chart: Shortening of trust, weakness manifesting
Strategy:
Long on retracement is preferred.
1) If price returns to test bar 2, long when price is supported
2) Last bar shortening of thrust. If price hovers around that zone, we may have short opportunity
3) If you see a sudden spike in price and bar closes on its low, forming an upthrust, don't chase
Like and follow if you find this useful :)
Have a successful week ahead in whatever you do

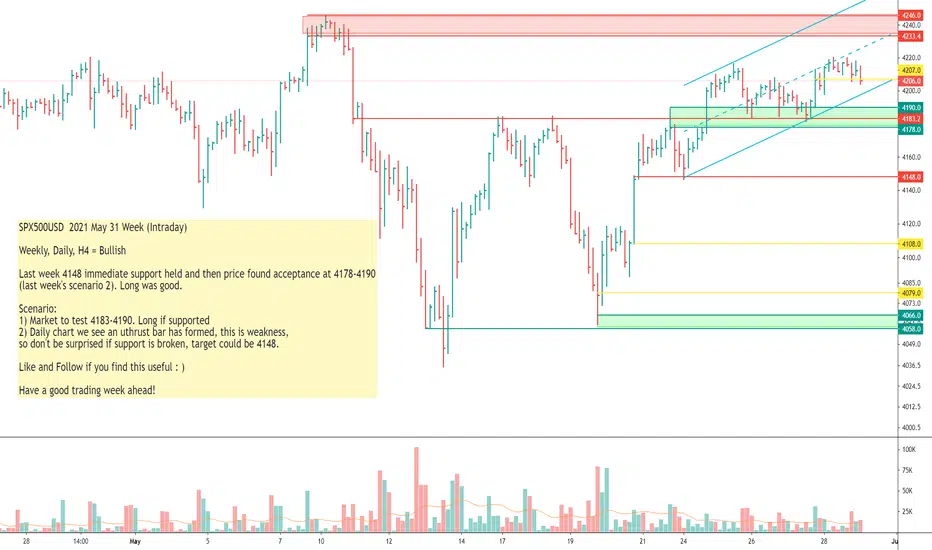
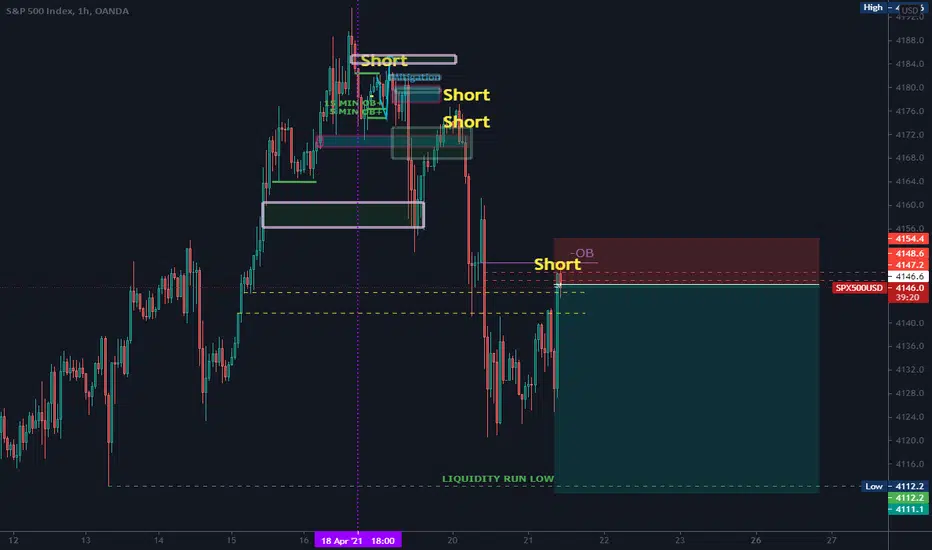
SPX500USD 2021 May 31 Week (Intraday)
OANDA:SPX500USD
SPX500USD 2021 May 31 Week (Intraday)
Weekly, Daily, H4 = Bullish
Last week 4148 immediate support held and then price found acceptance at 4178-4190
(last week's scenario 2). Long was good.
Scenario:
1) Market to test 4183-4190. Long if supported
2) Daily chart we see an uthrust bar has formed, this is weakness,
so don't be surprised if support is broken, target could be 4148.
Like and Follow if you find this useful : )
Have a good trading week ahead!
NYSE Percent of Stocks Above 200d Averages & 50% Middle line setStock above their 200d averages: (Below 10% )
--------------------------------------------------------------
*6 oct, '08 -16 Marh '09 = 161 Days = End of crash
*3 Oct '11 = 7 Days = Bottom
*24 Dec '18 = 7 Days =Bottom
*9 March '20-30Mar '20 = 21 Days = bottom
********************************************************
Stock above their 200d averages:(Between10%- 20% )
-----------------------------------------------------------
*22 Jul '02 = 7 Days = End of Crash
*7 Oct '02 = 7Days =End of Crash
* 14 Jan '08-21Jan '08 =7 Days = fasle signal
*3 Mar '08-13Mar '08 =14Days = Risky during a crash!
*30 Jun '08-14 Jul ' 08 =21 Days = False signal.
* 21 Nov '11 = 7 Days =Bottom
*24 Aug '15 = 7 Days =Bottom
*11 Jan '16- 16 Feb '16 =42 days = Bottom
----------------------------------------------------------------
Stock above their 200d averages:(Above 90% )
*5 Jan '04 = 21 Days= Beginning of a new grand cycle IMO
*24 Aug '09-19Oct '09= 63Day = Beginning of N.G.Cycle IMO
----------------------------------------------------------------
Stock above their 200d averages:(Between 80%-90% )
* 1 followed by Bull Markets
*5 followed by Pullbacks. (4 %-7%-19%-4%-6%)
* How would you now live in the market that
this indicator will not keep going up , big opportunity
cos.
___________________________________________
* 1/ Conclusion:- Below 10% is your best friend Ever
2/ Between 10%-20% = 62 % success rate =Big Draw
back During crash long time to recover !!!
3/ Above 90 % Beginning of new Grand Cycle IMO (nothing else)
4/ Between 80%-90 % =80% we will get a pullback 20% bull Market
--------------------------------------------------------------------------------------
Trade set up Crossing below 50 & crossing back
above 50 is where most of the bottoms 25 signals:
-----------------------------------------------------------
crash
bottom
bottom
correction
bottom
up siwng
bottom
bottom
up swing
bottom
correction
bottom
correction
bottom
bottom
boottom
bottom
correction
bottom
bottom
crash
bottom
bottom
bottom
bottom
------------------------
92 % of bottoms happened between
Orange dotted and Blue dotted
-------------------------------------------------------------------------
Four Golden Cross on this indicator:
Bulls: 30.36 %
Bulls 21.71 %
Bulls 25.18 %
Bear 12.49 %
Incoming soon ?
--------------------------------
Conclusion:
75% Bull market
25% bear followed by big crash
--------------------------------------------------------------------------
**************************************************************************
*************************************************************************
************************SUMMERAY*************************************
*****************************************************************************
1/Getting a Golden Cross soon 75 % bull market 25% Crash
2/ Bottoms of Crashes, Pullbacks and corrections
happened using the trade set up. Crossing
Below 50 and Crossing up again above 50.
25 signals with 92 % success rate.
3/Below 10 % is your best ever friend, the problem
it does not happen allot one in a cycle.
4/between 10%-20% 62 % success rate ( Not crossing below 10%)
5/ Above 90% is confirmation of the beginning
of a new cycle ( we are about to get one soon)
6/ Between 80%-90% = 80% we will get a pullback between (4%-19 %) (Not entering the 90%s)

SPXThinking this, IH&S pattern has not completed yet up to 4240 zone. & bulls r eating the dips up, daily still looks weak but 4050 will probably be the bottom for now & then back up to 4240 and probably keep going higher towards 4400. The OTC penny stuccos will thrive b c it will be risk on.
Could be wrong but thats where my bets are placed. GL everyone

SPX500USD 2021 Apr 12 Week (Intraday)
OANDA:SPX500USD
SPX500USD 2021 Apr 12 Week (Intraday)
Congrats to those who took long trade per last week's analysis.
Market was kind to materialize the AB=CD target of 4125, and reached 4132
on Friday.
Last H4 candle closed off its high, and we have reached the supply line of the
upward channel. This may present opportunity for short trades on LTF.
And again, also long on pullback
Like and Follow if you find this useful : )
Have a good trading week ahead!

SPX500USD 2021 Apr 05 Week (Intraday)
SPX500USD 2021 Apr 05 Week (Intraday)
Weekly / Daily / H4 = bullish
31 Mar - 01 Apr market advanced, albeit on reducing volume. Mark up
likely to continue, so we can look for long opportunity on lower TF when
pullback happens, preferably at 3991 or green zone.
Entry preference will be a the SR and the yellow line price reaction zone.
Like and Follow if you find this useful : )
Have a good trading week ahead!

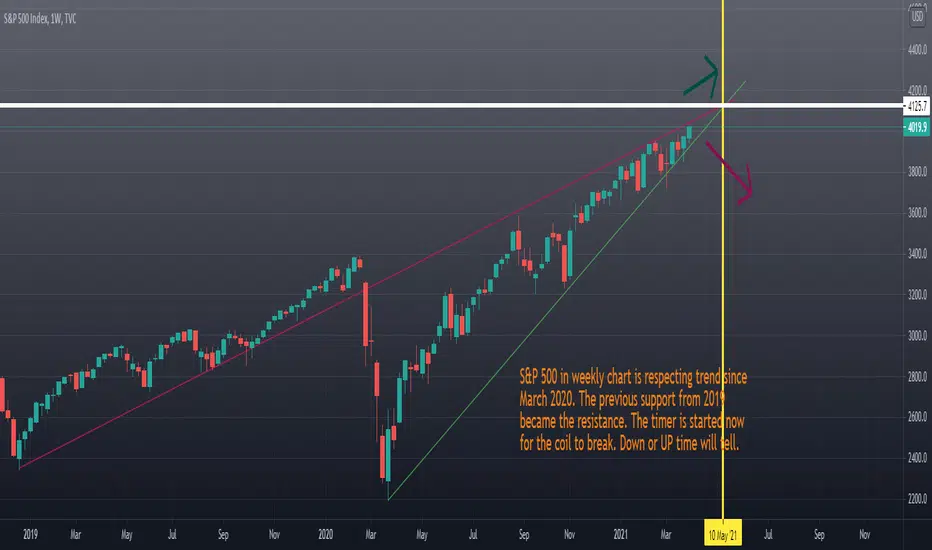
SPX (S&P500) reaching a decisive momentS&P 500 in weekly chart is respecting trend since March 2020. The previous support from 2019 became the resistance. The timer is started now for the coil to break. Down or UP time will tell.
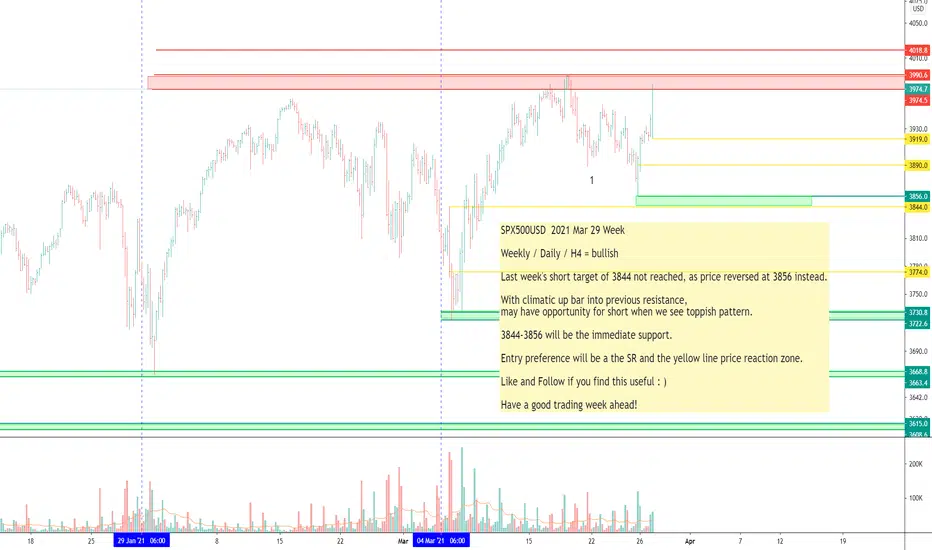
SPX500USD 2021 Mar 29 Week
OANDA:SPX500USD
SPX500USD 2021 Mar 29 Week
Weekly / Daily / H4 = bullish
Last week's short target of 3844 not reached, as price reversed at 3856 instead.
With climatic up bar into previous resistance,
may have opportunity for short when we see toppish pattern.
3844-3856 will be the immediate support.
Entry preference will be a the SR and the yellow line price reaction zone.
Like and Follow if you find this useful : )
Have a good trading week ahead!
US Market Technicals Ahead (15 Mar – 19 Mar 2021)We have officially mark the start of daylight saving time (DST), as North America have moved ahead an hour on Sunday 14th March. US and Canadian markets will trade one hour earlier than usual in Asia time.
The Federal Reserve’s highly anticipated monetary policy meeting will be the big deal for global financial markets in the week ahead. Last week, Fed Chairman Jerome Powell said that the economic reopening could boost inflation temporarily and that the US economy was going to start to see stronger employment in the next few months. Still, the Fed chief also said that the central bank was still a long way from its inflation and employment targets. Investors would be eager to hear if the central bank will take any measures to bring bond yields down, which saw the 10-year yield surge above 1.60% to the highest in a year on Friday.
Besides the Fed meeting, U.S. retail sales data will be in focus for further indications on the strength of the reopening rebound.
Meanwhile, in earnings, there are just a few big names set to report their latest financial results, with global economic bellwether FedEx ($FDX) and athletic apparel giant Nike ($NKE) likely to draw the most attention.
Here’s what you need to know to start your week.
S&P500 (US Market)
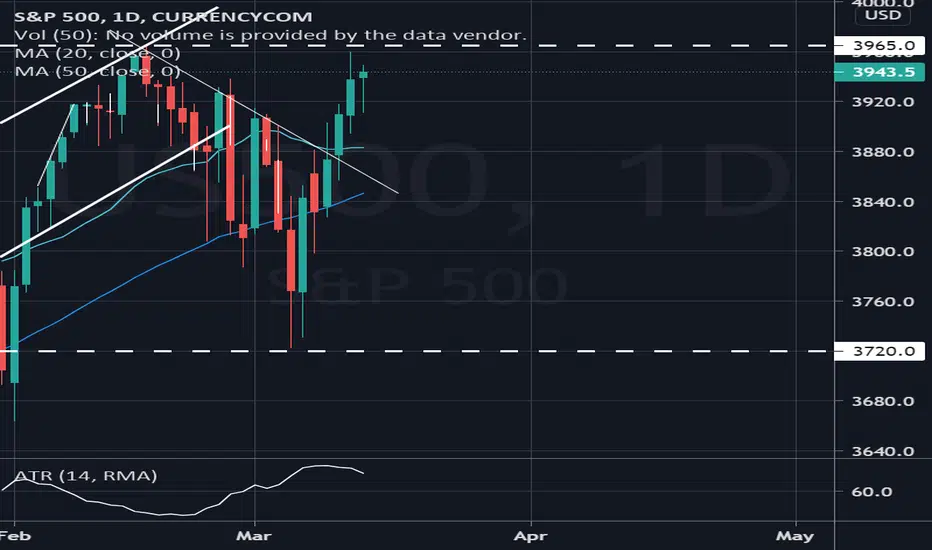
The benchmark index ($SPX) continued its recovery to end up +2.63% (+100.8 points) for the week, gaining traction to recapture its all time high at 3,965 points, a mere 20 points (0.5%) away.
At the current junction, $SPX have managed to trade back above its 20DMA & 50DDMA, along with a negation of its short term trendline resistance highlighted last week. Immediate resistance for $SPX is currently at 3,965, a continuation to break its all time high level.
Federal Reserve Policy Meeting
The Federal Reserve is expected to leave its benchmark interest rate unchanged at the conclusion of its two-day policy meeting at 2:00PM ET (18:00 GMT) on Wednesday, keeping it in a range between 0.0%-0.25%.
Perhaps of greater importance, Fed Chair Jerome Powell will hold what will be a closely watched press conference 30 minutes after the release of the Fed’s statement.
Investors will be looking for clear signs that Powell and fellow policymakers are concerned about the current spike in yields amid mounting inflation expectations.
U.S. Retail Sales
The Commerce Department will release data on retail sales for February on Tuesday at 8:30AM ET (12:30 GMT).
The consensus forecast is that the report will show retail sales fell 0.6% last month, following January’s surge of 5.3%.
Excluding the automobile sector, core retail sales are expected to drop 0.1%, after climbing 5.9% in the preceding month.
Rising retail sales over time correlate with stronger economic growth, while weaker sales signal a declining economy.
Consumer spending accounts for as much as 70% of U.S. economic growth.
FedEx, Nike Earnings
The fourth-quarter earnings season has all but wound down, however results are expected from a number of big names in the week ahead, with most of the focus falling on FedEx, and Nike, which both report Thursday after the close.
Other notable companies reporting this week include Dollar General ($DG), Crowdstrike ($CRWD), Coupa Software ($COUP), PagerDuty ($PD), and Sundial Growers ($SNDL).
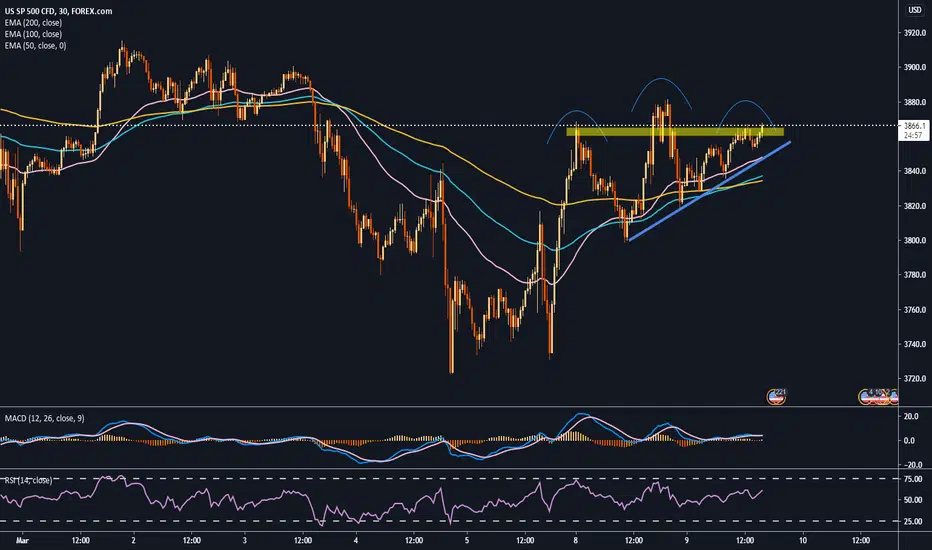
Head and Shoulders on SPX? SPX is drawing a Head and Shoulders pattern, it could be interesting if can cross the short-term uptrend.
US Market Technicals Ahead (08 Mar – 12 Mar 2021)President Biden’s $1.9 trillion coronavirus aid bill was passed by the Senate on Saturday and sent back to the House for approval which will take place on Tuesday. Investors will be closely watching the progress of this aid bill through Congress this week against a backdrop of concern over what such a large stimulus package could do to inflation and interest rates. Market participants will also be focusing on U.S. inflation figures with a report on the consumer price index due out on Wednesday and the producer price index scheduled for Friday. In Europe, the European Central Bank will hold its latest policy meeting on Thursday.
Here’s what you need to know to start your week.
S&P500 (US Market)
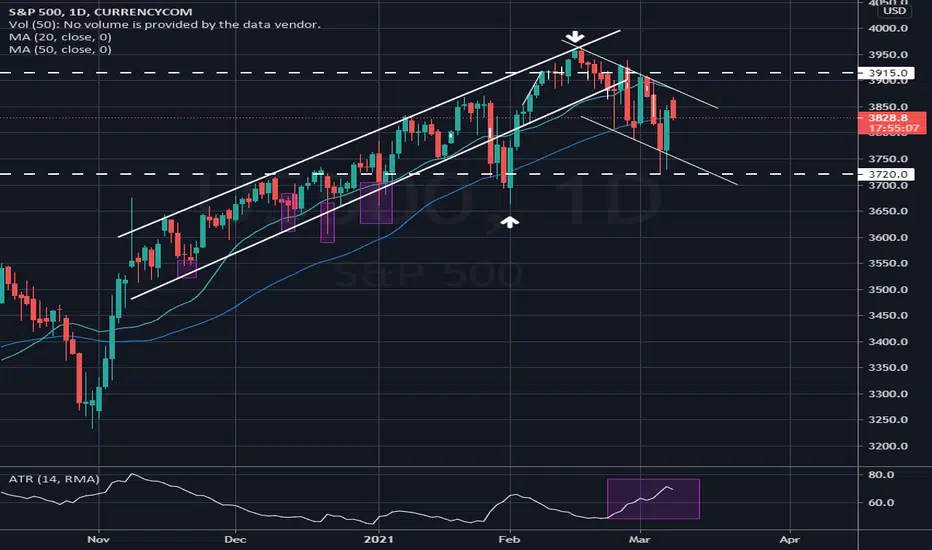
The benchmark index ($SPX) reversed most of its losses in late Friday to end up +0.83% in a sign some bargain-hunters may have already swooped in after a bumpy week. This comes after $SPX decline over -3.55% in three consecutive session.
At the current development (since last week’s highlight on the structural breakdown of $SPX)
Price Action remains below 20DMA
Price Action remains below 50DMA
Price Action is resisted at lower band of 4 Months uptrend channel
Further increase of implied volatility since 16th Feburary 2021
$SPX has a short term establishment of Lower Highs and Lower Lowers for a short term consolidated downtrend channel of 100 points range
At the current junction, $SPX remains bullish at a mid-term higher low. Further signs of weakness in this correction will require $SPX to breach its immediate support level at 3,720.
Immediate resistance for $SPX is currently at 3,915, a breakout of its short term downtrend channel.
Stimulus: a double-edged sword?
The pandemic relief package will give a powerful boost to the economic recovery and to the stock market, but optimism has been offset by fears over rising inflation and interest rates.
Investors have taken the recent run-up in bond yields – which has propelled the benchmark 10-year Treasury yield to levels not seen since before the pandemic – as a sign of potentially damaging inflation expectations.
But U.S. Treasury Secretary Janet Yellen indicated Friday that higher long-term Treasury yields were a sign of expectations for a stronger recovery, not of increased inflation concerns.
U.S. inflation figures
Investors will be closely watching U.S. inflation figures on Wednesday and Friday amid worries over the potential implications of rising price pressures.
Last week Fed Chairman Jerome Powell said that even if prices jump as anticipated this spring, “I expect that we will be patient,” and not change monetary policies that need to remain supportive until the economy is “very far along the road to recovery”.
ECB meeting
Thursday’s ECB meeting is the main event for the euro zone after extended lockdowns in the first quarter. Policymakers will assess the damage to economic growth against a background of a vaccination rollout that is struggling to gain traction, particularly compared with similar efforts in the UK and the U.S.
ECB head Christine Lagarde will also announce the bank’s new quarterly forecasts at the post policy meeting press conference.
Besides the ECB meeting, the euro zone will release figures for January industrial production on Friday, which are expected to contract.
SPX 50 Days MA, the line's relationship with price. (VERY OUD)The strangest thing you can notice (beside major correction, and pullback)
the more we have fake break down of the daily 50 MA the more steam we get
to the up side. VERY STRANGE RELATIONSHIP ???!!!


SPX let's see, I hope the bulls come thru here because I am long and hurting a bit more than I'd care to admit. ;)

SPX DO NOT SHORT YETas long as this "buy the dip" hype continues , this market still can run up for another 15 to 20%.
wait for breakdown & confirmation for bearish confidence.
good luck.
SPX's weekly update. First week of March 2021In coming months Puts will be bought, with "Golden Cross" on PC.
wish you all the best.
