SPX / M2 paints a very different picture of the global marketThis chart shows the SPX/M2 and essentially paints a picture of the SPX when accounting for inflation.
All the "gains" made in the time following the 2008 crash, after factoring inflation in, simply put price or "value" back to where it peaked.
How interesting that the 2020 crash should occur at such a pivotal TA level, forming a near perfect sweep of highs and double top.
From this view, it looks as though the price action following the 2020 march lows is simply amounts to a bearish retest.
Will be an interesting one to watch as the money printer fires up yet another round of QE.
Brrrr, brrrr, brrrr.....
Spxanalysis

SPY Looking To Breakout - Cup & Handle Forming.From now on I'm going to be leaving my bias out of these posts as I wouldn't want to corrupt anyone else's bias. With that being said, I'm going to let this chart that I made for your review speak for itself.
I will say one thing tho. If I had seen this setup before close on 7/10 I would've swung calls into today.
Possible scenarios:
(Trade with caution)
Let's see how this turns out though. We'll either test $322 and breakthrough to complete the V, hit $322 and consolidate for a couple days, or see a strong rejection around the $320 price point, give or take.
Here's a brief breakdown of the setup:
A bull flag pending breakout with a cup and handle setup confirming a possible breakout.
P.S.
Please bare with me as I'm still fairly new to TradingView and learning how to better my analysis. Feel free to give me a follow or a comment if you like the setup.
Thanks,
Ola.

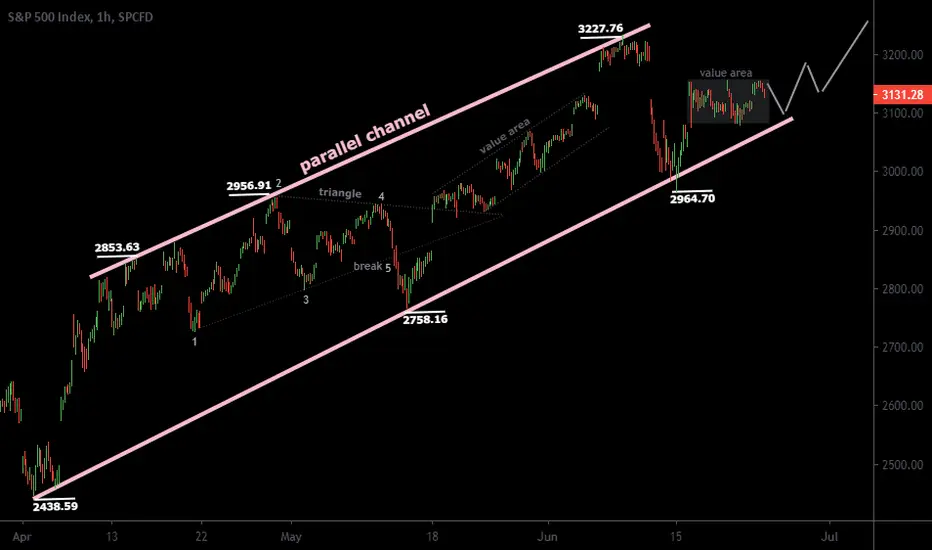
Stock trade on SPX:Stock will move up-to 3090.65 from current level.
SPX is trading in the parallel channel.
A value area is creating between the price 3159.88 to 3083.00.
A Small resistance have been created at 3159.88
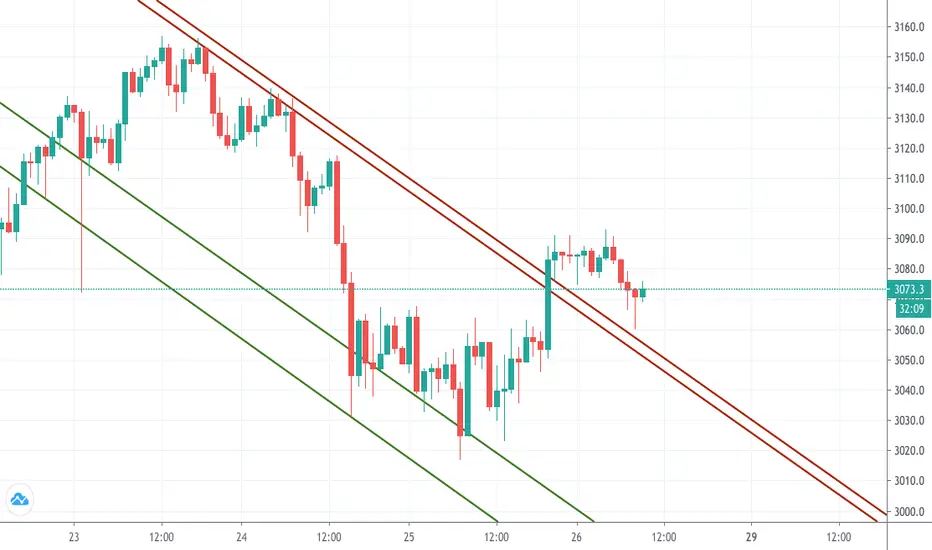
SPX Analysis 1H
Hello traders, here is the analysis from our team:
Price NEED to stay above 3080 with pullback at or above price to seek possible new high. Good luck.!!!
Let us know in the comment section below if you have any questions.😉
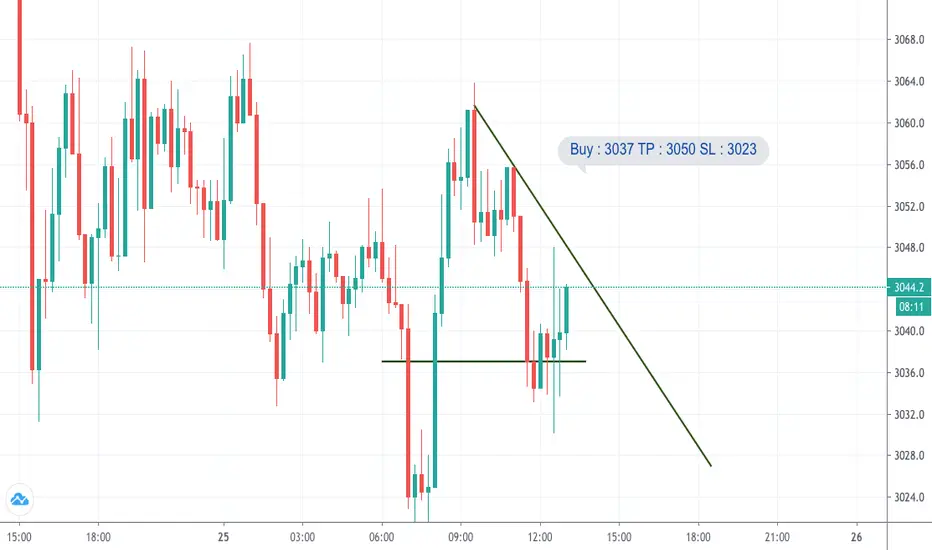
SPX AnalysisHello traders, here is the analysis from our team :
In future buy market@
BUY - 3037
TP - 3050
SL - 3023
Let us know in the comment section below if you have any questions.😉
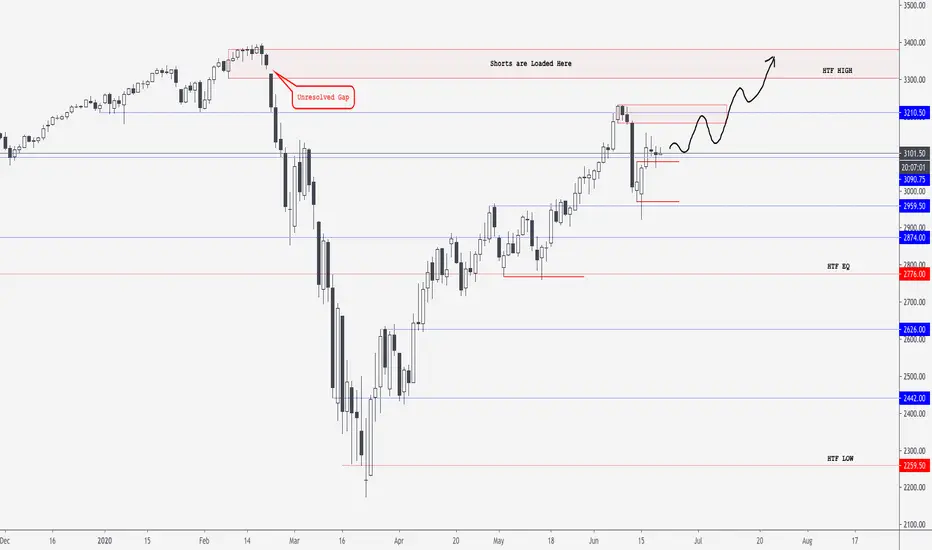
S&P500 - Bull market isn't overUpdated my #SPX roadmap. There is small unresolved gap at Supply around 3300 that most likely be filled. I would like to see how this area be treated after liquidity is taken. We just made Higher Low on HTF and keep moving higher. Double top is inevitable. $ES $MES
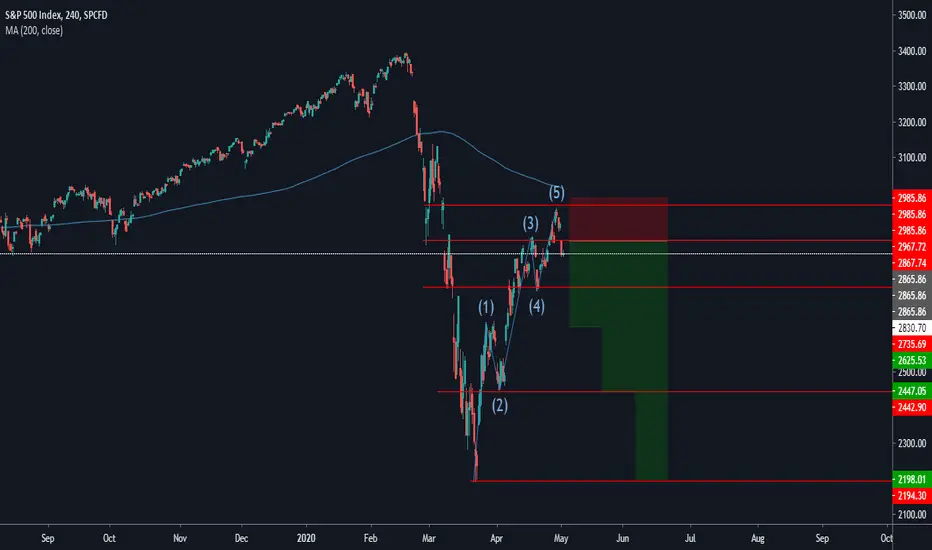
SPX - to complete a cycle? Bearish progression due to market environment and news.
Expected fall till 2400-2150.
Comments, likes appreciated.
-heish

S&P500 is the new bubble ? 2001 & 2008 crisis fractalsSPX S&P500 - Fractals from financial
Same Story :
- Breaking Daily EMA 200
- BullTrap for retest
- Second Wave down to touch Monthly EMA 200
Stocks Market seems not legit - Looking for
- Waiting for EMA 200 Monthly
- Panic Mode under EMA 200 Monthly
If SPX don't touch my area, I just look the future : CryptoMarket
Play Safe
Not a Financial Advice

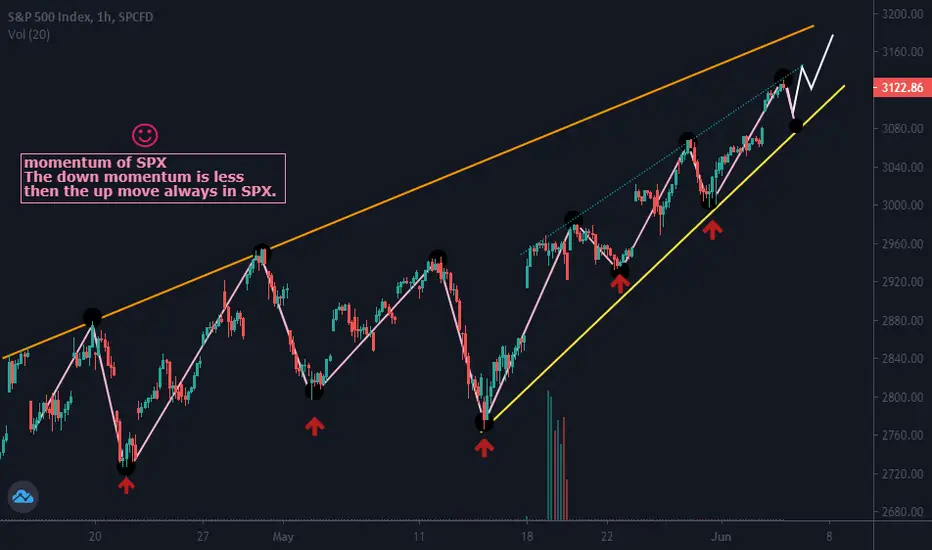
A great place to do trade.Momentum of SPX
The down momentum is less then the up move always in SPX.
From the current price of SPX the price will move little down till it's support, as there we can see a small resistance but strong.
After reaching its support the price can be bearish and move up.
In the chart price is moving slowly in up direction with little penetration towards down. This thing is happening in every steps of SPX.
#SPX ANALYSIS.. I think we will see the pattern I mentioned in the #SPX's weekly chart in many indices in the coming years.. I think that the price movements on the global scale that may be experienced in the indices are gradually becoming clearer..
The chart is weekly, it should be followed in the long run; Price movements in time may not correspond exactly as I have stated on the chart, but in the future; if #SPX cannot provide permanence above the trend line I have indicated with black dashed line, I think it will be very meaninful to follow the pattern in question.. You can find important points on the chart in the long run.. Let's see what the time will show..
What I wrote is about strong possibilities that most investors and analysts do not express or expect.. Please do your own due diligence when it comes to trading.. Invest at your own risk..
I wish you all the best..

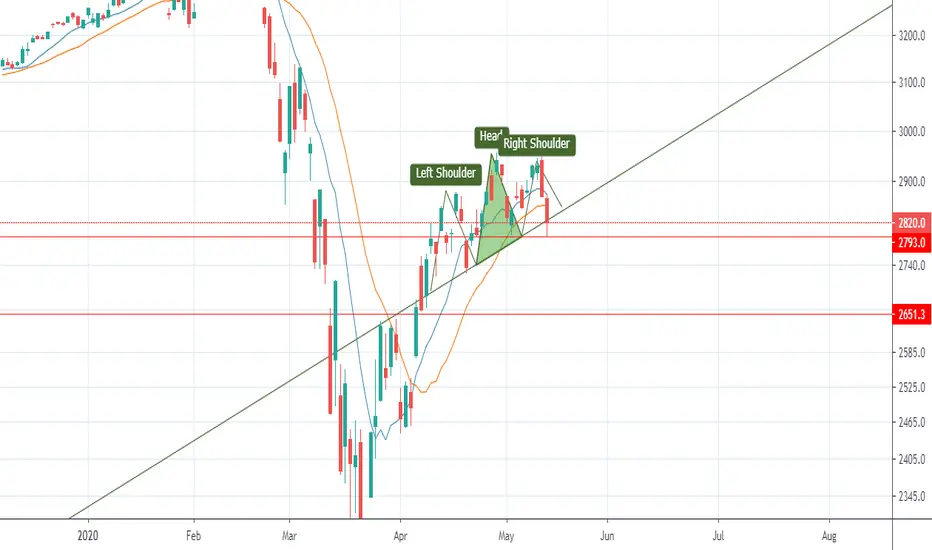
#SPX SHORT.. We see head and shoulders pattern in daily chart of #SPX, also ma10 and ma20 turned their directions to negative.. We can easily say that there are some bearish signs for #SPX.. It is likely that the price will go down.. We will wait and see..
Disclaimer: Please do your own due diligence when it comes to forex-trading.. Invest at your own risk..
I wish you all the best..
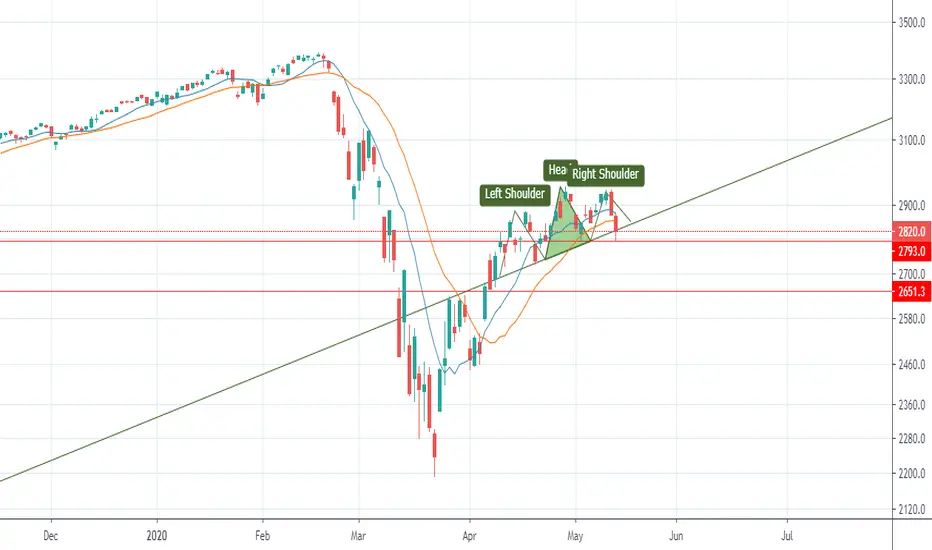
#SPX ANALYSIS.. We see head and shoulders pattern in daily chart of #SPX, also ma10 and ma20 turned their directions to negative.. We can easily say that there are some bearish signs for #SPX.. It is likely that the price will go down.. We will wait and see..
Disclaimer: Please do your own due diligence when it comes to forex-trading.. Invest at your own risk..
I wish you all the best..
s&p buyS&P or SPX We see them resuming to the upside, any changes we will update it as it goes , give this chart a like if you enjoying our forecast


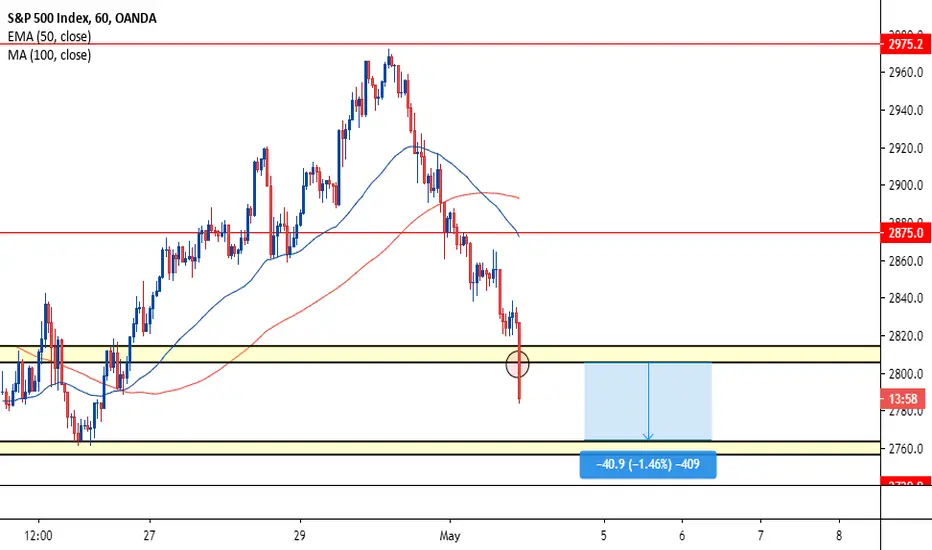
Sell in May & Go Away - Hammer Time!So many confluences on the Daily:
1) .618 being tested
2) 200 MA + 100 MA
3) The point when S&P took a huge dump
...
It is good RR to short this range.
Target 2,2XX to form a double bottom or even lower...

SPX500 SELL!!SPX500 is in a DOWNTREND therefore i'm going in for a sell, however, if you are looking for a good entry, look for a pullback in either 15 minutes timeframe or the 5 minutes timeframe. You can sell NAS100 and US30 as well because they move the same.

SPX500 LONG IDEA!! NO BULLSHITSPX is flying, that's all i gotta say lol...literally enter the trade and hold till the next resistance, you can swing it as well to the GREEN ZONE.

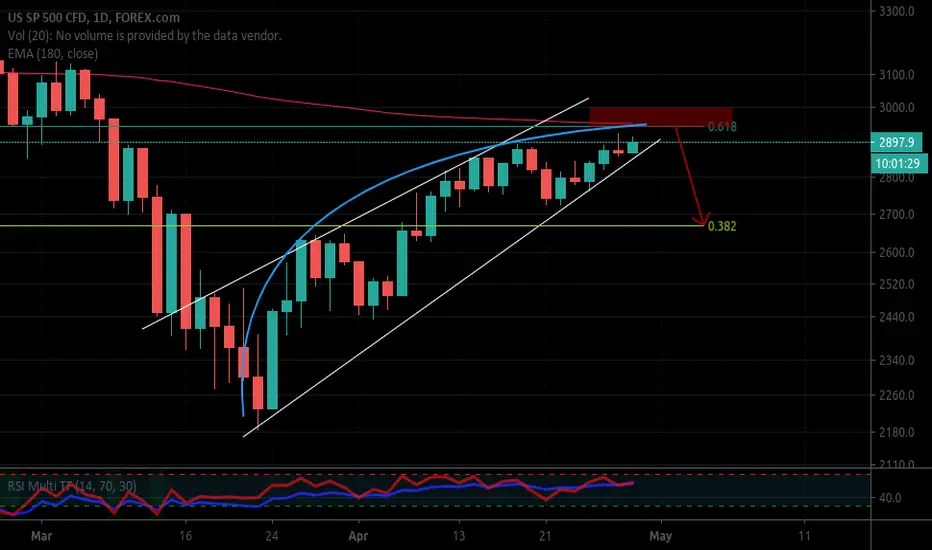
SPX Outlook for this next two weeks.Perhaps there are a thousand more scenarios although I can see how the index has been losing momentum. Could it be that the market stimuli have not been sufficient and we are facing the continuation of the correction?
I have drawn in yellow my main idea, that this is falling apart again. In another colour, a kind of orange, the idea that the market is still sleepy and that can go higher (I can not imagine how, but the probability exist.
What are your thoughts? What part are you on?
Thanks!

